
On the Design of a Traffic Observatory Application based on Bus
Trajectories
Kathrin Rodriguez
1
, Marco A. Casanova
1
, Luiz André Paes Leme
2
, Hélio Lopes
1
, Rafael Nasser
1
and Bruno Guberfain do Amaral
1
1
Department of Informatics – Pontifical Catholic University of Rio de Janeiro, RJ, Brazil
2
Institute of Computing, Fluminense Federal University, Niteroi, RJ, Brazil
Keywords: Traffic Modelling, Trajectory Data Mining, Data Stream Processing.
Abstract: Buses, equipped with active GPS devices that continuously transmit their positions, can be understood as
mobile traffic sensors. Indeed, bus trajectories provide a useful data source for analyzing traffic, if the city is
served by a dense bus network and the city traffic authority makes the bus trajectories available openly, timely
and in a continuous way. This paper explores the design of a traffic observatory application based on bus
trajectories, defined as an application developed to detect when the traffic patterns of selected streets of a city,
observed during certain periods of time, deviate from the typical traffic patterns. The major contributions of
the paper are a list of requirements for traffic observatory applications, a detailed discussion of key operations
on bus trajectories and a description of experiments with a traffic observatory prototype using bus trajectories
made available by the traffic authority of the City of Rio de Janeiro.
1 INTRODUCTION
An intelligent control and management system, that
has a data-driven approach for modelling, analysis,
and decision-making (Zhang et al. 2013), may help
achieve better traffic control and create mobility
plans. As their main input data, such systems adopt
trajectories, generated by GPS devices installed in
vehicles (Shi et al. 2008), such as taxis (Zhu and Xu
2015) and buses (Sunil et al. 2014).
Indeed, buses, equipped with active GPS devices
that continuously transmit their position, can be
understood as mobile traffic sensors. A raw bus
trajectory is a continuous data stream acquired from
such a GPS device.
Bus trajectories provide a useful data source for
analyzing traffic, if the city is served by a dense bus
network and the city traffic authority makes the bus
trajectories available openly, timely and in a
continuous way. Under such conditions, bus
trajectories are a better data source to analyze traffic
than data generated by proprietary traffic applications
that acquire the position of private cars and that
depend on drivers’ volunteered traffic feedback.
Indeed, bus trajectories are a stable data source, in the
sense that they cover the same set of streets, at
predictable regular intervals, if traffic conditions
permit. In fact, this is the point: if the buses in a given
area are not running according to the usual schedule,
then a traffic perturbation is the most probable cause.
Furthermore, if stored in an adequate way, bus
trajectories will provide, over time, a historical
picture of how the city evolved, much in the same
way as satellite imagery gives a historical picture of
how an urban area grew.
This paper explores the design of a traffic
observatory application based on bus trajectories,
defined as an application developed to detect when
the traffic patterns of selected streets of a city,
observed during certain periods of time, deviate from
the typical traffic patterns. The design of such
application poses at least the following challenges:
(1) How to analyze the bus network (served by GPS-
equipped buses) to select streets whose traffic can be
monitored with the help of the bus trajectories; (2)
How to mine a bus trajectory dataset to uncover
traffic patterns; (3) How to detect traffic anomalies,
estimate their impact and provide explanations, using
data sources other than the bus trajectories; (4) How
to maintain and compare different versions of the
street network, the bus network and the traffic
patterns, to help city planners assess changes.
Rodriguez, K., Casanova, M., Leme, L., Lopes, H., Nasser, R. and Amaral, B.
On the Design of a Traffic Observatory Application based on Bus Trajectories.
In Proceedings of the 18th International Conference on Enterprise Information Systems (ICEIS 2016) - Volume 1, pages 215-222
ISBN: 978-989-758-187-8
Copyright
c
2016 by SCITEPRESS – Science and Technology Publications, Lda. All rights reserved
215

The major contributions of this paper are three-
fold: (1) a list of requirements for traffic observatory
applications; (2) a detailed discussion of key
operations on bus trajectories; (3) a description of
experiments with a traffic observatory prototype
using raw bus trajectories made available by the
traffic authority of the City of Rio de Janeiro, which
corroborate the usefulness of the proposed approach
to monitor traffic.
The rest of this paper is organized as follows.
Section 2 lists the basic requirements for a traffic
observatory application. Section 3 introduces the
main concepts related to street networks, bus
networks and trajectories. Section 4 discusses some
key operations on bus trajectories. Section 5 describes
experiments with real data. Section 6 covers related
work. Finally, Section 7 contains the conclusions.
2
REQUIREMENTS FOR
A TRAFFIC OBSERVATORY
APPLICATION
In this section, we enumerate the major requirements
that a traffic observatory application, based on bus
trajectories, must meet.
(1) Select Streets Whose Traffic can be Monitored
with the Help of Bus Trajectories.
The first requirement quite simply reflects the fact
that the traffic sensors are the buses equipped with
GPS. The application must be able to analyze the bus
network and select those streets that are frequently
crossed by buses and whose traffic can, therefore, be
monitored by analyzing the bus trajectories.
This requirement depends on a clear definition of the
concepts of street network, bus network and monitored
street network, the subset of the street network that can
monitored by analyzing the bus trajectories.
(2) Discover Traffic Patterns.
The second requirement refers to the basic question
of defining what should be considered normal versus
abnormal traffic behavior. Thus, the application must
be able to mine a bus trajectory dataset to discover
traffic patterns for select street segments, over a given
period of time.
In addition to the definition of street network and
bus network, this requirement depends on the
concepts of traffic patterns, in the form of traffic flow
patterns and travel time patterns.
(3) Detect and Explain Traffic Anomalies, and
Estimate their Impact.
The third requirement covers the core of a traffic
observatory application. It refers to monitoring the
traffic for select street segments, over a given period
of time, to uncover the observed traffic patterns,
compare them with typical traffic patterns and,
finally, mark the observed traffic patterns that deviate
from the typical patterns above a given threshold.
Furthermore, this requirement includes
identifying traffic events from additional data sources
that might cause the deviations.
(4) Maintain and Compare Different Versions of the
Street Network, the bus Network and the Traffic
Patterns.
The last requirement imposes that the application
must maintain versions of the street network, the bus
network, the monitored street network and the traffic
patterns. The application must also support
comparing different versions of the street and bus
networks to assess the impact of changes on select
street segments, which provide a useful tool for city
planners.
3 STREET NETWORKS AND
TRAJECTORIES
In this section, we define the concepts identified in
Section 2 and introduce the concept of trajectory.
3.1 Street Networks
For the purposes of this paper, a geo-referenced street
network is modelled as a labelled, directed graph
G=(V,E,nl,el), where the node labelling function nl
associates a geo-referenced point (in an appropriate
geographic coordinate system) with each node in V
and the edge labelling function el assigns a geo-
referenced line segment (in the same the geographic
coordinate system used by the node labelling
function) to each edge in E. Intuitively, the edges
represent street segments and the nodes indicate the
start and end points of the street segments; these
labelling functions must therefore be consistent with
each-other. A street network may have other labelling
functions, such as the street name to which the
segment belongs.
The familiar notions of (directed) path and circuit
from graph theory directly apply to street networks.
A street route is simply a path in G.
A flow pattern for a node n in V is pair
ϕ
= (
δ
,
π
),
where
δ
is a representation of the distribution of the
flow of vehicles that pass by n and
π
is a specification
ICEIS 2016 - 18th International Conference on Enterprise Information Systems
216

of the domain of
δ
(to facilitate comparing patterns).
Likewise, a travel time pattern for a path p of G is a
pair τ = (
γ
,
π
), where
γ
is a representation of the time
distribution of the travel time of vehicles that traverse
p and
π
is a specification of the domain of
γ
. Figure 2
at the end of the paper presents an example of travel
time patterns.
Given a street network G=(V,E,nl,el), a bus line
of G is a set l of paths in G; each path in l is called a
bus route of l. That is, a bus line may have several
alternative routes, which depend on the time of the
day, for example. A geo-referenced bus stop, or
simply a bus stop, of a bus route r is a point of a line
segment that labels an edge in r. Given a street
network G=(V,E,nl,el), a bus network of G is a pair
N=(L,S), where L is a set of bus lines of G and S is a
set of bus stops of the bus routes of the bus lines in L.
Finally, a monitored street network for a street
network G=(V,E,nl,el) and a bus network N=(L,S) of
G is a quadruple M=(W,F,wl,fl) such that:
• W ⊆ V
• If (m,n) is in F then there is a bus route of a bus
line in N that connects m and n
• wl is a function that labels each node n in W with
the bus routes that pass through n
• fl is a function that labels each edge f=(m,n) in
F
with the bus routes that that connects m and n
3.2 Trajectories
A trajectory is the representation of the position
evolution of a moving object. We can have different
representation levels: at the raw trajectory level, the
sequence of sample points is represented as collected
by the mobile device whereas, at the segmented
trajectory level, homogeneous parts of a raw
trajectory are identified based on some criterion.
More precisely, a geo-referenced spatio-temporal
point is a pair ((x,y),t), where (x,y) is a geo-referenced
point and t is a timestamp. A raw trajectory of a
moving object is a sequence of geo-referenced spatio-
temporal points, s=((p
1
,t
1
),(p
2
,t
2
),...,(p
n
,t
n
)), such that
t
i
is less than t
i+1
, for i=1,...,n-1. A segment c of a raw
trajectory s is a subsequence of s. Finally, a
segmented trajectory of a raw trajectory s is sequence
g=(g
1
,...,g
h
) of segments of s such that s is the
concatenation of g
1
,...,g
h
.
Since a bus is a moving object b, a raw bus
trajectory s of b is simply a raw trajectory generated
by b. Useful strategies to segment s would be based
on the bus stops of a route of the bus line, the nodes
of the monitored street network, or other control
points. The next section discusses this last
segmentation criterion in detail.
4 SOME KEY OPERATIONS OF
A TRAFFIC OBSERVATORY
This section briefly discusses the following
operations: segmentation of raw bus trajectories;
detection of travel time anomalies; estimation of
travel time delays; and finding explanations for travel
time anomalies. These operations are at the heart of
the traffic observatory prototype illustrated in Section
5. Other equally important operations, such as mining
traffic patterns, will not be covered due to space
limitations.
4.1 Segmentation of Raw Bus
Trajectories
The real-time control points segmentation problem is
defined as follows:
• Let R be a bus route and n
1
,….,n
k
be a list of
control points that succeed each other along R.
Given a raw trajectory s, generated by a bus b
which follows bus route R, segment s into
g=(g
1
,...,g
k-1
), in real-time, so that g
i
corresponds
to the segment of s that starts in a point q
i
closest
to n
i
and ends in a point q
i+1
closest to n
i+1
, for
i=1,…,k-1.
The control points may be arbitrarily chosen along
the bus route R, they may be the bus stops of R or they
may correspond to points pre-defined in a monitored
street network. However, we assume that n
i
immediately precedes n
i+1
in R, for i=1,…,k-1.
By segmenting s in real-time we mean that the
spatial-temporal points of s are processed as a data
stream, that is, at time t, the segmentation algorithm
has access only to the prefix of s up to t.
There are several practical problems to take into
account, such as:
(1) The bus route associated with s may be incorrect.
(2) GPS devices introduce errors.
(3) The sampling interval at which the GPS points are
acquired may be too long.
We assume that Problems (1) and (2) have been
solved by a pre-processing step so that the bus route
R is correct and all points in s fall over R.
Problem (3) deserves a separate discussion. If the
sampling interval at which the GPS points are
acquired is too long, or the bus is running too fast, no
point in the trajectory s may correspond exactly to any
of the control points. Given a control point n
i
, there
are at least three possible solutions: (1) select the last
point q
i
in s that occurs before n
i
along R; (2) select
the first point r
i
in s after n
i
; (3) use the timestamps of
q
i
and r
i
to generate a timestamp u
i
by interpolation
On the Design of a Traffic Observatory Application based on Bus Trajectories
217

and artificially add (n
i
, u
i
) to s. Any of these solutions
actually use route R to impose a linear order on the
trajectory points together with the control points.
In the rest of this section, we briefly discuss a real-
time control points segmentation strategy based on
the first option, for the sake of simplicity.
Let s = ((p
1
,
t
1
), (p
2
,
t
2
) ,..., (p
n
,
t
n
)) be a raw bus
trajectory generated by a bus that follows bus route R.
Assume that the points in s correctly fall over R.
Suppose that we have already processed the prefix
((p
1
,
t
1
), (p
2
,
t
2
) ,..., (p
i
,
t
i
)) of s and that (p
i
,
t
i
) is such
that p
i
is the last point in s before n
i
. We must discover
(p
j
,
t
j
) in s such that p
j
is the last (spatial) point before
n
i+1
along R. We will then have found the desired
segment g
i
, which is ((p
i
,
t
i
) ,..., (p
j
,
t
j
)).
To discover one such point, we associate with
(n
i
, n
i+1
) a variable C, which is initially Null, and
which will hold a pair (p
h
,
t
h
), where (p
h
,
t
h
) is the last
known point of s.
Let (p
k
,
t
k
) be a new spatial-temporal point of s,
that is, (p
k
,
t
k
) is added at the end of the current prefix
of s. There are two cases to consider:
1. p
k
lies before n
i+1
along R. Then, update C to
(p
k
,t
k
).
2. p
k
lies after n
i+1
along R. Then, (p
k
,
t
k
) is the first
point in s after n
i+1
and the current value of C is
used as the end-point of the segment that started
on (p
i
,
t
i
).
A few comments are worth at this point. As
already indicated, this segmentation strategy depends
on a pre-processing step so that the bus route R that is
correct and all points in s fall over R.
The real-time control points segmentation
strategy can be modified to simultaneously segment a
set of raw trajectories that traverse the same control
points (see examples in Section 5.3) simply by
replacing variable C by a hash table whose key is the
bus ID.
Also, the strategy can be used to (off-line)
segment a set of raw trajectories stored in a trajectory
dataset. Furthermore, with minor modifications, the
segmentation strategy can be transformed into a
strategy to monitor buses whose routes cover a given
set of control points.
4.2 Detecting Travel Time Anomalies
The real-time travel time anomaly detection problem
is defined as follows:
• Given a street route S and a time interval T, detect
in real-time if the travel time to traverse S during
T is deviating from the average travel time.
An example of a time interval T would be
“Monday, August 17
th
, from 6:00 AM to 10:00 AM”.
We also say that a time interval U, such as “Monday,
August 10
th
from 6:00 AM to 10:00 AM”, is
consistent with T.
We recall that both a street route S and a bus route
R are paths of the street network. We say that a bus
route R matches S iff S is a sub-path of R (this notion
is needed to select bus trajectories that cross S).
Let S be a street route and assume that S starts on
a node labelled with point n
i
and ends on a node
labelled with point n
i+1
. Let T be a time interval. Let
π be a set of trajectories that are being generated,
during the time interval T, by buses that follow routes
that match S.
A real-time traffic anomaly detection strategy,
similar to the segmentation strategy described in
Section 4.1, would go as follows:
1. Off-line, as a preparation step, obtain an
estimation for the average travel time to traverse
S, denoted ̅[S
, α , T , P], using the travel times
to traverse S observed in a set α of archived
trajectories, for time intervals consistent with T,
over a period of time P.
2. In real-time, given a trajectory s in π, suppose that
the prefix ((p
1
,
t
1
), (p
2
,
t
2
) ,..., (p
i
,
t
i
)) of s has
already been processed and that (p
i
,
t
i
) is such that
p
i
is the spatial point in s closest to n
i
. When a
point (p
k
,
t
k
) of s is received, if
t
k
- t
i
> ̅[S
, α , T , P], then the bus that is
generating s is running late to reach n
i+1
, that is, to
traverse S.
3. If more than one bus, but less than Y buses are
running late to traverse S, raise a yellow
semaphore where Y is a given constant.
4. If more than Y buses are running late, raise a red
semaphore.
The use of semaphores is justified since buses
might be delayed for a number of reasons and, hence,
one cannot signal that there is a travel time anomaly
to traverse S at T if just one bus is running late.
4.3 Estimating Travel Time Delays
The travel time delay estimation problem is defined
as follows:
• Given a street route S and two periods of time P
1
and P
2
, estimate the differences between the travel
times to traverse S at P
1
and at P
2
.
A quite simple travel time delay estimation
strategy would go as follows:
1. Select a set α
k
of trajectories from a set of
archived trajectories such that the trajectories
match S and cover P
k
, for k=1,2.
ICEIS 2016 - 18th International Conference on Enterprise Information Systems
218

2. Obtain an estimation for the distribution of travel
times to traverse S, denoted τ
k
[S
, α
k
, P
k
], using the
travel times to traverse S at P
k
observed in the
trajectories in α
k
, for k=1,2.
3. Compare τ
1
[S
, α
1
, P
1
] and τ
2
[S
, α
2
, P
2
].
Section 5.3 provides examples of travel time
delay estimations.
Finally, using travel time delay estimations, it
would also be possible to estimate the number of bus
passengers affected, or the total loss of time (incurred
by bus passengers), if bus passenger data were
available.
4.4 Finding Explanations for Travel
Time Anomalies
The explanation of travel time anomalies problem is
defined as follows:
• Given a street route S and a time interval T such
that a travel time anomaly has been detected, find
a traffic event that can explain the anomaly.
A strategy to address this problem involves
interpreting tweets that describe traffic-related events
and that are distributed by government agencies or by
news agencies (blind1). Briefly, the strategy would go
as follows:
1. Suppose that a travel time anomaly has been
detected for a given street route S and a time
interval T.
2. Use the labelling functions of the street network
to find the street names of the edges that compose
the street route S.
3. Search the appropriate Twitter channels to find
tweets that refer to traffic events that occurred in
such streets during T; the search requires
interpreting the tweets to identify street names and
other traffic event details (blind1).
4. If no such tweets are found, use the street network
to find the neighboring streets along street route S,
up to a certain distance, and repeat Step (3).
5. Output any tweet found.
Section 5.3 provide an example of a traffic event
that caused a considerable traffic time anomaly.
5 EXPERIMENTS
This section describes experiments with the traffic
observatory prototype developed to test the concepts
introduced in previous sections.
5.1 The Bus Network of the City of Rio
De Janeiro, Brazil
The public transportation system of the City of Rio de
Janeiro is largely based on buses. The statistics
published for the year 2014 are the following:
• Bus lines: 716
• Number of buses: 8,916
• Number of trips:18.5 million
• Number of passengers transported: 1,263 million
• Kilometers travelled: 760 million
• Number of companies: 44
• Number of employees: 41,375
• Average bus age: 4.06 years
• Average no. of passengers per kilometer: 1.39
• Average no. of kilometers travelled per bus per
month: 7,094
Yet more expressive is the fact that buses
accounted for nearly 60% of all passengers
transported over the past three years.
5.2 Data Collection and Visualization
The traffic observatory prototype offers a basic data
collection service that:
1. Captures the bus lines, bus routes and bus stops
from the traffic authority Web site.
2. Captures, at regular interval, the raw bus GPS
points from the traffic authority Web site.
3. Keeps in core the last 5 positions of each bus.
4. Stores in secondary storage all points captured,
organized by day.
From June 12
th
, 2014 until December 1
st
, 2015,
the service collected more than 2 billion records.
The traffic observatory prototype also offers
simple visualization services that allow users to
overlay bus trajectory data on top of a street map of
the city:
1. The last known position of each (operational) bus.
2. The last known position of each bus, up to a 10-
minute delay.
3. The last known position of each bus of a given bus
line, together with the actual bus route (forward
and return).
4. The last 5 positions of a specific bus, together with
the actual bus route (forward and return).
In all cases, the user may obtain the data
associated with a bus by passing the mouse over the
icon that represents the bus.
On the Design of a Traffic Observatory Application based on Bus Trajectories
219

5.3 An Example of Travel Time Delay
Estimation
To illustrate what one can expect from the traffic
observatory prototype, we estimate the travel time
delays caused by a traffic accident that occurred in the
metropolitan area of the City of Rio de Janeiro.
The accident was a fatal collision that caused the
death of a motorcyclist at the Zuzu Angel Tunnel,
which is part of an expressway that connects the south
and the west zones of Rio. As shown in Figure 1, the
accident occurred on Monday, August 17th, 2015 and
took place at, approximately, latitude -22.992342 and
longitude -43.249278 (near the Rocinha community
in the São Conrado area).
To evaluate the impact of this event in term of
travel time delays, the road segments analyzed were:
Zuzu Angel Tunnel, Jardim Botânico Street and
Bartolomeu Mitre Avenue, identified in Figure 1 in
blue, green and red, respectively. These segments
were chosen based on the (crucial) nodes, shown in
Figure 1, of the monitored street network of Rio de
Janeiro.
Figure 2 shows the travel time spent to traverse
the Zuzu Angel Tunnel on the day of the accident
versus the typical travel time pattern for the segment,
mined from the archived bus trajectories, for the same
day of the week (i.e., Mondays). As the graph in this
figure reveals, this event caused considerable travel
time delays for a crucial period of the day. The travel
time delays reached a peek of nearly 30 minutes at
8:00 AM and were observed for nearly four hours,
from 6:00 AM to 10:00 AM. Travel time delays were
also observed throughout the Jardim Botânico Street
up to the Rebouças Tunnel (indicated by top most dot
in Figure 1), located 10 km from the accident site.
To conclude, this example illustrates the ability of
the traffic observatory prototype to mine a trajectory
dataset to uncover typical and abnormal traffic
patterns for selected road segments and time periods
and to compare the patterns to assess travel time
delays (Figure 2 shows typical patterns in green, or
light grey, and abnormal patterns in red, or dark grey).
6 RELATED WORK
The segmentation of raw trajectories may use
different criteria, ranging from the transportation
means used (Biljecki et al., 2013; Biljecki, 2010),
potential-transition locations (e.g. bus stops) (Liao,
2006), geo-spatiotemporal information (Buchin et al.,
2015; Yoon et al., 2008), detection of similar sub-
trajectories (Sankararaman et al., 2013) and
movement analysis (Alewijnse et al., 2014; Buchin et
al., 2012). Section 4.1 specifically discussed how to
segment row trajectories based on the passing of
buses by control points.
Estimating traffic patterns from GPS data streams
is an important task to improve the efficiency of
traffic systems. According to (Zhang et al., 2013),
traffic applications using GPS data streams can be
divided into two main groups: centralized and
distributed. The first group uses traffic data from
multiple GPS devices simultaneously, while the
second group of applications uses individual GPS
data. Traffic state estimation (Geisler et al., 2012),
queue profile estimation (Ramezani and Geroliminis,
2015), detection of traffic anomalies (Kuang et al.,
2015) are examples of applications of the centralized
applications. Applications of the second group
include: vehicle performance analysis (Kargupta et
al., 2010), vehicle monitoring (Jose et al., 2015), and
vehicle anomaly detection (Chen et al., 2012). This
paper could be classified in the first group of
applications, as it analyses traffic based on multiple
GPS-enabled vehicles.
Kumar et al. (2005) presented a real-time
surveillance system with a rule-based behavior and
event-recognition module for traffic videos. Lu et al.
(2008) developed HOLMES, which is a system for
highway operation monitoring and evaluation.
Concerning bus transportation, several works
addressed the problem of determining the estimated
time of arrival (Bullock, Jiang and Stopher, 2005; Sun
et al., 2007). Kormaksson et al. (2014) presented a
specific study about the City of Rio de Janeiro.
7 CONCLUSIONS
We argued that buses, equipped with active GPS
devices that continuously transmit their position, can
be understood as mobile traffic sensors. Indeed, bus
trajectories provide a useful data source for analyzing
traffic, if the city is served by a dense bus network
and the city traffic authority makes the bus
trajectories available openly, timely and in a
continuous way.
We briefly listed the fundamental requirements
for traffic observatory applications. Then, we
discussed some key operations on bus trajectories.
Finally, we described experiments with a traffic
observatory prototype using bus trajectories made
available by the traffic authority of the City of Rio de
Janeiro. The results obtained corroborate the
usefulness of using bus trajectories to monitor traffic.
ICEIS 2016 - 18th International Conference on Enterprise Information Systems
220

As for future work, we are gradually increasing
the functionality of the traffic observatory prototype
to cover all requirements listed in Section 2.
ACKNOWLEDGEMENTS
This work was partly funded by CNPq under grants
153908/2015-7, 557128/2009-9, 444976/2014-0,
303332/2013-1, 442338/2014-7 and 248743/2013-9
and by FAPERJ under grants e E-26-170028/2008
and E-26/201.337/2014.
REFERENCES
Albuquerque, F.C., Casanova, M.A., Lopes, H., Redlich,
L.R., Macedo, J.A.F., Lemos, M., Carvalho, M.T.M.,
Renso, C. A methodology for traffic-related Twitter
messages interpretation. Computers in Industry. doi:
10.1016/j.compind.2015.10.005.
Alewijnse, S., Buchin, K., Buchin, M., Kolzsch, A.,
Kruckenberg, H. and Westenberg, M. 2014. A
framework for trajectory segmentation by stable
criteria. Proc. 22nd ACM SIGSPATIAL Int’l. Conf. on
Advances in Geographic Information Systems, 351–
360.
Biljecki, F., Ledoux, H. and Van Oosterom, P. 2013.
Transportation mode-based segmentation and
classification of movement trajectories. Int’l. J. of
Geographical Information Science, Vol. 27, No. 2,
385–407.
Biljecki, F. 2010. Automatic segmentation and
classification of movement trajectories for
transportation modes. TU Delft, Delft University of
Technology.
Buchin, M., Driemel, A., van Kreveld, M. and Sacristan, V.
2015. Segmenting trajectories: A framework and
algorithms using spatiotemporal criteria. J. Spatial
Information Science, No. 3, 33–63.
Buchin, M., Kruckenberg, H. and Kolzsch, A. 2012.
Segmenting trajectories based on movement states.
Proc. 15th Int’l. Symp. Spatial Data Handling (SDH),
15–25.
Bullock, P., Jiang, Q., Stopher, P. R. 2005. Using GPS
technology to measure on-time running of scheduled
bus services. Journal of Public Transportation, Vol. 8,
No. 1, p. 21–40.
Chen, C., Zhang, D., Castro, P. S., Li, N., Sun, L., and Li,
S. 2012. Real-time detection of anomalous taxi
trajectories from GPS traces. Mobile and Ubiquitous
Systems: Computing, Networking, and Services, 63–74.
Geisler, S., Quix, C., Schiffer, S., and Jarke, M. 2012. An
evaluation framework for traffic information systems
based on data streams. Transportation Research Part
C: Emerging Technologies, Vol. 23, 29–55.
Sunil, N., Ajinkya, V., Swapnil, C., and Vyankatesh, B.
2014. Dynamic bus timetable using GPS. Int’l. J. of
Advanced Research in Computer Engineering &
Technology, Vol. 3, No. 3.
Jose, D., Prasad, S., and Sridhar, V. 2015. Intelligent
vehicle monitoring using global positioning system and
cloud computing. Procedia Computer Science, Vol. 50,
440–446.
Kargupta, H., Sarkar, K., and Gilligan, M. 2010. Minefleet
R : An overview of a widely adopted distributed vehicle
performance data mining system. Proc. 16th ACM
SIGKDD Int’l. Conf. Knowledge Discovery and Data
Mining, 37–46.
Kormaksson, M. et al. 2014. Bus Travel Time Predictions
Using Additive Models. Proc. 2014 IEEE Int’l. Conf.
on Data Mining (ICDM), 875–880.
Kumar, P. et al. 2005. Framework for real-time behavior
interpretation from traffic video. IEEE Trans. On
Intelligent Transportation Systems, Vol. 6, No. 1, 43–
53.
Kuang, W., An, S., and Jiang, H. 2015. Detecting traffic
anomalies in urban areas using taxi GPS data.
Mathematical Problems in Engineering, 501:809582.
Liao, L., Patterson, D.J., Fox, D. and Kautz, H. 2006.
Building personal maps from GPS data. Annals of the
New York Academy of Sciences, Vol. 1093, No. 1, 249–
265.
Lu, C.-T. et al. 2008. Homes: highway operation
monitoring and evaluation system. Proc. 16th ACM
SIGSPATIAL Int’l. Conf. on Advances in Geographic
Information Systems., 85.
Ramezani, M. and Geroliminis, N. 2015. Queue profile
estimation in congested urban networks with probe
data. Computer-Aided Civil and Infrastructure
Engineering, Vol. 30, No. 6, 414–432.
Sankararaman, S., Agarwal, P. K., Molhave, T., Pan, J. and
Boedihardjo, A.P. 2013. Model-driven matching and
segmentation of trajectories, Proc. 21st ACM
SIGSPATIAL Int’l. Conf. on Advances in Geographic
Information Systems, 234–243.
Shi, W., Kong, Q.-J., and Liu, Y. 2008. A GPS/GIS
integrated system for urban traffic flow analysis. Proc.
11th Int’l. IEEE Conf. on Intelligent Transportation
Systems, 844–849.
Sun, D. et al. 2007. Predicting Bus Arrival Time on the
Basis of Global Positioning System Data.
Transportation Research Record, Vol. 2034, No. 1, 62–
72.
Yoon, H. and Shahabi, C. 2008. Robust time-referenced
segmentation of moving object trajectories. Proc. 8th
IEEE Int’l. Conf. on Data Mining, 1121–1126.
Zhang, J.-D., Xu, J., and Liao, S. S. 2013. Aggregating and
sampling methods for processing GPS data streams for
traffic state estimation. IEEE Trans. on Intelligent
Transportation Systems, Vol. 14, No. 4, 1629–1641.
Zhu, B. and Xu, X. 2015. Urban principal traffic flow
analysis based on taxi trajectories mining. Advances in
Swarm and Computational Intelligence, 172–181.
On the Design of a Traffic Observatory Application based on Bus Trajectories
221
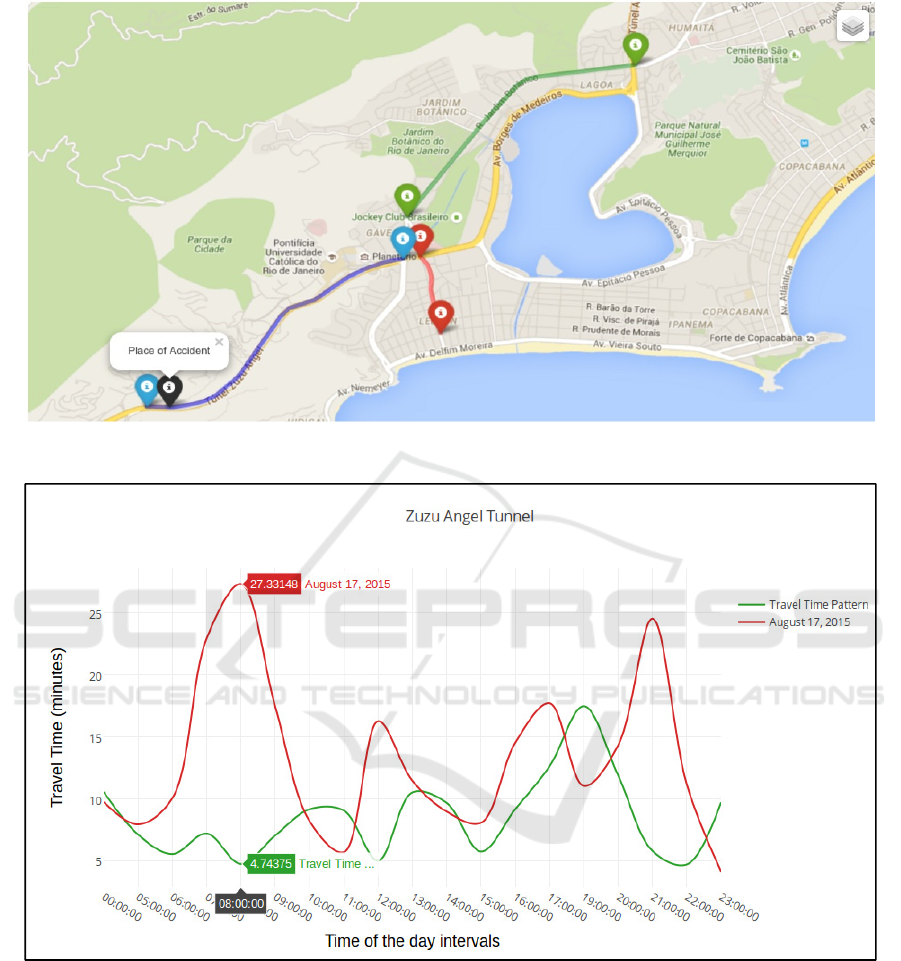
Figure 1: Place of the accident.
Figure 2: Travel Time Pattern vs Travel Time at the day of accident – Zuzu Angel Tunnel.
ICEIS 2016 - 18th International Conference on Enterprise Information Systems
222
