
Integrating User’s Emotional Behavior for Community Detection in
Social Networks
Andreas Kanavos, Isidoros Perikos, Ioannis Hatzilygeroudis and Athanasios Tsakalidis
Computer Engineering and Informatics Department, University of Patras, Patras, Hellas
Keywords:
Community Analysis, Graph Mining, Influential Community Detection, Sentiment Analysis, Tweet Emotion
Recognition, User Influence.
Abstract:
The analysis of social networks is a very challenging research area. A fundamental aspect concerns the de-
tection of user communities, i.e. the organization of vertices in clusters, with many edges joining vertices of
the same cluster and comparatively few edges joining vertices of different clusters. Detecting communities
is of great importance in sociology, biology as well as computer science where systems are often represented
as graphs. In this paper we present a novel methodology for community detection based on users’ emotional
behavior. The methodology analyzes user’s tweets in order to determine their emotional behavior in Ekman
emotional scale. We define two different metrics to count the influence of produced communities. Moreover,
the weighted version of a modularity community detection algorithm is utilized. Our results show that our
proposed methodology creates influential enough communities.
1 INTRODUCTION
The increasing popularity of social media, including
Twitter which we consider in the present manuscript,
has gained in recent years, huge research interest as
well as new opportunities for studying the interac-
tions of different groups of people. Two popular top-
ics in the investigation and better understanding of so-
cial networks are community detection and sentiment
analysis. Community detection on the one hand, tries
to analyze a social network with the aim of finding
groups of associated individuals in it, while sentiment
analysis attempts to determine user emotional behav-
ior and consequently specify their stance and opinion
on various topics, i.e. recognize how individuals feel.
Analyzing the way that users formulate social
communities, the determination of user behavior in
each one of the communities as well as in the whole
social network are fundamental aspects of social net-
work analysis. More specifically, studying the com-
munity structure of a network leads in explaining so-
cial dynamics of interaction among groups of indi-
viduals and several research works point to this direc-
tion (Deitrick et al., 2013). The accurate discovery
and analysis of communities is a topic of extremely
high research interest with wide range applications.
The economical and marketing implications of com-
munity detection approaches can also be considered
as of extreme importance. The main interest of the
discovery of structured communities and as a matter
of fact, the analysis of each one produced by the com-
munity detection approaches, could improve the ad-
vertising performance of marketing industry by iden-
tifying and targeting the proper group of users in a
specific network.
The structure of Twitter is formulated and comes
in terms of “follow” and “following” relationships be-
tween the users. Twitter platform gives user the abil-
ity to follow other users they want. In such a case,
each specific user can receive notifications regarding
the public posts of the users they follow in real time.
The indication of adding another user as a friend also
results in receiving post notifications but simultane-
ously indicates a closer relationship between these
two specific users (Java et al., 2007).
Emotions are essential to all aspects of human
lives and as a matter of fact, social networks can in-
fluence people’s decisions as well as their social rela-
tionships (Wang et al., 2012). Analyzing tweets and
in following recognizing their emotional content, is
a very interesting and challenging topic in the mi-
croblogging area (Choudhury et al., 2012). Hence, it
is necessary for deeper understanding people’s behav-
ior and for providing at the same time a number of in-
dicative factors regarding the public attitude towards
different events and topics. This emotional content
Kanavos, A., Perikos, I., Hatzilygeroudis, I. and Tsakalidis, A.
Integrating User’s Emotional Behavior for Community Detection in Social Networks.
In Proceedings of the 12th International Conference on Web Information Systems and Technologies (WEBIST 2016) - Volume 1, pages 355-362
ISBN: 978-989-758-186-1
Copyright
c
2016 by SCITEPRESS – Science and Technology Publications, Lda. All rights reserved
355

understanding can describe the emotional status of a
community, a group of people, a city or even a coun-
try (Quercia et al., 2012).
However, most of the existing methodologies for
determining structured communities in a network do
not take into account the aspects regarding users’ be-
havior. Users’ emotional behavior can be considered
as an important parameter that can assist in detecting
better (in terms of density) and more structured com-
munities.
As a matter of fact, in the present manuscript, a
novel methodology for analyzing Twitter social net-
work and in following determining communities in it,
is introduced. This specific methodology takes into
account each user’s emotional personality and their
activity in the whole network. The methodology ini-
tially analyzes users’ tweets with the aim of deter-
mining each user’s emotional behavior. The emo-
tional behavior of a user is then modeled and specified
on Ekman’s emotional scale (Ekman, 1999). Ekman
emotion model is a popular categorical model, which
assumes that there is a finite number of basic and dis-
crete emotions and specifies the following six human
emotions: anger, disgust, fear, happiness, sadness and
surprise. Futhermore, users’ tweets are further ana-
lyzed in order to calculate the influence metric of each
user in a specific network, as we introduce a number
of temporal and non temporal characteristics concern-
ing users’ behavior in this specific network. The aim
of the developed system is to provide a scalable and
distributed approach that allows accurate analysis of
the extracted network and its emerging user commu-
nities in real-time.
The rest of the paper is structured as follows. Sec-
tion 2 presents background topics in sentiment analy-
sis and community detection. Section 3 presents our
methodology followed and the system developed. In
Sections 4 and 5, details of the implementation of
the system as well as the evaluation study conducted
and the results gathered on both the sentiment anal-
ysis topic and the community detection topic are re-
spectively presented. Finally, Section 6 concludes our
work and presents directions for future research.
2 RELATED WORK
Community analysis in social networks has a long
history, which is related to graph clustering algo-
rithms, web searching algorithms, as well as biblio-
metrics. In general, a community is a group of net-
work nodes within which the links connecting nodes
are dense but between which they are space (Yang
et al., 2010). It corresponds to groups of nodes on
a graph or a network that share common properties or
have a common role in the organization and the oper-
ation of the system.
Over the last years, community detection in so-
cial networks has attracted a lot of interest and several
works examine the way users formulate communities
for developing algorithms with structured user com-
munities. A complete overview of approaches and
wide used techniques can be found in (Papadopoulos
et al., 2012), (Plantie and Crampes, 2013).
Concerning communities, the problem that is
known in bibliography, is related to graph partition-
ing. The algorithm proposed in (Girvan and New-
man, 2002) for identifying the edges lying between
communities and their successive removal can be con-
sidered as a breakthrough in this area; a procedure
that after some iterations, leads to the isolation of the
communities. One should also mention techniques
that use modularity, a metric that designates the den-
sity of links inside communities against the density of
links outside communities (Fortunato, 2010), (New-
man, 2004), with the most popular being the algo-
rithm proposed by (Blondel et al., 2008).
Recently, sentiment analysis methods and tech-
niques for recognition of emotions and opinions in
social networks has attracted a lot of interest. An
overview of approaches and methodologies can be
found in (Liu and Zhang, 2012). Several studies point
out the important role that they can play in the anal-
ysis of users’ state as well as in the recognition of
public stance towards specific topics. There are many
emerging works and applications so as to identify
whether a text is subjective or objective (Barbosa and
Feng, 2010) and also whether an opinion expressed is
positive or negative (Pak and Paroubek, 2010).
In (Xu et al., 2011), authors introduced two meth-
ods for identifying communities with similar senti-
ments with the aim of helping companies in market
segmentation and in the design of marketing strate-
gies. The first method assumes that sentiment can
be either positive or negative, whereas in the second
method, the range of sentiment is divided into inter-
vals and in following users are categorized into groups
according to the specific differences in the ranges of
sentiment values. In (Deitrick et al., 2013), once
community structures have been discovered, authors
use Naive Bayes sentiment classifiers trained with
the Sanders dataset towards improving the modular-
ity values.
Despite the increasing significance of social me-
dia analysis and the proliferation of methods for de-
tecting communities, most of the techniques rely on
node connectivity, assuming all nodes to be equal and
neglect special characteristics of the nodes. However,
SRIS 2016 - Special Session on Social Recommendation in Information Systems
356
we believe that in social networks, like Twitter, users’
characteristics such as their emotional behavior, are of
predominant importance and could provide vital and
meaningful information regarding the users/nodes of
the network. According to our knowledge, there has
been no previous effort to enhance community detec-
tion techniques with users’ emotional behavior; this is
the first work that tries to assist to with user emotional
behavior as defended on Ekman’s psychometric scale.
In this manuscript, the contributions of our work
rely on the following areas: Firstly, an approach for
the automatic analysis of tweets and in following the
determination of each user’s emotional behavior is
presented. Later, we introduce a method for investi-
gating the user’s actions in the social network and cal-
culate their influence based on their behavior. Finally,
we present an approach to identify the most influen-
tial communities based on user’s emotional behavior
as well as their analytics profile. Very similar, to the
current manuscript, works are the ones in (Kanavos
et al., 2014b) and (Kanavos and Perikos, 2015).
3 PROPOSED METHOD
In this section, we present the methodology followed
and the system developed to analyze and model con-
versations on specific topics in Twitter. The method-
ology initially analyzes tweets and determines their
place on Ekman emotional scale (Ekman, 1999).
Then, it estimates user’s influence in the network
(with the use of user profile) and detects the more in-
fluential communities in the corresponding network.
The produced influential communities can be seen
as the representation of the emotional interactions in
this network and are utilized based on the emotional
content and tweets as well as the user’s influence.
The overall architecture of the proposed system is de-
picted in Figure 1.
Figure 1: System Architecture.
3.1 User Emotional Profile Regarding
Tweets
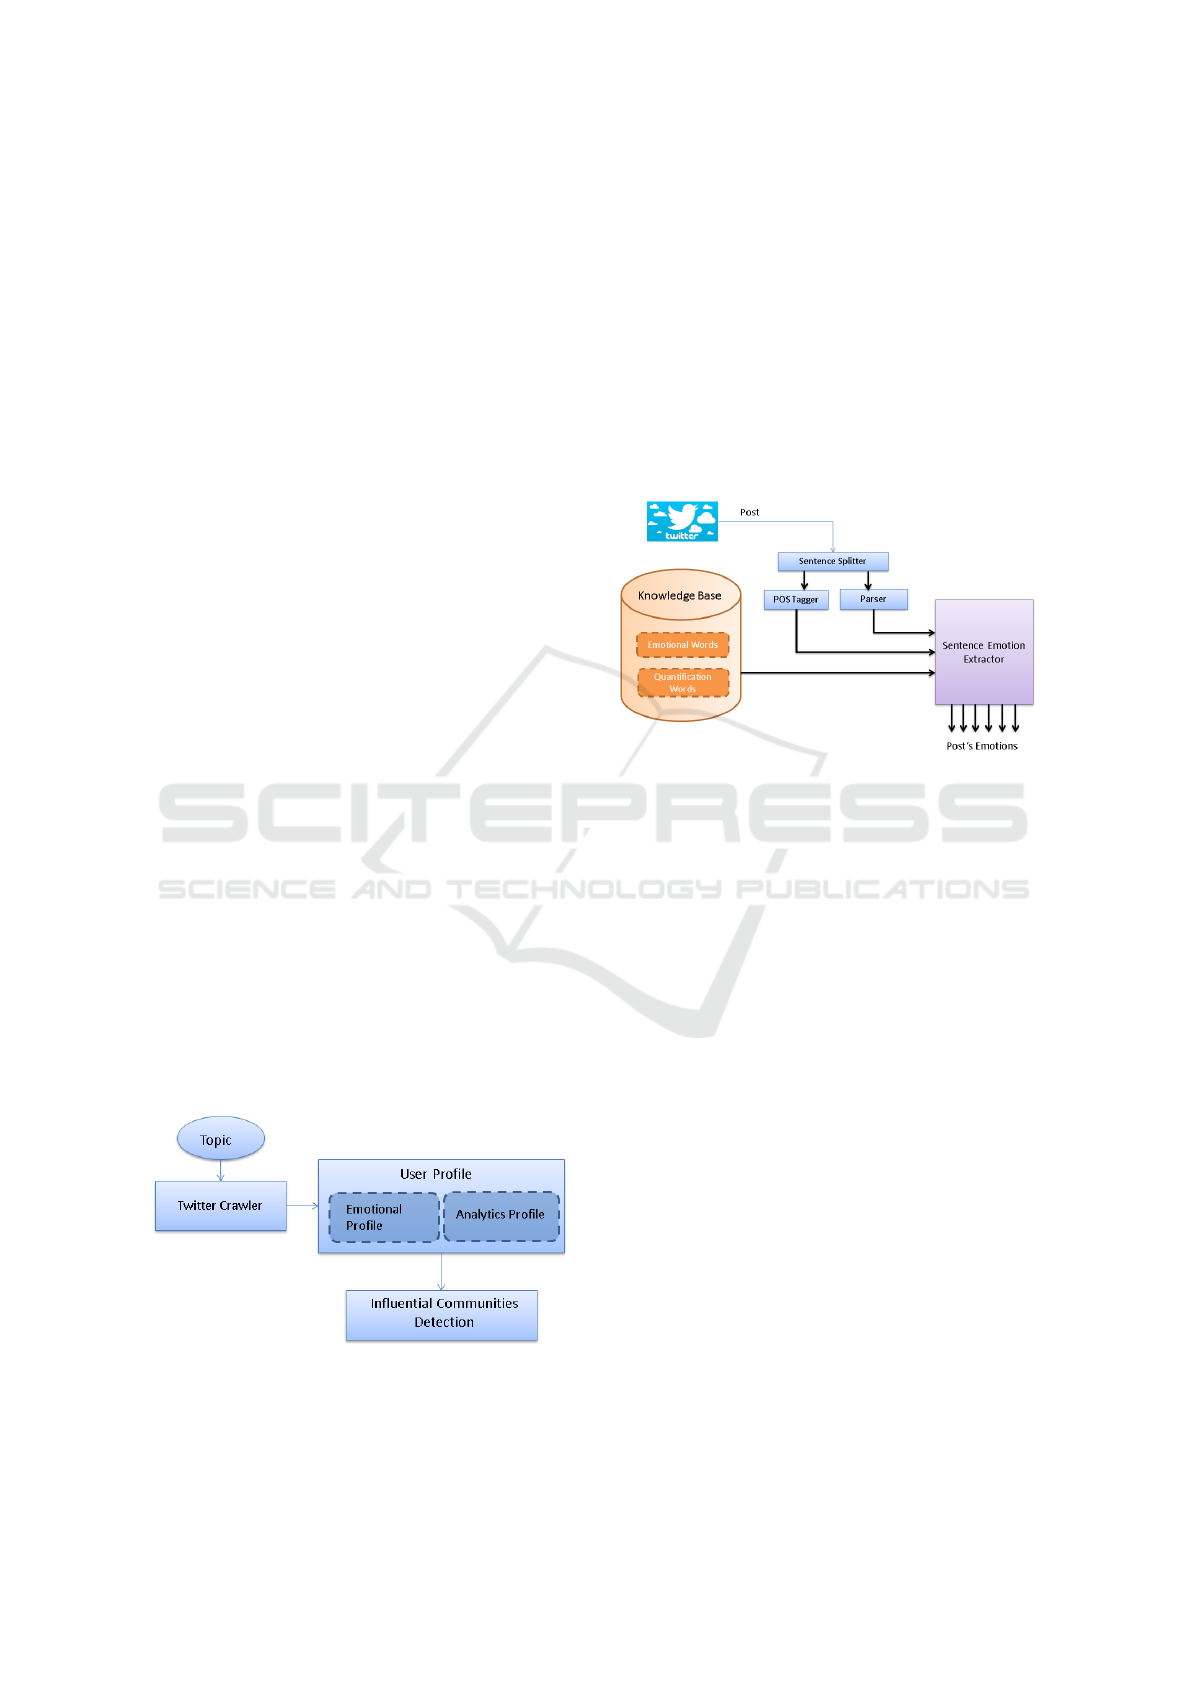
In this subsection, the emotional analysis of the tweets
based on the tool presented in (Perikos and Hatzi-
lygeroudis, 2013) is described. The analysis and the
emotional content of a tweet is conducted on the sen-
tence level as depicted in Figure 2. That is, a tweet
is split into sentences and thereafter each sentence is
handled separately by the tool. The tool recognizes
the existence of the six basic emotions proposed by
Ekman (Ekman, 1999) in natural language sentences.
Figure 2: Architecture of Emotion Recognition Tool.
Initially, on a sentence level, the structure of the
sentence is analyzed using Part-of-Speech (POS) tag-
ging and parsing processes. More specifically, the
first level of analysis concerns the morphosyntactic
analysis conducted by the tree tagger; this tagger is
used in order to specify each word’s grammatical role
in the sentence as well as to determine its base form
(lemma). Then, the Stanford Parser deeper analyzes
the structure of the sentence, specifies the relation-
ships between the words of the sentences and finally
creates the corresponding dependency tree. The de-
pendency tree represents the grammatical relations
between the words of the sentences in a tree based ap-
proach. Relationships are presented as triplets which
consist of the names of the relation, the governor
and the dependent respectively. When the sentence
morphosyntactic analysis is completed and the depen-
dency tree is created, special parts of the sentence as
well as specific words are deeper analyzed based on
the knowledge base of the tool.
Moreover, the knowledge base developed, uti-
lizes lexical resources and stores information regard-
ing emotional words that are known to convey spe-
cific emotional content. These emotional words are
spotted based on WordNet Affect source (Strappar-
ava and Valitutti, 2004), which we extended by man-
ually adding emotional words. For each emotional
word, information regarding its grammatical role as
Integrating User’s Emotional Behavior for Community Detection in Social Networks
357

well as the word’s emotional category are stored. Fur-
thermore, knowledge base handles quantification and
negation words and thus can modify the valence and
the strength of emotional words in a sentence when
interacting with them. Examples of such words are
all, none, very, quite, rather, etc. Then, all the emo-
tional words spotted in the sentence are further ana-
lyzed and the relations that denote the exact way they
interact with other words in the sentence are deter-
mined. Specific types of interactions with quantifica-
tion and negation words are also used so as to estimate
their emotional strength in the sentence. Finally, the
overall emotional status of a tweet is specified based
on the emotion content of each sentence’s emotional
parts. The output of the tool contains the emotions
that are detected to be conveyed in the user’s specific
tweet.
3.2 User Analytics Profile and Influence
Metric
In this subsection we describe the methodology (and
extend the ones from (Kafeza et al., 2014a), (Kanavos
et al., 2014b), (Kanavos et al., 2014a)) for estimating
the importance as well as the influence of a user in
a Twitter Network. Assuming that our methodology
could be utilized as a graph, then Twitter users would
be represented by nodes. As a matter of fact, the edges
which connect these nodes are the relations of “Fol-
lower to Following”, introduced by Twitter.
Initially, that influence metric should not depend
merely on the number of “Followers” for each spe-
cific user, even if that number is big enough and thus
corresponding user’s tweets are received by a large
number of other users (more specifically by their fol-
lowers). However, this ratio is also not sufficient. An-
other important measurement is the actual number of
posts (Tweets) that a user has addressed. For speci-
fying the importance of this factor, let us see the case
where two Twitter users have nearly the same FtF ra-
tio. Furthermore, as another important factor (with
similar features as the latter one) we have utilized the
Frequency of user’s Tweets, which depicts whether a
user enjoys talking on a regular basis and thus posting
more frequent than other users.
Furthermore, we take into consideration some fea-
tures that deal with interaction between users, i.e. the
number of Retweets and Replies as well as the Clicks,
Favorites and Mentions received. Precisely, concern-
ing the number of Retweets and Replies, they show
that a specific user enjoys to take part in conversations
either by republishing other users’s posts or comment-
ing on them. Moreover, Retweets can be very helpful
in identifying web trends and content that interests
other users or their followers or simply Tweets that
have the capacity to go viral. In addition, favoriting
is becoming an increasingly popular way to engage
on Twitter. In fact, with a single click, one can show
their appreciation or simply let the author know their
Tweet has been seen.
In our proposed approach, for calculating the
above rates, the latest k tweets of the user are pro-
cessed, according to the Twitter API (e.g. for our
experiments see the following section for values of
k). The proposed Influence Metric depends on all of
the aforementioned features/metrics of the examined
user, as defined in following Equation 2. Thus, the
Influence of a user, based on the above parameters is
calculated as follows:
PostImpact = ((Retweets + 1) ∗ (Replies + 1)∗
(Favorites + 1) ∗ (Mentions + 1) ∗ (Clicks + 1))/
DirectTweets (1)
where PostImpact deals with posts met-
rics/characteristics.
In f Metric = log(FtF +1)∗Freq.∗PostImpact
(2)
The above Influence Metric depends on all of the
aforementioned characteristics of each user. The FtF
ratio is placed inside a base-10 log for avoiding out-
lier values. In addition, the ratio is added by 1 so as
to avoid the metric being equal to 0 in cases that the
value of “Followers” is equal to “Following”. What is
more, we have added the ratio of Retweets, Replies,
Favorites, Mentions and Clicks Received divided by
the absolute number of Direct Tweets. The 5 proposed
ratios are also added by 1 so as to avoid the metric
being equal to 0 in cases that Retweets, Replies, Fa-
vorites, Mentions or Clicks Received, are 0.
3.3 Determining User’s Emotional
Behavior
The accurate assessment of the user’s emotional be-
havior poses two interlinked and mutually related
questions. The first concerns the quantity and conse-
quently the frequency of user’s tweets in order to ana-
lyze and determine the user’s emotional status. In ad-
dition, the second deals with the combination as well
as the specification of the user’s overall emotional sta-
tus based on each emotional content for every post (in
cases a post can be characterized as emotional).
Initially, in order to answer the first question, the
methodology introduced uses a time window of 3
weeks for this process. Specifically, the methodology
analyzes user’s tweets in the last 3 weeks in order to
SRIS 2016 - Special Session on Social Recommendation in Information Systems
358
determine their emotional status in that period. The
time window of the 3 weeks has been set based on
empirical estimations and evaluation results as well
as on the principle that user’s emotional status can
dynamically change during the passage of time. Set-
ting a too narrow time window, a decent and balanced
amount of the user’s post activity would fail to be pro-
vided. Moreover, a narrow time window could not
be emotionally stable and could rapidly alter in vari-
ous emotional directions. On the other hand, a wider
time window would fail to specify accurately and also
represent meaningfully the alternation of each user’s
emotional status.
User’s tweets in the last 3 weeks are specified and
in following retrieved by the crawler. Then, all the
tweets are analyzed and emotionally annotated by the
aforementioned process and the tool developed. Af-
ter user’s tweets are analyzed and emotionally anno-
tated, the user’s recent emotional status can be deter-
mined. For each tweet, we can measure and specify
whether it conveys each one of the 6 basic emotions
defined by Ekman emotional tool. In following, the
overall user’s emotional status is calculated based on
the emotional annotation of each one of their tweets
in the specific time window in a quantity approach.
That is, initially it is determined whether the user has
a vivid emotional status or whether their statuses are
emotionally neutral. More specifically, a user is char-
acterized to have emotional status/cue if at least 10%
of their posts are recognized as emotional and con-
vey one or more emotions; otherwise, their emotional
status is set to be neutral.
The threshold of the 10% is set based on experi-
ments employed on different Twitter datasets. In gen-
eral, emotions in Twitter posts can vary and show a
highly skewed distribution. In most cases, 10 − 15%
of the posts in the following mentioned datasets, were
recognized so as to convey emotions. Furthermore,
the analysis of the emotional tweets revealed that
emotions such as joy (happiness) can be present in
up to 50% of the emotional tweets while emotions
such as disgust and surprise can be present in less
than 10%. So, the threshold of 10% seems to be
a good choice, thus giving a balanced ratio regard-
ing emotional and neutral users’ annotations/statuses.
Specifically, emotions such as joy and anger are very
strong ones and are expressed more often by users and
almost always explicitly with the use of emotional
words. In contrast, emotions like surprise and dis-
gust may be expressed more rarely by users and what
is more, they can be implicitly expressed in a user’s
post.
3.4 Communities Decomposition
In our approach, we aim to identify the most influen-
tial communities in the produced users graph; where
each user profile can be considered as the union of the
two above characteristics, i.e. emotional and analyt-
ics profile. Though several algorithms with modular-
ity based community detection are considered, here
we utilize the one in (Blondel et al., 2008) by adding
an additional transformation as a pre-processing step.
Our influential community detection approach
combines the modularity optimization of network
community structure with the emotional state of each
user’s retrieved tweets in the graph. We introduce this
information by transforming the retrieved graph to its
dual graph, which is known as line graph. In follow-
ing, the weighted version of modularity community
detection algorithm of (Blondel et al., 2008) is uti-
lized so as to extract the influential communities in a
ranked list. Finally, we transform again the line graph
to its dual so as to understand the extracted communi-
ties based on the initial retrieved social graph.
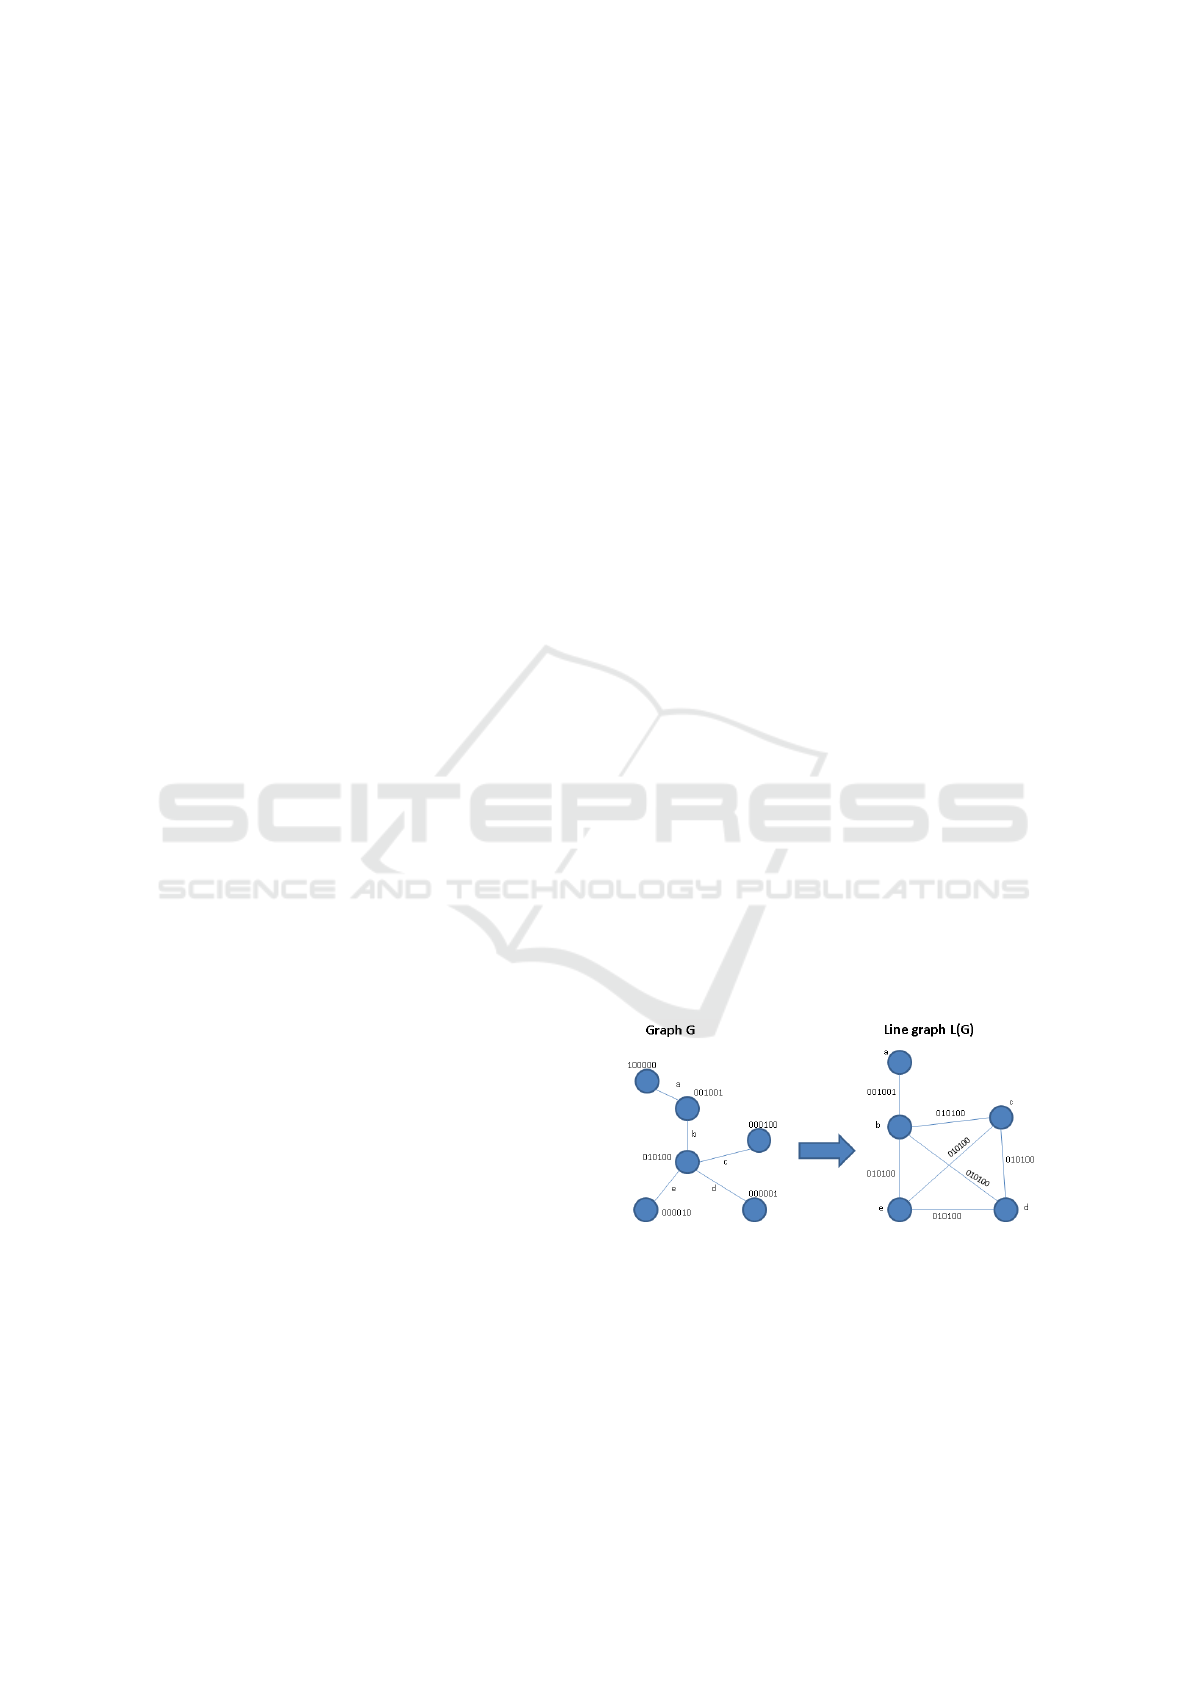
Concretely, the methodology is modulated in the
following steps:
1. Transformation to Line Graph, where line graph is
the dual of an initial graph; a dual is the inverted
nodes-edges graph. This transformation is pre-
sented in following Figure 3. Users (e.g. nodes)
are represented by the vector of their tweets emo-
tional scale based on Ekman model (with 1 an
emotion is present while with 0 is not present)
and the edges between them represent the “Fol-
lowing” relationship (they have different labels as
they connect different nodes and it is also neces-
sary for creating the line graph).
Figure 3: Transformation to Line Graph.
2. Utilization of weighted community detection al-
gorithm, that is a method described in (Blondel
et al., 2008) so as to identify communities within
the Twitter network and is based on modularity
optimization.
3. Transformation to initial dual node graph.
Integrating User’s Emotional Behavior for Community Detection in Social Networks
359
4 IMPLEMENTATION
The experimental procedure was based on the Twit-
ter API so as to gather data from Twitter which is
appropriate for our analysis and methodology. The
Twitter4J
1
constitutes of a Java API, used for col-
lecting tweets which are published in various peri-
ods of time for a variety of topics using correspond-
ing various keywords. Our Twitter data consists of
the following 5 topics (from 4 emotional categories),
where each topic consists of at least 15.000 posts
and the corresponding list of hashtags was compiled
accordingly. The topics studied are Malaysia Air-
lines Flight 370 disappearance, Spectre, Stock mar-
ket, Obamacare and SyrianRefugees.
In order to get an insight regarding users emo-
tional attitude, we calculate the number of Tweets that
express specific emotional dimensions versus the to-
tal number of Tweets. In Table 1 we observe that ap-
proximately 30% of the posts contain emotional in-
formation. Moreover, in Table 2, the topics studied as
well as their corresponding Ekman emotional scales
are presented.
Table 1: Distribution of Tweets.
Topic Emotional Neutral
Malaysia Airlines Flight
370 disappearance 67% 33%
Spectre 27% 73%
Stock market 35% 65%
Obamacare 31% 67%
SyrianRefugees 43% 57%
In the context of this study, the topics examined
were selected based on the principle to possess diver-
sity in their emotional content. The five topics are
quite rich in emotions and demonstrate a diversifica-
tion in their distribution. Concretely, the emotional
analysis of the tweets indicates that the happiness is
the predominating emotion in two out of the five top-
ics, the fear in one topic and the sadness in the remain-
ing two. Indeed, regarding Malaysia Airlines Flight
370 disappearance topic, sadness emotional content is
express in almost 65% of the emotional tweets, while
in happiness has approximately the half percentage in
Spectre and Obamacare topics.
Due to space considerations, the following evalua-
tion (including the corresponding figures) refers only
to the #Spectre graph. More specifically, the graph
utilized consists of 1000 nodes, where each user/node
has addressed a post in the above topic.
1
Twitter4J library: http://twitter4j.org/en/index.html
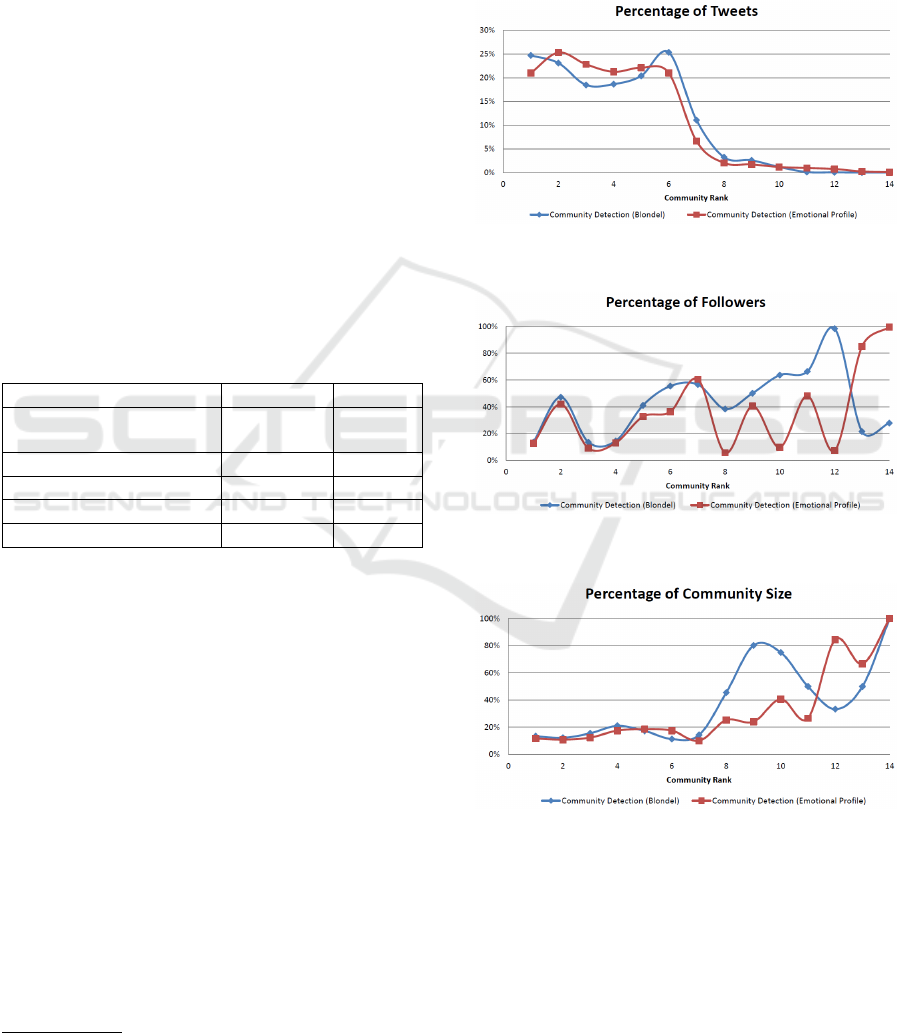
5 EVALUATION
In the following Figures 4, 5 and 6, we present the
performance of each of our algorithms in determin-
ing the influential communities. Namely, we rank the
influence of a community using different metrics for
different application scenarios (see previous work as
well (Kafeza et al., 2014b)).
Figure 4: Comparison of Influential Community Detection
Approaches based on the percentage of Tweets.
Figure 5: Comparison of Influential Community Detection
Approaches based on the percentage of Followers.
Figure 6: Comparison of Influential Community Detection
Approaches based on the percentage of Community Size.
The extracted communities in each case are
ranked based on the Influence Metric which has been
described above (see Equation 2). Since our moti-
vation stems from the fact that we are interested in
identifying the more influential communities and not
just the first one, our examination is focused on the
first 5 ranked communities. In the above Figures 4, 5
and 6, the 14 ranked communities are presented in
SRIS 2016 - Special Session on Social Recommendation in Information Systems
360

Table 2: Topics and corresponding percentages for Ekman emotional scales.
Topic Anger Disgust Fear Happiness Sadness Surprise
Malaysia Airlines Flight 370
disappearance 9% 2% 9% 5% 65% 10%
Spectre 3% 4% 6% 43% 32% 12%
Stock market 5% 9% 42% 22% 19% 3%
Obamacare 6% 8% 15% 49% 9% 13%
SyrianRefugees 23% 4% 19% 2% 47% 5%
which the percentage of Tweets, Followers and Size
for each Community is examined respectively.
More respectively, in Figure 4 we can observe that
influential communities (regarding a topic or a spe-
cific time period or an event) based on the emotional
factors produce more Tweets than influential com-
munities detected only from social network structure
(Blondel et al., 2008).
Figure 5 depicts that the proposed emotional ap-
proach slightly decreases the percentage of Follow-
ers in the top 5 communities as compared to (Blondel
et al., 2008). This occurs due to the Influential Met-
ric that is more generic and deals with an overall es-
timation of the impact of each user in the produced
community such as the number of Retweets, Replies,
Clicks received, Mentions etc.
As it is obvious in Figure 6, the top 5 communities
in our method requires fewer nodes that the simple
approach. This happens due to the inequality of the
weights distribution in the connected nodes which ef-
fects modularity optimization community detection as
well as to the density of links inside communities as
compared to links between communities. It is noted
that this factor can be useful when cost is associated
with the size of the communities and thus smaller
communities but with larger impact are required.
Table 3: Normalized Metric for Rating Influential Commu-
nities.
Influential Communities
Detection
Tweets
/ Size
Followers
/ Size
Simple Community
Detection 1,326 1,640
Emotional Community
Detection 1,587 1,549
The above results are totally consistent with the
Metric/Size metric as Table 3 shows. More specifi-
cally, the results indicate that the detection of com-
munities based on users’ emotional behavior results
in a higher average number of Tweets per Commu-
nity Size. The communities determined are denser
and the higher number of Tweets per Community de-
notes that the formulation of the communities is more
structured and achieved with a finer and more sophis-
ticated approach. In addition, these results support the
rational that users’ emotional behavior can be helpful
and provide meaningful data towards the detection of
influential communities in Social Networks.
On the other hand, as previously mentioned,
the average number of Followers per Community is
slightly lower when the emotional methodology is
followed. This is mainly a result of the way that In-
fluential Metric is defined as it deals with an overall
estimation of the impact of each user in the produced
community.
6 CONCLUSIONS AND FUTURE
WORK
In this paper, we propose a novel method on identi-
fying influential communities in a network with the
utilization of the users emotional behavior as well
as users influence in a specific timeframe. We ini-
tially present an approach for the automatic analy-
sis of users tweets, then analyze each user comment
and also estimate their emotional behavior. Thereafter
since all users are modelled as emotional or neutral
and are assigned with a specific influence metric, our
system finally identifies the most influential commu-
nities based on user’s emotional behavior and analyt-
ics profile. The method is based on the emotional con-
tent of each post as well as on an influence metric of
each user that interacts in a specific topic. With use of
the Ekman emotional model, we can identify whether
one or more out of the 6 basic human emotions exist
or not.
As future work, it is in our keen interest to in-
vestigate the scalability problems that emerge when
considering bigger graphs. Also, we aim to make
more experiments using several subjects and identify
the parameters that influence the results of our algo-
rithm in a finer granularity level. Another key as-
pect of our future work will be the extension of the
recognized emotions in our methodology and in fol-
lowing the use of different emotional models such as
the ones in (Ortony et al., 1988). Moreover, this ap-
proach can be introduced in a tool for viral marketing
Integrating User’s Emotional Behavior for Community Detection in Social Networks
361

or for branches’ advertising purposes. In conclusion,
we will examine the evolution of influential commu-
nities in time, i.e. temporal networks.
REFERENCES
Barbosa, L. and Feng, J. (2010). Robust sentiment detection
on twitter from biased and noisy data. In Proceed-
ings of the 23rd International Conference on Compu-
tational Linguistics: Posters (COLING), pages 36–44.
Blondel, V. D., Guillaume, J., Lambiotte, R., and Lefebvre,
E. (2008). Fast unfolding of community hierarchies
in large networks. Journal of Statistical Mechanics:
Theory and Experiment, P10008.
Choudhury, M. D., Gamon, M., and Counts, S. (2012).
Happy, nervous or surprised? classification of human
affective states in social media. In Proceedings of the
6th International AAAI Conference on Weblogs and
Social Media (ICWSM).
Deitrick, W., Valyou, B., Jones, W., Timian, J., and Hu, W.
(2013). Enhancing sentiment analysis on twitter using
community detection. Communications and Network,
5(3):192–197.
Ekman, P. (1999). Basic Emotions. John Wiley & Sons Ltd,
New York.
Ferrara, E. (2012). A large-scale community structure anal-
ysis in facebook. EPJ Data Science, 1(9).
Fortunato, S. (2010). Community detection in graphs.
Physics Reports, 486(3–5):75–174.
Girvan, M. and Newman, M. E. J. (2002). Com-
munity structure in social and biological networks.
Proceedings of the National Academy of Sciences,
99(12):7821–7826.
Gurini, D. F., Gasparetti, F., Micarelli, A., and Sansonetti,
G. (2014). iscur: Interest and sentiment-based com-
munity detection for user recommendation on twitter.
In 22nd International Conference on User Modeling,
Adaptation, and Personalization (UMAP), pages 314–
319.
Java, A., Song, X., Finin, T., and Tseng, B. (2007). Why
we twitter: Understanding microblogging usage and
communities. In Proceedings of the 9th WebKDD and
1st SNA-KDD 2007 Workshop on Web Mining and
Social Network Analysis, WebKDD/SNA-KDD ’07,
pages 56–65.
Kafeza, E., Kanavos, A., Makris, C., and Chiu, D. (2014a).
Identifying personality-based communities in social
networks. In Advances in Conceptual Modeling,
pages 7–13.
Kafeza, E., Kanavos, A., Makris, C., and Vikatos, P.
(2014b). T-pice: Twitter personality based influen-
tial communities extraction system. In Proceedings of
the 2014 IEEE International Congress on Big Data,
pages 212–219.
Kanavos, A. and Perikos, I. (2015). Towards detecting emo-
tional communities in twitter. In 9th IEEE Interna-
tional Conference on Research Challenges in Infor-
mation Science RCIS, pages 524–525.
Kanavos, A., Perikos, I., Vikatos, P., Hatzilygeroudis, I.,
Makris, C., and Tsakalidis, A. (2014a). Conversation
emotional modeling in social networks. In 24th IEEE
International Conference on Tools with Artificial In-
telligence (ICTAI), pages 478–484.
Kanavos, A., Perikos, I., Vikatos, P., Hatzilygeroudis, I.,
Makris, C., and Tsakalidis, A. (2014b). Modeling
retweet diffusion using emotional content. In Artifi-
cial Intelligence Applications and Innovations AIAI,
pages 101–110.
Liu, B. and Zhang, L. (2012). A survey of opinion mining
and sentiment analysis. In Mining Text Data, pages
415–463.
Newman, M. E. J. (2004). Fast algorithm for detecting
community structure in networks. Physical Review E,
69(6):066133+.
Ortony, A., Clore, G. L., and Collins, A. (1988). The Cog-
nitive Structure of Emotions. Cambridge University
Press.
Pak, A. and Paroubek, P. (2010). Twitter as a corpus for sen-
timent analysis and opinion mining. In Proceedings of
the International Conference on Language Resources
and Evaluation (LREC).
Papadopoulos, S., Kompatsiaris, Y., Vakali, A., and Spyri-
donos, P. (2012). Community detection in social
media. Data Mining and Knowledge Discovery,
24(3):515–554.
Perikos, I. and Hatzilygeroudis, I. (2013). Recognizing
emotion presence in natural language sentences. In
14th International Conference on Engineering Appli-
cations of Neural Networks (EANN), pages 30–39.
Plantie, M. and Crampes, M. (2013). Survey on social com-
munity detection. In Social Media Retrieval, Com-
puter Communications and Networks, pages 65–85.
Springer.
Quercia, D., Ellis, J., Capra, L., and Crowcroft, J. (2012).
Tracking ”gross community happiness” from tweets.
In Proceedings of the ACM 2012 Conference on Com-
puter Supported Cooperative Work, CSCW ’12, pages
965–968.
Strapparava, C. and Valitutti, A. (2004). Wordnet-affect:
an affective extension of wordnet. In Proceedings of
International Conference on Language Resources and
Evaluation (LREC), volume 4, pages 1083–1086.
Wang, W., Chen, L., Thirunarayan, K., and Sheth, A. P.
(2012). Harnessing twitter ”big data” for automatic
emotion identification. In Conference on Privacy, Se-
curity, Risk and Trust (PASSAT) and Confernece on
Social Computing (SocialCom), pages 587–592.
Xu, K., Li, J., and Liao, S. S. (2011). Sentiment community
detection in social networks. In Proceedings of the
iConference, iConference ’11, pages 804–805.
Yang, B., Liu, D., and Liu, J. (2010). Discovering commu-
nities from social networks: Methodologies and appli-
cations. In Handbook of Social Network Technologies
and Applications, pages 331–346.
SRIS 2016 - Special Session on Social Recommendation in Information Systems
362
