
Streamlining Assessment using a Knowledge Metric
Nils Ulltveit-Moe, Sigurd Assev, Terje Gjøsæter and Halvard Øysæd
Institute of Information and Communication Technology,
University of Agder, Jon Lilletuns vei 9, 4879, Grimstad, Norway
Keywords:
Entropy, Cross Assignment Marking, Learning Management Systems, Efficient Teaching Methods.
Abstract:
This paper proposes an efficient tool-supported methodology for marking student assignment answers accord-
ing to a knowledge metric. This metric gives a coarse hint of student answer quality based on Shannon entropy.
The methodology supports marking student assignments across each sub-assignment answer, and the metric
sorts the answers, so that the most comprehensive textual answers typically get the highest ranking, and can be
marked first. This ensures that the teacher quickly gets an overview over the range of answers, which allows
for determining a consistent marking scale in order to reduce the risk of scale sliding or hitting the wrong
scale level during marking. This approach is significantly faster and more consistent than using the traditional
approach, marking each assignment individually.
1 INTRODUCTION
One of the more laborious tasks for a teacher is to
mark and grade assignments and exams. We view this
as a task that fundamentally does not scale, and with
large courses with hundreds of students a simple exer-
cise report can produce thousands of pages that have
to be read and evaluated. Often the reading of hun-
dreds of similar, but not equal answers can feel quite
frustrating, and this can furthermore lead to impaired
judgement. We, and many with us, have experienced
this, however there does not appear to be any readily
available solutions for mitigating this problem. There
has been extensive research into how the evaluation
process can be used to benefit the students, as well as
some early research on automated grading, however
there is less research on how to do the grading pro-
cess more efficiently.
Most teachers or professors would probably agree
that their evaluation of student assignments is not per-
fect. Teachers are only humans, and can have good
days and bad days. The marking precision and per-
formance can change accordingly. Several different
biases can therefore occur when marking many as-
signments, for example:
• The teacher acquires new insight in the topic dur-
ing the marking.
• Marking slips, or is skewed over time;
• The teacher loses attention while assessing the as-
signments;
• The teacher mixes in own knowledge when inter-
preting vague or overly brief answers;
All these factors may lead to this undesired result:
The teacher fails to give a correct assessment of the
answer, and thus may give it an incorrect grade.
Our vision is to simplify the marking process by
providing the teacher with a technique and methodol-
ogy for marking assignments more efficiently. The
method provides a tentative ranking of student an-
swers to sub-assignments based on their amount
and diversity of information using an information-
theoretic metric based on Shannon entropy.
2 SIMPLIFYING THE
EVALUATION PROCESS
In order to simplify the evaluation process we have
made some assumptions about the planning of the
exam/assignments as well as how the whole evalua-
tion process could be carried out.
2.1 Planning and Developing
Assignments
We think it is important to develop the assignments
so that they are not too open-ended or complex, since
this can make the marking unnecessarily complex,
and it can also make it difficult to compare the perfor-
190
Ulltveit-Moe, N., Assev, S., Gjøsæter, T. and Øysæd, H.
Streamlining Assessment using a Knowledge Metric.
In Proceedings of the 8th International Conference on Computer Supported Education (CSEDU 2016) - Volume 1, pages 190-197
ISBN: 978-989-758-179-3
Copyright
c
2016 by SCITEPRESS – Science and Technology Publications, Lda. All rights reserved

mance of the students. If a sub-assignment appears to
be too complex, then it should be split it into smaller,
more manageable sub-assignments. This also reduces
the number of combinations of fault modes that you
need to give feedback about, which facilitates a more
targeted student feedback.
2.2 Clear Acceptance Criteria
To make the job as a teacher more efficient, we pos-
tulate a need to set some clear acceptance criteria on
what an acceptable answer consists of. Without these
criteria, one could end up with answers that are more
difficult and labour intensive to mark than strictly nec-
essary. A necessary criterion for tool-supported mark-
ing methods, is that the answer follows a clearly de-
fined format that can be parsed by the teaching sup-
port tools. This means that the following mandatory
acceptance criteria must be followed:
• The student is clearly identified on the assign-
ment.
• Verification that the answer follows the required
report template.
A standardised exercise template is therefore a neces-
sary requirement for more efficient assignment mark-
ing. The teacher could add other optional acceptance
criteria as well, for example:
• Proper citations are being used, and quoted ref-
erences are reasonable. A plagiarism checking
tool (e.g. Sherlock or Ephorus) can be used to
detect suspicious cases. Serious plagiarism in-
stances can then be investigated and rejected from
the marking. This avoids wasting time on marking
plagiarised works several times.
• Set a maximum page or word limit for the assign-
ment, so that the student risks that the assignment
is not being marked beyond the maximum page
limit. Such a maximum page limit is common
both in research when writing scientific papers or
project applications, as well as when writing arti-
cles for newspapers. Many universities have such
limits as well. A page limit forces the students to
think and prioritise the most important informa-
tion. This also means that the students cannot eas-
ily choose an easy way out like cooking existing
web resources, such as for example Wikipedia.
Those who write too voluminously will then need to
learn to condense the answer, something that should
increase the learning outcome. It would also prepare
the student for the exam, when strict time limits can
make voluminous writing a bad strategy. Such cri-
teria may increase the quality of the answers, and at
the same time make the job of evaluating them less
arduous.
2.3 Marking Principles
In principle, the teacher should only need to mark the
same answer once. Similar answers should ideally be
compared, and only significant differences should be
checked, instead of the teacher having to mark hun-
dreds of minor variants over the same theme. The as-
signment marking strategy should be able to identify
the correct knowledge level of the students, to avoid
too loose or strict judgement. The marking strategy
should also be able to separate out the areas teachers
think are easy doing first - marking the clear answers
(very good or very bad). This means that the more
fuzzy category or categories in the middle more eas-
ily may be done once the experience from the good
and bad answers have been acquired.
We think that one good strategy for the teacher
or assessor is to mark one part assignment/sub-
assignment at a time, in order to avoid mental con-
text switch between different assignments. This en-
sures that the teacher more easily can keep different
answer alternatives in mind and avoid having to write
down and search for suitable comment alternatives to
the answers. This makes it easier to remember the
different types of answers to the sub-assignment on
different levels.
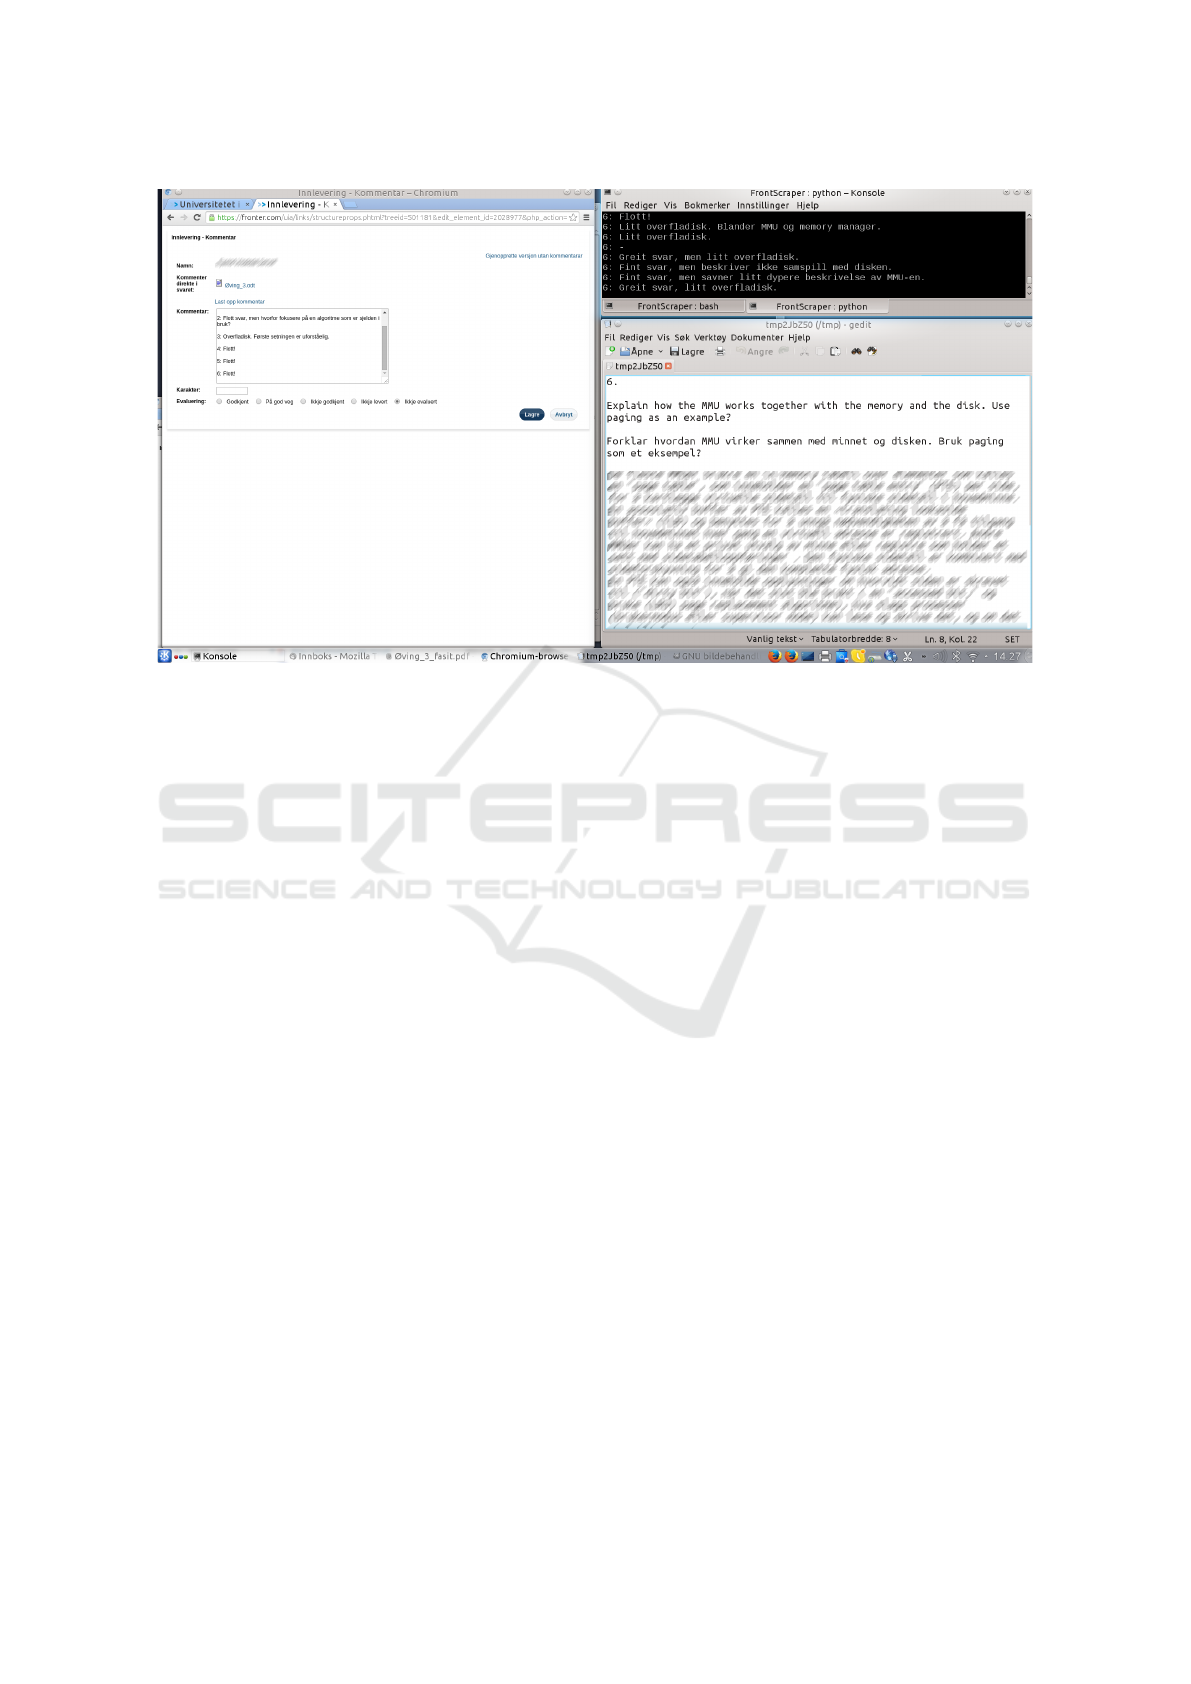
2.4 Use of our FrontScraper Tool
Figure 1 shows the FrontScraper tool in use. The
FrontScraper console, which is used to manage the
marking process, is shown in the upper right part of
the picture. The console shows the list of comments
that have been given to previous students for the given
assignment. Console commands can be used to navi-
gate to the next student, previous student, a given stu-
dent etc. The learning management system (LMS)
ClassFronter is shown to the left of the picture. It
shows the feedback comments, evaluation and grade
of the student being marked. The student answer be-
ing marked (anonymised) is shown in the lower right
part of the picture. FrontScraper currently only sup-
ports displaying the answer as text, as a least common
denominator between different document formats. It
is envisaged that this can be improved in the future by
enforcing use of a standardised XML document tem-
plate allowing an easy way to extract the answer from
each sub-assignment.
The tool supports the marking process by down-
loading, parsing and splitting the student assign-
ments into sub-assignments. It furthermore sorts the
Streamlining Assessment using a Knowledge Metric
191
LMS (ClassFronter) FrontScraper
console
Answer
Figure 1: FrontScraper tool used to mark student assignment.
students according to an information entropy based
"knowledge" metric, which ensures that the most
comprehensive, and usually the best solutions, will
be marked first. These are usually more motivating to
mark for the teacher since it is rewarding to see how
much the students have learnt, and the teacher might
learn something from good answers as well. In addi-
tion, the marking speed typically increases as less and
less comprehensive answers are marked. The tool fur-
thermore maintains a list of comment alternatives to
different answers, sorted by usage frequency, which
allows reusing earlier comments in order to give more
consistent feedback to the students. Avoiding having
to type in the same comment several times is another
factor that increases productivity.
Another advantage with this approach, is that sim-
ilar answers will tend to be grouped together, which
may increase the efficiency even further, since the
same comment then in many cases can be used for
consecutive answers. The reason for this is that the
entropy metric has the desirable property that a small
document change will result in a small change in en-
tropy (Shannon, 1948). This allows similar answers
to be marked together, which improves the marking
speed. The reason for this is that the teacher’s com-
ments and marking often can be reused for these clus-
ters of failure modes. Another advantage with this
method is very low computational complexity.
Other advantages with this approach, is that it al-
lows the teacher to get through one or more sub-
assignments in one day, which reduces the risk of
judgements sliding over time. The tool maintains a
list of distinct answers per assignment, which makes
it easy to copy and paste previous answers where this
is applicable.
The teacher should then keep a note of different
comments covering common failure modes for the
students, and either share tailored comments, or share
all failure mode comments with all students. This al-
lows the students to learn about common pitfalls. The
tool should also store this information, since such fail-
ure modes will tend to repeat year after year. Stor-
ing this information will make the teacher’s marking
more consistent over time. In the future it would even
be an advantage to share information about common
student failure modes, and how to avoid these be-
tween teachers, in order to perform more efficient and
focused teaching.
3 MEASURING KNOWLEDGE
This section describes how knowledge can be mea-
sured. It gives an introduction to the information-
theoretic model of knowledge as motivation for the
entropy-based knowledge metric. This is then used
as a measure of the amount of information in student
answers.
What is knowledge? According to Dretske’s in-
formation theoretic epistemology, mental facts can be
defined as follows (Dretske, 1981; Dretske, 1997):
(1) All mental facts are representational facts, and
(2) All representational facts are facts about infor-
CSEDU 2016 - 8th International Conference on Computer Supported Education
192

mational functions .
With this definition of information in hand,
Dretske gives the following definition of knowledge:
K knows that s is F = K’s belief that s is F is
caused (or causally sustained) by the information that
s is F.
During an exam, assignment or test, a student
reproduces her knowledge, which essentially means
writing down information stating his or her belief of
the causal relationships of gained information during
the course. When the teacher has marked the assign-
ment and the student reads the results, then her beliefs
become knowledge.
Thus, according to Dretske, exams or assignments
consist of information. By using information metrics,
in this case information entropy, we get a measurable
function representing a student’s knowledge. Note
that the teacher still is needed as an evaluator, since
an information metric is not able to express whether
the student’s beliefs are relevant or correct, and only
relevant alternatives should be considered according
to Dretske (Dretske, 2000).
It can furthermore be observed that these informa-
tional functions exist as representational facts. These
representational facts are manifested by sentences of
words in the student’s answer. We do not aim at mea-
suring the exact meaning of the students answer, but a
good approximation of the complexity of the answer
is word entropy, considering only the words that con-
tribute to the factual information. The words that do
not contribute significantly to factual information for
a language L are called stop-words, denoted by S
L
.
There are standardised stop-word lists for different
languages, for example the words “a, about, above,
after,...” in English
1
.
The representational facts, here denoted by X, can
then be expressed more formally as the relative com-
plement (or set difference) W \S
L
between all words
W in the answer A, W ⊂ A, and the set of stop-words
S
L
that are assumed to not contribute to the represen-
tational facts for the domain knowledge in a given nat-
ural language L. As long as the stop-words do not
overlap significantly within the given factual knowl-
edge domain, then the stop-words can be merged for
a set of natural languages {L1, L2, ..., LN}, so that
X = A\(S
L1
∪S
L2
... ∪S
LN
). Norway needs to consider
the stop-words of three languages: S
Bokm ˚al
, S
Nynorsk
and S
English
. The proposed information metric for
measuring student answer knowledge can therefore be
expressed as the word (or concept) Shannon entropy
H(X) for a set of words (or concepts) χ:
1
Stop-word lists: https://code.google.com/archive/p/
stop-words/
LMS
Web-
scraper
Assignment
DB/cache
Doc
template
Assignment
parser
Student
Ranking
algorithm
Assessment
interface
Teacher
Figure 2: FrontScraper system architecture.
H(X) =
∑
x∈X
P[X = x]log
1
P[X = x]
(1)
Another advantage with an information theoretic
metric for coarse-sifting through answers, is that it is
largely agnostic to the underlying written language.
For Norwegian universities this is important, since
answers can be in either of the two Norwegian lan-
guages (Bokmål or Nynorsk) or English. In Northern
Norway, Sami may additionally be used.
4 FRONTSCRAPER
ARCHITECTURE
The system architecture of FrontScraper is shown in
Figure 2. FrontScraper is implemented in Python and
uses the Selenium WebDriver
2
as a web-scraper for
interfacing towards the web interface of the Learn-
ing Management System (LMS) ClassFronter. This
allows for tight integration with the LMS, and at the
same time allows FrontScraper to manage the mark-
ing and navigation between students using the assess-
ment interface.
The assessment interface is used for identifying
and downloading the student assignment, as well as
navigating between student assignments. The cur-
rent set of sub-assignments being marked are ranked
according to the Shannon entropy based ranking al-
gorithm. The ranking algorithm disregards stop-
words in the languages being considered (Norwegian,
Nynorsk and English) and creates a unique index
per word. The algorithm then calculates the entropy
of the word index and ranks the assignments from
high to low entropy, so that the teacher starts with
marking the typically most comprehensive answers
first. Caching of student assignments is supported
in the assignment database/cache in order to reduce
2
Selenium WebDriver: http://seleniumhq.org
Streamlining Assessment using a Knowledge Metric
193

the LMS load when performing marking across sub-
assignments. The assignment parser is used to parse
the student assignment according to a supported doc-
ument template used for student assignments. It is
mandatory for the students to use a supported doc-
ument template so that FrontScraper is able to re-
liably detect the sub-assignments of the student an-
swers when marking. FrontScraper supports a sanity
check (checkAssignments.py) which can be used to
verify that the student answers are being split into the
expected number of sub-assignments.
4.1 Marking Algorithm
The marking algorithm works from a high-level per-
spective as follows: First, the web-scraper is ini-
tialised, which starts up the browser connected to the
LMS. The teacher can then log in to the LMS and go
to the hand-in folder to be marked in a new browser
tab. FrontScraper then reads information about all
M students
{
s
1
, s
2
, . . . , s
M
}
in the hand-in folder, and
then reads the submitted answers A =
{
a
1
, a
2
, ..., a
M
}
from the students. The tool initially tries to read
the cached answer in the assignment database/cache,
and if the document is not cached, then it is read
directly from the LMS. This reduces the load of
running FrontScraper on the LMS. The tool then
splits each the assignment into N sub-assignments
{a
1,1
, a
1,2
, ..., a
M,N
} and caches the results in the as-
signment database/cache.
Then each word of the the current sub-answer a
i, j
is converted into a unique integer word code w
i, j
=
wordCode(a
i, j
) for each word in the answer that is
not in the set of stop-words, which are ignored. The
first word is assigned word code 1, the second dis-
tinct word word code 2, and so on... For example,
the text “A computer file system stores information in
a computer.” has the non-stop words “computer file
system stores information computer”. The word code
for this text string would be w
i, j
= {1, 2, 3, 4, 5, 1}.
This is implemented using a dictionary which stores
the next word code for any words not in the dictio-
nary. This means that each word code representing
a word essentially is one symbol in the entropy cal-
culations. After that the ranking algorithm is then
calculated on the list of word codes representing the
current sub-assignment a
i, j
being marked, i.e. r
i, j
=
rank(w
i, j
). For Shannon entropy, the ranking func-
tion would for example be r
i, j
= H(w
i, j
). The list of
assignments being marked is then sorted according to
the rank r
i
of the given sub-assignment i algorithm
being marked, so that the teacher starts with marking
the typically most comprehensive answers and ends
with the typically least comprehensive answers of the
F E D C B A
Grade
4
5
6
7
8
9
10
Information H
(
X
)
Information content vs. grade for assignment 2
Figure 3: Measured entropy vs. assigned grade for plain
Shannon word entropy H(X).
sub-assignment.
The tool then iterates through the sorted assign-
ments and lets the teacher mark the candidate. The
teacher can choose from the palette of previous an-
swers for the given sub-assignment, in order to speed
up the feedback to the students. The algorithm in ad-
dition supports commands for navigating to the pre-
vious, next, first and last candidate as well as candi-
date i. Finally, when all sub-assignments have been
marked, then the teacher can set the final grade for
each student based on the comments and results for
all sub-assignments.
5 EXPERIMENTS
The experiment is based on a mandatory student ex-
ercises from the DAT 103 Operating System course
in autumn 2014 at our University. There were 98 stu-
dents participating in the course. The results from ex-
ercise 2 is shown in figures 3 and 4. The exercise was
graded without aid of FrontScraper in order to demon-
strate how the ranking function correlates to the grade
set by the teacher. This strategy avoids risking any bi-
ases from the process of running FrontScraper. This is
a relatively small data set, however it should be suf-
ficient to illustrate that the basic principle works as
expected for ranking data roughly according to how
good the answers are. A larger study based on already
marked exams and assignments is required in order to
identify the best ranking function. This should also
include analysing how well the tool works across dif-
ferent disciplines. This is however left as future work.
The entropy vs. grade boxplot in Figure 3 shows
two interesting features:
1. The median word entropy increases strictly as a
function of grade.
CSEDU 2016 - 8th International Conference on Computer Supported Education
194

Figure 4: Measured entropy vs. assignmed grade for length-
corrected Shannon word entropy
p
|
X
|
H(X).
2. The variance is smallest for the top grade A, and
increases for poorer grades.
The first feature means that the metric can be used to
distinguish between good and bad answers. It is how-
ever not precise enough for automatic grading, since
the entropy metric cannot assess the relevance of the
text. The last feature (variance reduction) is proba-
bly caused by the fact that it gets exponentially harder
for the student to improve the entropy for very good
answers. The reason for this is that the information
density measure increases by a factor of two for each
additional bit required to represent the metric. The
best answers will therefore tend to gather at the top
with relatively little variance. The lack of variance
may also be caused by the design of the exercises,
which favours questions with one or a few variants of
correct answers. Poorer answers, on the other hand,
have higher variance, because there are more ways of
doing something wrong or poorly than there are ways
of doing them right.
A limitation with entropy as a measure of infor-
mation content, is that the entropy only depends on
word frequencies. It is therefore possible to have a
very brief answer with high entropy. The extreme ex-
ample is an answer with a distinct set of unique words
(e.g. “I do not know the answer”), which would have
a word entropy of 1. One way to mitigate this prob-
lem, is to also consider the length of the student an-
swer in words
|
X
|
as part of the heuristic on how com-
prehensive the student answer is. It is however recom-
mendable to penalize overly long answers. One way
to do this, is to multiply the entropy with the square
root of the word length, so that the indicator consid-
ers a combination of information diversity and con-
tent length, however penalizing the benefit of overly
long answers. Figure 4 shows a boxplot with the cor-
relation between grade and the length corrected met-
ric
p
|
X
|
H(X). An advantage with this metric, is that
the length correction makes the overall scale more lin-
ear, and the variance independent of grade. This also
avoids the risk that some comprehensive answers that
use a relatively simple language get a too poor rank-
ing, for example if the student uses longer descrip-
tions with fewer words in the explanation. The fig-
ure also indicates that this metric discriminates better
than the plain Shannon entropy, especially for poor
answers (grade E and F). The advantage with this met-
ric is that it allows for coarse-sifting student answers
from poor, via medium to good answers.
It may be possible to do even better using
knowledge-based marking strategies, such as Latent
Semantic Analysis (LSA) which also considers se-
mantic clues from the words in the text (Foltz et al.,
1999; Kakkonen et al., 2005; Rehder et al., 1998; Zen
et al., 2011), however this is at the expense of hav-
ing to build up a suitable set of good model answers.
An advantage with our simple metric, is that it works
without a database of model answers. We do however
envisage that our method in the future could be ex-
tended with more advanced ranking algorithms such
as LSA by building on the database of already marked
answers.
6 DISCUSSION
Marking assignments "across" sub-assignments has
the advantage that the teacher tends to use the grade
scale more consistently, since the teacher compares
each sub-assignment with others on a fair ground, in-
stead of being biased by previous answers by the stu-
dent. This avoids the risk that the teacher becomes
overcautious if a student has a bad start on the assign-
ment. Furthermore, if the teacher has a poor day, then
this affects all students more equally using marking
across sub-assignment answers, than if marking of en-
tire assignments is being used. It must furthermore be
emphasised that the ranking method requires manual
quality assurance by the teacher. It is not suitable for
automatic grading since it would be possible for the
student to manipulate the ranking by writing varying,
but not necessarily relevant text.
Following the approach described in this paper
can be expected to be faster than traditional assign-
ment by assignment marking. We experienced a
speed-up from 68 hours effort for marking exercise
2 using the traditional approach to 58 and 41 hours
for exercise 3 and 4 respectively. Exercise 3 was done
during development of FrontScraper, and exercise 4
used the current version of the tool. It must how-
ever be noted that these numbers are only circum-
stantial evidence. A more statistically sound quan-
Streamlining Assessment using a Knowledge Metric
195

tification of the improvement is left as future work.
It must also be noted that the assignments were not
planned to be marked using FrontScraper. There was
for example no page limit on the assignments, which
is some of the reason why the marking took so long
time. FrontScraper was perceived as a good help for
the teacher for marking the assignments, and it gave
the teacher very good overview of the results com-
pared to having to manually extract all data from the
LMS.
In order to aid the teacher, the system also keeps
track of a list of unique answers given to students,
so that the teacher can choose from this palette of
answers when giving feedback. The system caches
already downloaded assignments, in order to reduce
the strain on the learning management system (Class-
Fronter).
An additional benefit by using this approach, is
that sub-assignments that are equal or very similar
typically will be marked next to each other, which
makes it easy to detect plagiarism in the form of copy-
ing of answers between students.
7 RELATED WORKS
Our approach uses a methodology for improved plan-
ning, definition and grading of assignments and ex-
ams that uses an entropy-based metric for ranking as-
signments, together with a supporting tool for mark-
ing across sub-assignments.
Another popular approach for performing auto-
matic grading of essays and similar answer texts is
using Latent Semantic Analysis (LSA) (Foltz et al.,
1999; Rehder et al., 1998; Zen et al., 2011). This
method aims at performing automatic grading of the
content by comparing the answers to select learning
material and human-graded essays. Our approach
does not aim at performing automatic grading, but
rather being a system for improved content organisa-
tion and support for teacher based grading. Our ap-
proach is simple compared to LSA, however it also
has the advantage of being general, language inde-
pendent and not requiring the pre-training required to
learn the concepts required for automatic grading as
LSA does. A limitation with our solution is, however
that it uses a simple heuristic measure of answer com-
plexity based on information diversity and length, and
does not attempt to understand the text semantics.
Probabilistic Latent Semantic Analysis (PLSA)
is a statistical technique for the analysis of co-
occurrence of words. The parameters of PLSA are
learnt using Expectation Maximisation based unsu-
pervised clustering. This method has been imple-
mented in the automatic essay grading system AEA
(Kakkonen et al., 2005). Both LSA and PLSA can use
entropy-based term weighting in order to give higher
values to words that are more important (Kakkonen
et al., 2005).
There are several code quality assessment systems
that are useful for automatic feedback to student’s
submitted code for programming exercises. They are
however usually restricted to evaluating code in one
specific programming language. These tools may be
based on error checking, code metrics, machine learn-
ing, or a combination of these (Barstad et al., 2014).
Other methods that have been suggested are
amongst others k-nearest neighbour, Naïve Bayes, ar-
tificial neural networks and decision tree for classi-
fying programming exercises as either well written
or poorly written (Barstad et al., 2014; Valenti et al.,
2003).
A different, but somewhat related area of research,
is the quantitative analysis of different grading poli-
cies in education (Sikora, 2015). This research sug-
gests that the entropy of a grading scheme measures
the amount of information carried by a student’s grade
and therefore a grading scheme should be chosen
which maximises the entropy of the student grades,
whilst also having high consistency in the grading
over time. This research uses entropy for a different
purpose than our paper, since it is used for theoret-
ical analysis of the performance of different grading
schemes.
Moodle supports Turnitin’s GradeMark, which
can be integrated with a plagiarism checking tool and
allows the instructors to grade and mark up papers us-
ing a set of standard and custom comments (Buckley
and Cowap, 2013). Our approach is different by pro-
viding a work-flow that marks across sub-answers us-
ing an information metric that allows for coarse sort-
ing the assignments into the comprehensive and the
superficial ones, which aids in determining the correct
overall level of the group. It inherently has the desir-
able property of clustering answers that are very sim-
ilar, which increases the marking speed, since similar
answers can get similar comments.
8 CONCLUSIONS
This paper presents the FrontScraper tool with sup-
porting assessment methodology. It aims at providing
more efficient grading of student assignments and ex-
ams. This is achieved by using an assessment method
that reduces the cognitive load of the teacher dur-
ing assessment by supporting a work-flow of marking
each sub-assignment instead of whole assignments
CSEDU 2016 - 8th International Conference on Computer Supported Education
196

in the LMS. The student answers are furthermore
roughly sorted from the most comprehensive and to
the least comprehensive answers, which reduces the
cognitive load of the teacher. This avoids having to
jump between poor and good students all the time.
The metric also has the inherently useful property
of providing implicit plagiarism detection, by listing
equal results beside each other, and similar results
typically close to each other. The tool furthermore
manages a list of previous comments given to stu-
dents, which increases the consistency of the mark-
ing.
Overall, this gives an increase in both marking
speed and precision, as well as a reduction in the
cognitive load of the teacher during marking, which
reduces the risk of fatigue and loss of focus during
marking.
9 FUTURE WORK
We should add support for an offline mode, so that
you can sync the results with ClassFronter afterwards,
if it is too heavily loaded. This will also reduce the
strain on the LMS when using the system.
Future work is also adding support for more com-
prehensive text analysis in order to understand the se-
mantics of the text being marked. This can for ex-
ample be done using LSA analysis and similar tech-
niques.
Another idea is supporting more advanced grading
schemes, such as assigning grades based on percentile
scores or even distribution scoring using both cur-
rently and previously marked results as well as grade
calibration, as suggested by (Sikora, 2015).
We may in the future consider writing a graphi-
cal user interface as an alternative to the current com-
mand line interface, as well as better integration with
the LMS. A comprehensive study for quantifying the
effect of using FrontScraper compared to alternative
methods is also left as future work. It would also be
interesting to evaluate how well FrontScraper works
for different subjects and disciplines. Another idea is
combining FrontScraper with peer-to-peer evaluation,
where the students could compare their own answer to
their peers as a rough check before submitting, in or-
der to get a reality orientation on own contribution.
This would inspire students to submit higher-quality
answers.
REFERENCES
Barstad, V., Goodwin, M., and Gjøsæter, T. (2014). Pre-
dicting Source Code Quality with Static Analysis and
Machine Learning.
Buckley, E. and Cowap, L. (2013). An evaluation of the use
of Turnitin for electronic submission and marking and
as a formative feedback tool from an educator’s per-
spective. British Journal of Educational Technology,
44(4):562–570.
Dretske, F. (1981). Knowledge and the Flow of Information.
MIT Press.
Dretske, F. (2000). Perception, Knowledge and Belief: Se-
lected Essays. Cambridge University Press.
Dretske, F. I. (1997). Naturalizing the Mind. MIT Press.
Foltz, P. W., Laham, D., Landauer, T. K., Foltz, P. W., La-
ham, D., and Landauer, T. K. (1999). Automated Es-
say Scoring: Applications to Educational Technology.
volume 1999, pages 939–944.
Kakkonen, T., Myller, N., Timonen, J., and Sutinen, E.
(2005). Automatic Essay Grading with Probabilistic
Latent Semantic Analysis. In Proceedings of the Sec-
ond Workshop on Building Educational Applications
Using NLP, EdAppsNLP 05, pages 29–36, Strouds-
burg, PA, USA. Association for Computational Lin-
guistics.
Rehder, B., Schreiner, M. E., Wolfe, M. B. W., Laham,
D., Landauer, T. K., and Kintsch, W. (1998). Using
latent semantic analysis to assess knowledge: Some
technical considerations. Discourse Processes, 25(2-
3):337–354.
Shannon, C. E. (1948). A Mathematical Theory of Commu-
nication. Bell System Technical Journal, 27:379–423,
623–656.
Sikora, A. S. (2015). Mathematical theory of student as-
sessment through grading.
Valenti, S., Neri, F., Cucchiarelli, A., Valenti, S., Neri, F.,
and Cucchiarelli, A. (2003). An Overview of Cur-
rent Research on Automated Essay Grading. Jour-
nal of Information Technology Education: Research,
2(1):319–330.
Zen, K., Iskandar, D., and Linang, O. (2011). Using La-
tent Semantic Analysis for automated grading pro-
gramming assignments. In 2011 International Con-
ference on Semantic Technology and Information Re-
trieval (STAIR), pages 82–88.
Streamlining Assessment using a Knowledge Metric
197
