
Fast Sequence Component Analysis for Attack Detection in Smart Grid
Jordan Landford
1
, Rich Meier
2
, Richard Barella
3
, Scott Wallace
3
, Xinghui Zhao
3
,
Eduardo Cotilla-Sanchez
2
and Robert B. Bass
1
1
Maseeh College of Engineering and Computer Science, Portland State University, Portland, U.S.A.
2
School of Electrical Engineering & Computer Science, Oregon State University, Corvallis, U.S.A.
3
School of Engineering and Computer Science, Washington State University Vancouver, Vancouver, U.S.A.
Keywords:
Spoofing, Phasor Measurement Unit (PMU), Synchrophasors, Correlation, Event Detection, Machine
Learning, Support Vector Machine (SVM).
Abstract:
Modern power systems have begun integrating synchrophasor technologies into part of daily operations. Given
the amount of solutions offered and the maturity rate of application development it is not a matter of “if” but
a matter of “when” in regards to these technologies becoming ubiquitous in control centers around the world.
While the benefits are numerous, the functionality of operator-level applications can easily be nullified by
injection of deceptive data signals disguised as genuine measurements. Such deceptive action is a common
precursor to nefarious, often malicious activity. A correlation coefficient characterization and machine learning
methodology are proposed to detect and identify injection of spoofed data signals. The proposed method uti-
lizes statistical relationships intrinsic to power system parameters, which are quantified and presented. Several
spoofing schemes have been developed to qualitatively and quantitatively demonstrate detection capabilities.
1 INTRODUCTION
Phadke and Thorp’s 1988 invention, the phasor mea-
surement unit or PMU, provides power systems op-
erators with near real-time measurements of Stein-
metz’s current and voltage phasors, thereby permit-
ting improved wide-area monitoring, control and pro-
tection of power systems(Phadke, 2002; Steinmetz,
1893; De La Ree et al., 2010). Imperative when us-
ing PMUs for any of these purposes is to ensure data
integrity. Data integrity may be compromised ran-
domly, as data drops or clock drifts, or maliciously
via data injection.
We propose that disruptions to data integrity may
be detected by monitoring correlation values between
phasor measurements from multiple adjacent PMUs.
In previous work, we show that a matrix of correla-
tion values between a cluster of PMUs can quickly
reveal data corruption, particularly data drops and
GPS clock drift(Meier et al., 2014). These kinds of
events result in rapid decorrelation between the af-
flicted PMU and all others, observable as the appear-
ance of a row and column of very low correlation val-
ues. The parameters at electrically-close PMUs are
normally highly correlated; fluctuations in voltage,
phase and frequency are not single-bus behaviours,
as adjacent buses will experience similar effects in a
well-correlated manner.
Both data drops and drifts result in very rapid
decorrelation. Less likely to be detected would be
spoofing attacks whereby vectors of “typical” PMU
data are somehow injected in place of a PMU’s actual
output data stream. Carefully-chosen vectors could
be used to disguise an attack that would otherwise al-
ter PMU data measurements, thereby providing the
attackers with cover while conducting a malicious at-
tack at a substation. By leveraging historic archived
PMU data, we believe we can characterize the distri-
bution of correlation values during normal operation
with enough fidelity to identify many potential spoof-
ing strategies.
In order to mount a successful attack, vectors of
“typical” data, which we refer to as “spoofed” data,
must be injected in place of the actual data stream in
order to not raise alarms to the attack. It is reason-
able to assume an attacker could generate a represen-
tative vector of positive sequence voltage data, given
its propensity to be within ±10% of 1.0 p.u. Gener-
ating a convincing pair of vectors, however, would be
less likely, particularly if the parameters are weakly-
correlated. By monitoring correlation values of sev-
eral parameters between multiple electrically close
Landford, J., Meier, R., Barella, R., Wallace, S., Zhao, X., Cotilla-Sanchez, E. and Bass, R.
Fast Sequence Component Analysis for Attack Detection in Smart Grid.
In Proceedings of the 5th International Conference on Smart Cities and Green ICT Systems (SMARTGREENS 2016), pages 225-232
ISBN: 978-989-758-184-7
Copyright
c
2016 by SCITEPRESS – Science and Technology Publications, Lda. All rights reserved
225

PMUs, attempts to inject false data may be detected.
Data-driven attacks have been suggested in the related
literature (Kim et al., 2014; Kim et al., 2015).
In this paper, we propose an approach to detect
spoofed signals from PMU data streams by monitor-
ing the change of correlation values between PMUs.
The data used in this study are collected by Bon-
neville Power Administration in their wide-area mon-
itoring system. We first examine intra-PMU and inter-
PMU correlations to identify useful features for de-
tecting spoofed signals. These features are then used
to train a set of two-class Support Vector Machines
(SVMs) for detecting specific types of spoofs. The
experimental results on a separate testing data set
show that this approach is accurate in detecting dif-
ferent types of spoof attacks.
The remainder of the paper is organized as fol-
lows. Section 2 presents background and related re-
search work on spoof attacks and detection. In Sec-
tion 3, we analyze the correlation values of our PMU
dataset for the purpose of identifying useful features.
In Section 4, we describe the feasibility of using PMU
data correlation to detect spoofed signals, and the
details of our Support Vector Machines. Section 5
presents our evaluation metrics, as well as experimen-
tal results. Finally, in Section 6 we conclude the paper
and present future directions of this research.
2 BACKGROUND
Attacks wherein spoofed data are injected into a
SCADA system to disguise an attack have been doc-
umented, most notoriously Stuxnet(Langner, 2011;
Kushner, 2013; Chen and Abu-Nimeh, 2011).
Stuxnet was a computer worm designed to be inflicted
upon on industrial equipment, specifically Siemens
PLCs (programmable logic controllers). The intent
of Stuxnet was to physically destroy a specific target,
in this case thousands of Iranian uranium centrifuges.
Stuxnet was a sophisticated multi-modal attack for
which spoofing was used to mask malicious activities.
Specifically, Stuxnet periodically varied the mechan-
ical frequency of the centrifuges while concurrently
masking these changes by producing spoofed process
control signals. As such, the PLCs would not shut
down because they could not observe the abnormal
behaviour.
One lesson of Stuxnet is that physical infras-
tructure may come under the control of malware.
Even isolated industrial systems are vulnerable to
physical attack, and sensor spoofing is a means
by which such an attack may be masked. Other
critical cyber-physical systems are also susceptible
to attack, notably Global Navigation Satellite Sys-
tems (GNSS), a susceptibility that has been known
for over twelve years(Warner and Johnston, 2002;
Humphreys, 2009). A spoofing detection method for
GNSS has been developed by Magiera and Katul-
ski based on measurements of phase delay(Magiera
and Katulski, 2013). Similar to our own approach
with PMUs, Psiaki et al., use cross-correlation of en-
crypted signals between two GNSS receivers to de-
tect spoofing of publicly-known signals(Psiaki et al.,
2013).
Other vulnerable cyber-physical systems include
vehicular ad hoc network, and of course, electrical
power systems(Petit et al., 2011). PMUs are be-
coming critical data sources for multiple power sys-
tems functions, providing measurements for state es-
timators, initiating remedial action schema, and es-
timating voltage-stability margins(Vu et al., 1999).
Threat potential has been demonstrated by Jiang, et
al., whereby they maximize the difference between
the PMU’s receiver GPS clock offset before and after
an attack(Jiang et al., 2013a). And, Zhang, et al. in-
vestigated the consequences of an attack on the time
stamps of data collected within a smart grid wide-area
network(Zhang et al., 2011). Threats to PMUs have
been summarized by Shepard, et al.(Shepard et al.,
2012).
Machine learning techniques have proved to be ef-
fective in detecting security attacks in cyber-physical
systems (Mitchell et al., 2013) (Amor et al., 2004), in-
cluding smart grid (Kher et al., 2012). However, to the
best of our knowledge, there is no previous work on
detecting spoofed signals injected in real PMU data
streams. This paper presents an approach in this di-
rection.
3 METHODOLOGY
We use PMU data from ten electrically-close PMUs
from Bonneville Power Administration’s 500 kV
PMU network. These data were recorded at 60 frames
per second.
3.1 Intra-PMU Parameter Correlation
PMUs measure phasors of line voltages and line cur-
rents for all voltages (A, B, C) and currents (A, B,
C, N). From these are derived a number of other pa-
rameters, including magnitude and phase angle for
the positive, negative and zero sequence voltages and
currents; frequency; and rate of change of frequency
(ROCOF); among others(IEEE, 2006). Some of these
parameters show moderate correlation between each
SMARTGREENS 2016 - 5th International Conference on Smart Cities and Green ICT Systems
226
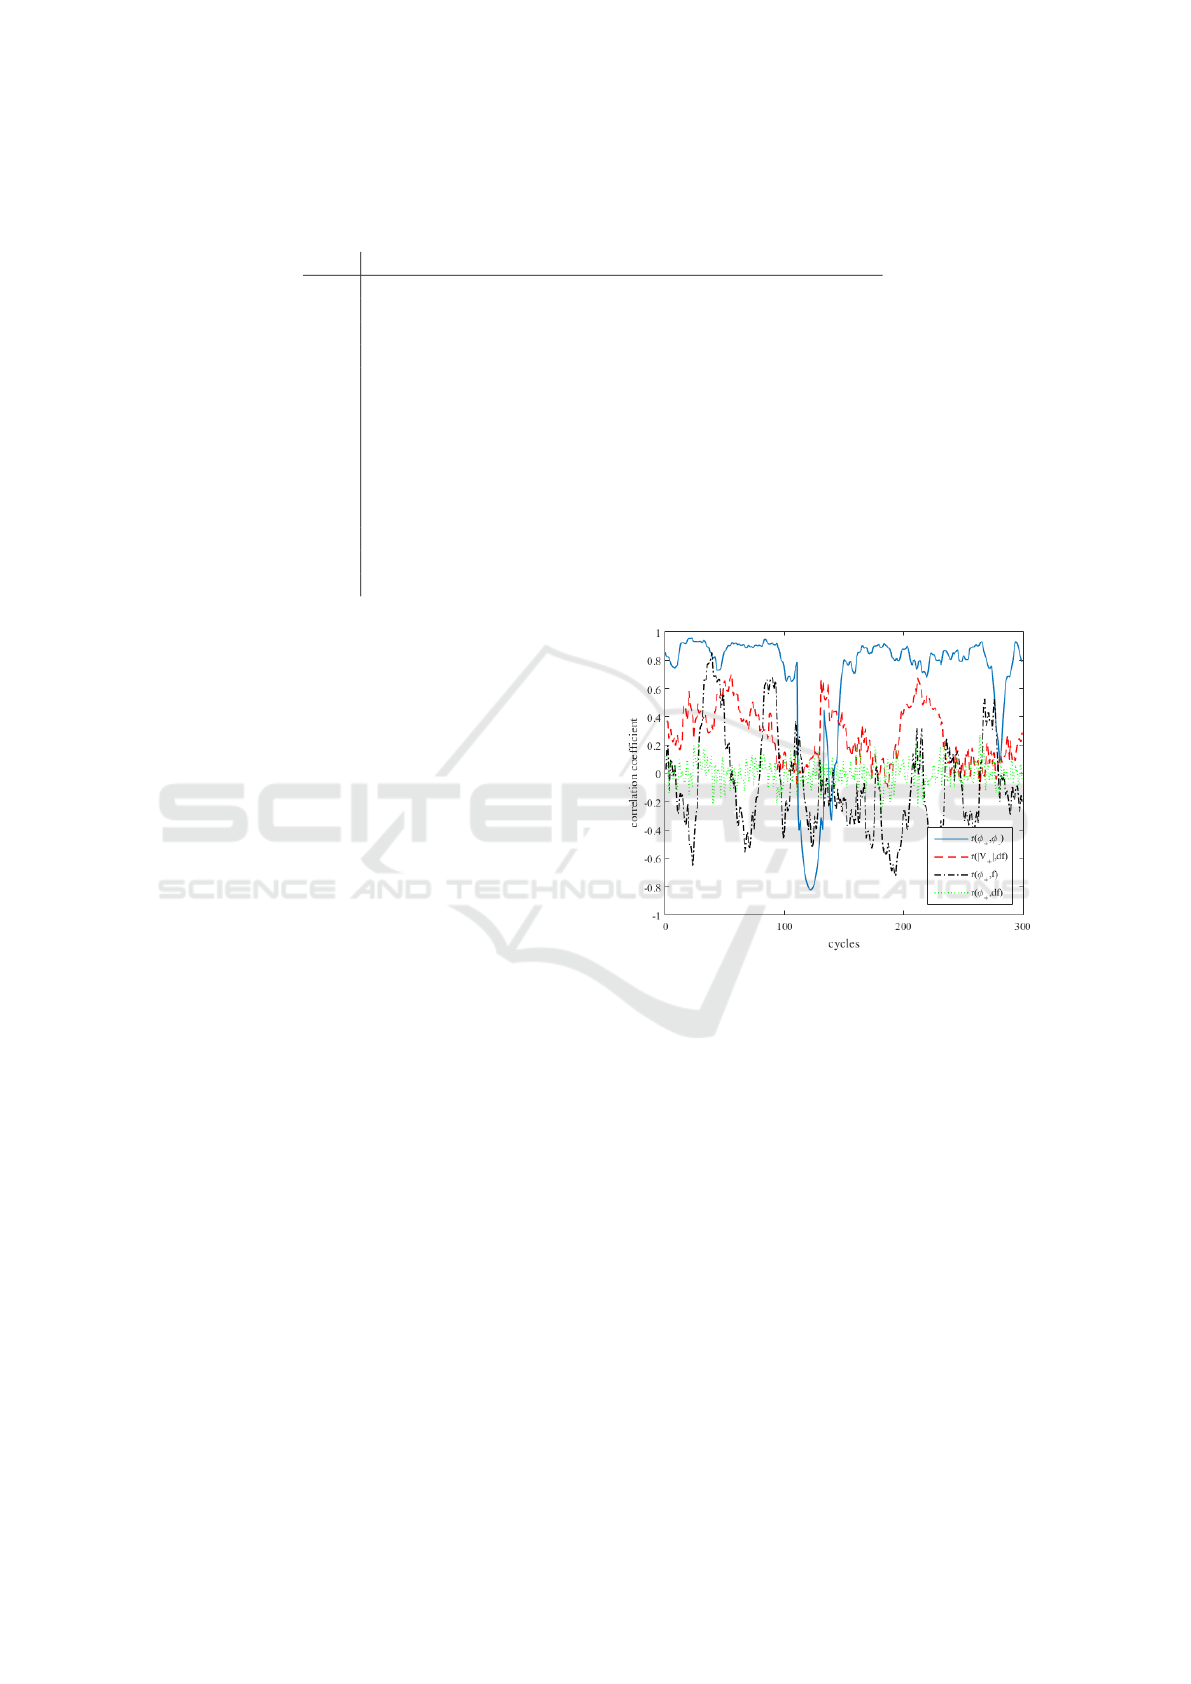
Table 1: Mean and standard deviation, µ (σ), of correlation between intra-PMU parameters. |V
+
|, |V
−
| and |V
0
| are the
positive, negative and zero sequence voltage magnitudes. φ
+
, φ
−
and φ
0
are the positive, negative and zero sequence voltage
phase angles. f and ROCOF are the system frequency and its rate of change.
φ
+
|V
−
| φ
−
|V
0
| φ
0
f ROCOF
|V
+
| -0.06 -0.02 0.07 0.07 -0.03 0.32 0.17
(0.49) (0.34) (0.47) (0.36) (0.48) (0.25) (0.19)
φ
+
-0.03 0.72 -0.03 0.82 0.00 0.00
(0.42) (0.44) (0.43) (0.41) (0.40) (0.09)
|V
−
| -0.06 0.06 0.03 -0.11 0.01
(0.40) (0.30) (0.43) (0.32) (0.18)
φ
−
0.11 0.67 0.04 -0.01
(0.40) (0.42) (0.37) (0.12)
|V
0
| 0.04 -0.02 0.01
(0.42) (0.27) (0.16)
φ
0
0.02 0.02
(0.39) (0.11)
f 0.52
(0.09)
other, but most do not.
We use the Pearson correlation coefficient (r) to quan-
tify the degree of correlation between PMU param-
eters. Intra-PMU parameters that are weakly corre-
lated can be used to detect spoofing attempts using the
method described in this paper. Monitoring multiple,
poorly correlated PMU parameters makes it more dif-
ficult for the attackers to provide convincing spoofed
data sets. Table 1 shows the mean and standard devi-
ation of correlation values between PMU parameters
from a single PMU. Correlation values were calcu-
lated for each time step using a one second wide slid-
ing window. The mean and standard deviation were
then calculated using 59 seconds of data.
Most, but not all of the intra-PMU correlation r
values are near zero, though with wide standard devi-
ations. We observe modest correlation between the
phase angles of the sequence components, 0.7 and
above. We observe weak correlation, with small stan-
dard deviations, between the voltage angles and fre-
quency, as well as between the voltage magnitudes
and the rate of change of frequency. The weakest
correlation, with very little deviation, we observe be-
tween the voltage angles and the rate of change of
frequency. Correlations between pairs of intra-PMU
parameters as a function of time are illustrated in Fig-
ure 1. The weakly correlated parameters with narrow
standard deviations are the best candidates for use in
detecting spoofing attempts, if the correlation of these
parameters between adjacent PMUs is strong.
3.2 Inter-PMU Correlation
To quantify the degree of correlation between parame-
ters of nearby PMUs, we again use the Pearson corre-
Figure 1: Plot of sliding window intra-PMU correlation val-
ues. High correlation is observed between sequence phase
angles, such as φ
+
and φ
−
. Low correlation, with wide de-
viation is observed between |V
+
| and ROCOF as well as
between and φ
+
and f . Low correlation and low deviation
is observed between φ
+
and ROCOF.
lation. For example, given PMUs numbered 1,2 .. ., p
we develop
p
2
vectors of correlation values between
the positive sequence voltage magnitude R
i j
(|V
+
|) for
every pair of PMUs i < j. This is repeated for the
|V
−
|, |V
0
|, φ
+
, φ
−
, φ
0
, f and ROCOF data. These
correlation values fluctuate with time, since the cor-
relation is performed using data windows of a fixed
length. For this work, we examined windows of 1, 2,
5 and 10 seconds in length.
We found that the correlation vectors r(|V
+
|),
r(φ
+
) and r( f ) are good candidates for detecting
spoofing attacks, as these consistently exhibit mod-
erate to high correlation values over wide ranges of
time. The r(φ
+
) correlation values are exceptionally
high, near 1.0 under normal circumstances. On the
Fast Sequence Component Analysis for Attack Detection in Smart Grid
227
other hand, r(|V
−
|), r(|V
0
|), r(φ
−
) and r(φ
0
) do not
exhibit consistent moderate correlation. ROCOF cor-
relation between PMUs is very poor, likely due to the
fact that it is the second derivative of the positive se-
quence phase angle, and hence more susceptible to
noise.
3.3 Modeling a Spoofing Event
Our spoofed data set was derived by recording 30 sec-
onds (1800 cycles) of PMU data from one of our ten
PMU sites, then playing back these data in a modified
form to generate the final 30 seconds of a complete
minute. We considered the following spoof playback
schemes:
• S1: Mirroring in which the initial 30 seconds of
data are played back in reverse to produce the final
30 seconds of data.
• S2: Polynomial Fit in which a 3
rd
degree polyno-
mial is fit to the initial 30 seconds of data. This
polynomial is combined with a noise profile to
generate the final 30 seconds of data.
• S3: Time Dilation in which we record a full 60
seconds of data from the spoofed PMU, but re-
sample the final 30 seconds of data so the signal
appears stretched over time. For this spoof, we ex-
plored various rates of time dilation ranging from
very slow (a factor of 2 slower than real-time) to
near real time (a factor of 8/7 slower than real-
time). Recent studies challenging the security of
GPS hardware for PMUs detail the feasibility of
this type of spoofing approach (Jiang et al., 2013b;
Zhang et al., 2013; Bonebrake and ONeil, 2014).
Each spoofing approach above guarantees signal
continuity for all parameters at the instance spoofing
is initiated, and correlation for a brief time after that
transition. All ten of the monitored PMU sites are
electrically close, showing strong correlation between
their frequency measurements.
4 SPOOF DETECTION VIA
SUPPORT VECTOR MACHINES
To illustrate the feasibility of using correlation to de-
tect spoof attacks, we have carried out an initial anal-
ysis on real PMU data to investigate the impact of
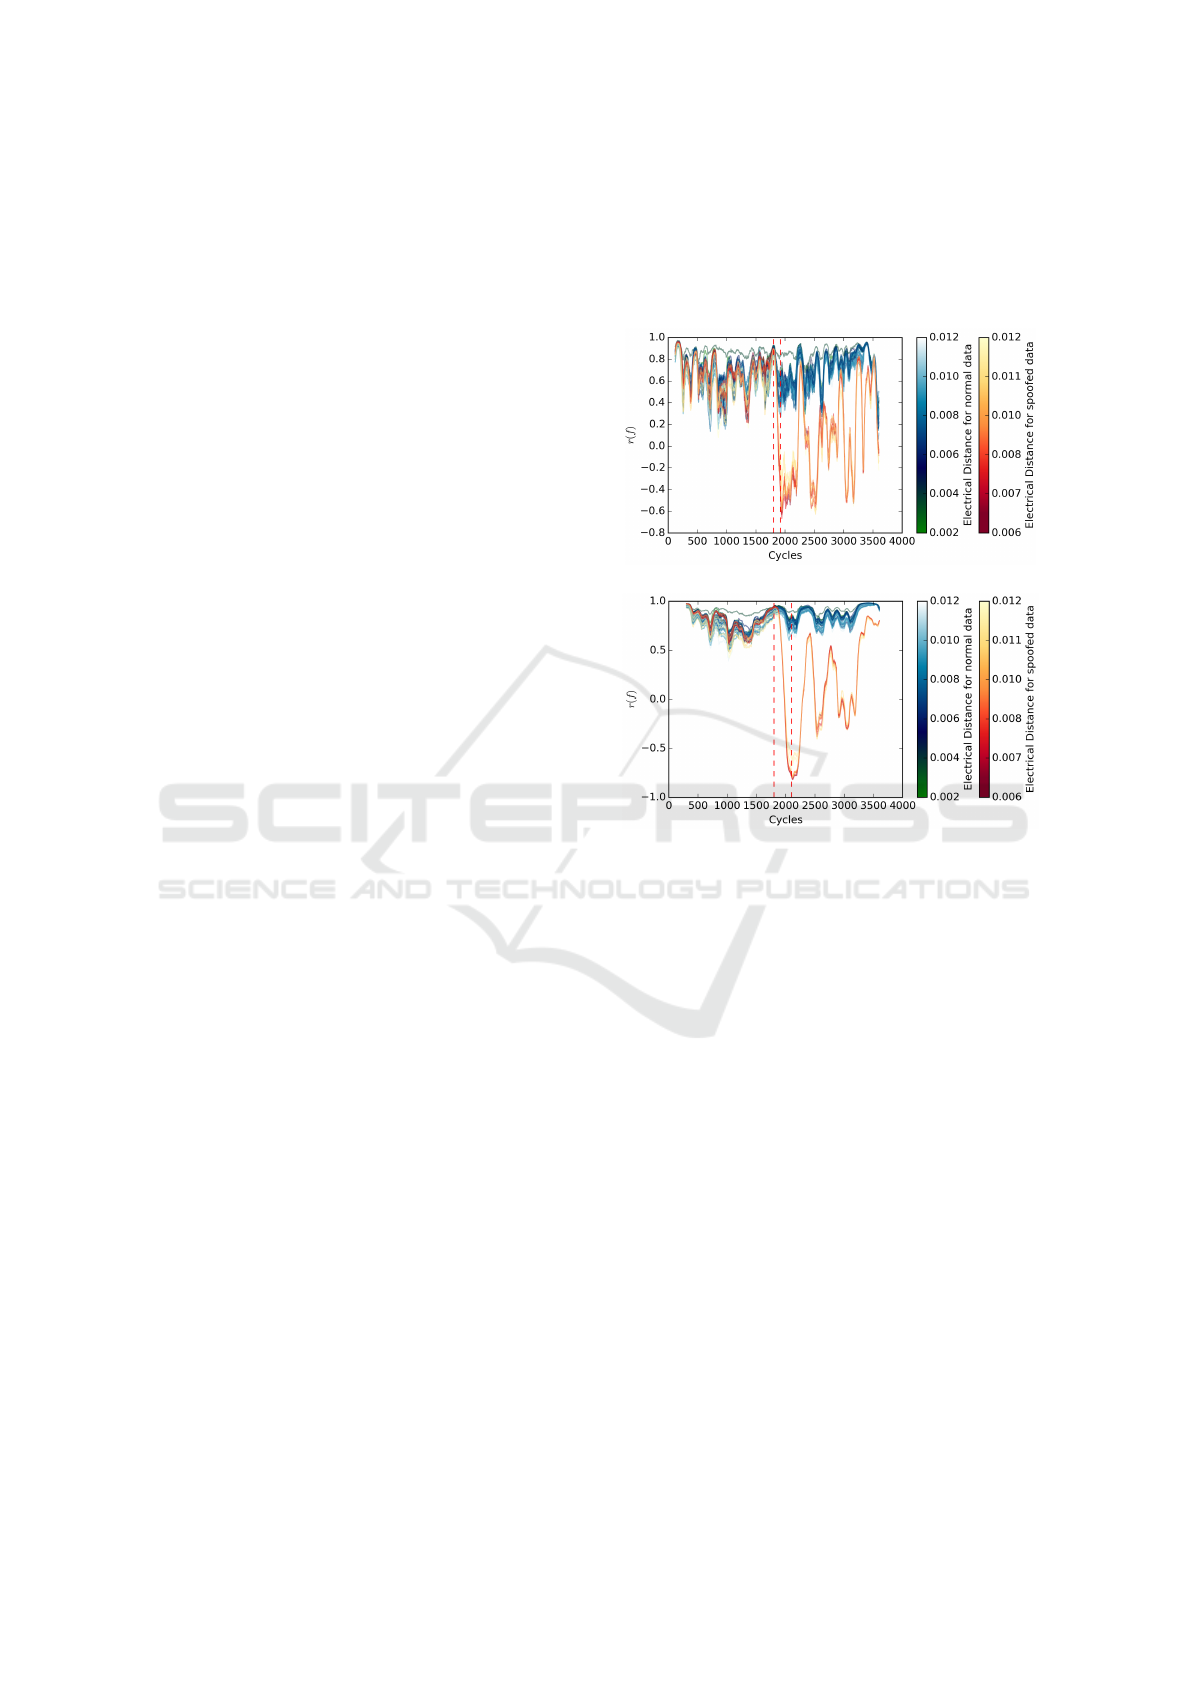
an example spoof attack, mirroring spoof. Figure 2
shows the impact of data injection (S1: Mirroring
Spoof) upon the correlation of frequency measure-
ments between PMUs. Correlation of frequency mea-
surements between all PMUs is greater than 0.5 prior
to the spoofing event at 1800 cycles, as shown by the
yellow-red and blue-green gradient curves on the left
side of the Figure. The color gradients indicate the
electrical distance between each pair of PMUs; PMUs
that are electrically close show higher correlation.
(a) 120 cycle (2 seconds) window size
(b) 300 cycle (5 seconds) window size
Figure 2: Plot of the Pearson correlation coefficient of fre-
quency r( f ) using a window size of (a) 120 cycles and
(b) 300 cycles. The spoofed signal affects correlation with
nine other PMUs, results in nine deviating correlation plots,
shown as yellow-red curves. These deviate markedly from
correlation plots between non-spoofed PMUs, blue-green.
4.1 Support Vector Machines
Although the initial analysis on PMU data shows the
potentials of detecting the spoofing attack by moni-
toring correlations between PMU pairs, simply mon-
itoring one signal correlation (such as the frequency
correlation r( f )) may not guarantee a timely identi-
fication of a spoof across all types of spoofs. Rather,
we expect that robustly identifying spoofed signals re-
quires a careful examination of historical correlation
values. Bonneville Power Administration’s current
installed PMU base contains over 40 devices gener-
ating roughly 1.2 TB of data each month. The chal-
lenges associated with storing, accessing, and pro-
cessing this information in a timely manner will only
increase as the installation base expands. Therefore,
manual analysis on PMU correlation is not feasible.
To address these challenges, we use two-class
SMARTGREENS 2016 - 5th International Conference on Smart Cities and Green ICT Systems
228

Support Vector Machines (SVM) (Cortes and Vap-
nik, 1995) to learn a relationship that differentiates
spoofed PMU data from normal, untainted, PMU
data. A two-class SVM takes as input a set of train-
ing examples x
x
x
i
, i = 1 . . . n, and their associated labels
y
i
∈ {−1, 1}. In our case, the labels indicate that an
example is either normal or spoofed, and each exam-
ple is defined by an m-dimensional vector of features.
For our problem, these features are correlations be-
tween signals measured by two PMUs. Based on the
previous discussion, we considered two possible fea-
tures sets. The set of three features includes positive
sequence voltage magnitude and phase-angle correla-
tions (r
i, j
{V +}, and r
i, j
{φ
+
}) as well as frequency
correlation (r
i, j
{ f }). The set of five features adds
negative and zero -sequence phase angle correlations
(r
i, j
{φ
−
} and r
i, j
{φ
0
}) to the three feature set. All
correlations are computed on a trailing 300-cycle win-
dow for all pairs of PMUs, i < j.
For a given set of examples, described by their
feature vectors x
x
x, training the support vector machine
solves the optimization problem:
min
w,b,ξ
1
2
w
w
w
T
w
w
w +C
l
∑
i=1
ξ
i
subject to y
i
(w
w
w
T
φ(x
x
x
i
) + b) ≥ 1 − ξ
i
,
ξ
i
≥ 0, i = 1, . . . , l
(1)
Where ξ
i
are non-negative slack variables that al-
low a soft margin (one in which some instances are
incorrectly classified). The function φ transforms the
input vector x
x
x
i
into a higher dimensional space, C is a
regularization parameter, and the pair w
w
w, b defines the
hyper-plane that will serve as a classifier between the
class labels {−1, 1}. Equation 1 is easy to interpret,
but for efficiency, it is the dual form of this equation
that is typically solved. Although not presented here,
the dual form makes use of a kernel function, Equa-
tion 2, that defines the shape of the decision boundary
given a set of support vectors x
x
x
i
.
K(x
x
x
i
, x
x
x
j
) ≡ φ(x
x
x
i
)
T
φ(x
x
x
j
) (2)
We leverage the Python library sci-kit learn for
a Support Vector Machine implementation based on
libsvm(Pedregosa et al., 2011; Chang and Lin, 2011).
4.2 Training and Testing Data
Using the correlation features described above, we
constructed a set of examples for each spoof described
in Section 3.3 by applying the spoofing procedure to
the last 30 seconds of one selected PMU signal on
each of 14 different minutes of data. This approach
generates roughly 2 · 10
6
examples from the 14 min-
utes of data and the 45 PMU pairs i < j. Exam-
ples are “Spoofed” in the last half of each minute if
i is the spoofed PMU, and are “Normal” otherwise.
This approach yields approximately 5 times as many
“Normal” examples as “Spoofed” examples. Given
the 14 minutes of data, we use 11 minutes (roughly
1.6 · 10
6
examples) for training the SVM, and 3 min-
utes (roughly 4.5 · 10
5
examples) for testing. Dur-
ing training, all correlations features are standardized
(normalized to 0 mean and standard deviation of 1).
The normalization transforms from the training fea-
tures are saved so they can later be used to transform
testing data prior to being classified.
4.3 Parameter Selection and Training
During training, we used the RBF kernel parameter-
ized by the scalar value γ:
K(x
x
x
i
, x
x
x
j
) = exp(−γ||x
x
x
i
− x
x
x
j
||
2
) (3)
We then split the 11 training minutes into two sets
(8 and 3 minutes respectively) and performed a grid
search over the C, γ parameter space by training on
the former set and testing on the later. We performed
this search for both the three feature data and the
five feature data using the mirroring spoof (S1). In
both cases, we observed high performance (F1 > .95)
across a wide range of parameter settings. However,
we observed faster training times and marginally im-
proved F1 scores when using five features instead of
three. Thus, in subsequent sections, our results are
constructed using five feature training/testing data and
a RBF-SVM using the parameters C = 1.0, γ = 0.2.
Simultaneous to our exploration of feature set size
and SVM-parameter settings, we also explored two
methods of labeling the training data. Recall that each
minute of data contains a spoof in the final 30 sec-
onds and that the Support Vector Machines take, as
input, correlations between signals from pairs of dif-
ferent PMUs. Because the correlations are computed
on a trailing 300-cycle window, when the spoof be-
gins, the correlation window contains 299 cycles of
non-spoofed data, and only 1 cycle of spoofed data.
Intuitively, it seems that trying to identify the spoof
when the correlation window is dominated by nor-
mal data would lead to a substantially higher False
Discovery Rate (FDR), an undesirable outcome in a
real operating situation. To mitigate this effect, we
labeled the training data as Spoofed when the cor-
relation window contains a majority of spoofed data,
and as Normal otherwise (we call this training config-
uration late timing). In testing, however, data is la-
beled as Spoofed when the correlations window con-
Fast Sequence Component Analysis for Attack Detection in Smart Grid
229

tains one or more elements of spoofed data as this is
the moment when the spoof actually begins (we call
this early timing). Thus, our late timing training strat-
egy would be expected to trade off an improvement in
False Discovery Rate for a potentially slower latency
in recognizing the spoof when compared to an early
timing training strategy
1
.
5 EVALUATION
To evaluate our approach, experiments have been car-
ried out using our traning and testing datasets, as de-
scrived in Section 4.2. The performance measures we
used in the evaluation and experimental results are
presented in the following sections.
5.1 Performance Measures
Once trained, the support vector machine will be
tested using a new set of labeled data x
0
i
, y
0
i
. Perfor-
mance on this test set will be assessed with four met-
rics:
• Sensitivity: measures the ability to correctly de-
tect spoofed signals and is calculated as the num-
ber of true positives (spoofed examples identi-
fied as such) divided by the number of total posi-
tives (the total number of spoofed examples which
is the sum of true positives and false negatives).
Sensitivity ranges from 0% to 100% with an ideal
classifier measuring 100% sensitivity.
• False Discovery Rate: measures the propensity
to spuriously identify a spoof. This value is calcu-
lated as the number of false positives (normal ex-
amples identified as spoofs) divided by the num-
ber of detected spoofs (false positives plus true
positives). False Discovery Rate is equivalent to
(1-Precision). FDR ranges from 0% to 100%; an
ideal classifier has 0% FDR.
• F1: measures performance as a single value when
classes are not equally prevalent. It is the har-
monic mean of Sensitivity and Precision. F1 score
ranges from 0.0 to 1.0, higher values are better.
1
We used the same 8/3 split of the training set to examine
impact of training with early vs. late timing in an effort
to confirm the intuition described above. Contrary to our
expectation, the initial validation showed improved perfor-
mance in terms of F1, Sensitivity and Latency, with little
cost to False Discovery Rate. However, after training on
the full 11 minutes, we did observe a severe rise in FDR
when testing on the reserved 4 minutes of test data thereby
justifying the choice of late timing training.
• Latency: measures how long it takes to consis-
tently identify a spoof once it has begun. In this
study, we measure latency as the number of cy-
cles after the spoof begins but before the clas-
sifier correctly identifies a string of 30 consecu-
tive cycles as spoofed. Lower values are better.
Note that while our experiments are performed
on archived PMU data, our approach supports use
with streaming data with the same latency charac-
teristics described here.
5.2 Spoof-specific Classification Results
Table 2 illustrates the performance of our SVM classi-
fiers where each classifier is trained on a distinct type
of spoof. For completeness, in the first three columns
we show the total count of True Positives (Spoofed
data detected as such), False Positives (Normal data
detected as a Spoof) and False Negatives (Spoofed
data detected as Normal). From these raw data, we
also show summary statistics: Latency, Sensitivity,
False Discovery Rate and F1 score described in Sec-
tion 5.1.
The table illustrates that the Spoof-specific classi-
fiers all perform very well identifying over 77% of the
spoofed correlations while maintaining a low False
Discovery Rate. Note from a functional perspective,
these tests are likely to be overly stringent: a per-
fect test score can only be obtained by correctly clas-
sifying each of the momentary correlations. Higher
Sensitivity helps to ensure that the spoof will be de-
tected reasonably early, which, in a real-world setting
is likely to be the most salient goal.
Our latency measurements indicate that all SVMs
are able to detect their respective event types within 4
seconds (240 cycles), and often much more quickly.
This is particularly impressive given that the correla-
tion windows are 300 cycles long, so a 240-cycle la-
tency indicates the event can be detected even before
the correlation window is filled with spoofed data.
Figure 3 illustrates the classifier’s performance on
two typical spoofed signals. Figure 3a shows the Mir-
roring Spoof (S1), while Figure 3b shows a Time Di-
lation Spoof (S3.7). The green lines toward the top of
each plot show correlations between pairs of normally
operating PMUs. Recall that for each correlation fea-
ture, mean and standard deviations were obtained dur-
ing training to scale the features prior to learning and
classification; thus values are not bounded by [−1, 1].
Halfway through the minute, at Cycle 1800, the spoof
begins.
For the Mirroring Spoof (S1), we see relatively
rapid decorrelation of the spoofed signal’s frequency
(yellow and blue lines diverging from the cluster at
SMARTGREENS 2016 - 5th International Conference on Smart Cities and Green ICT Systems
230
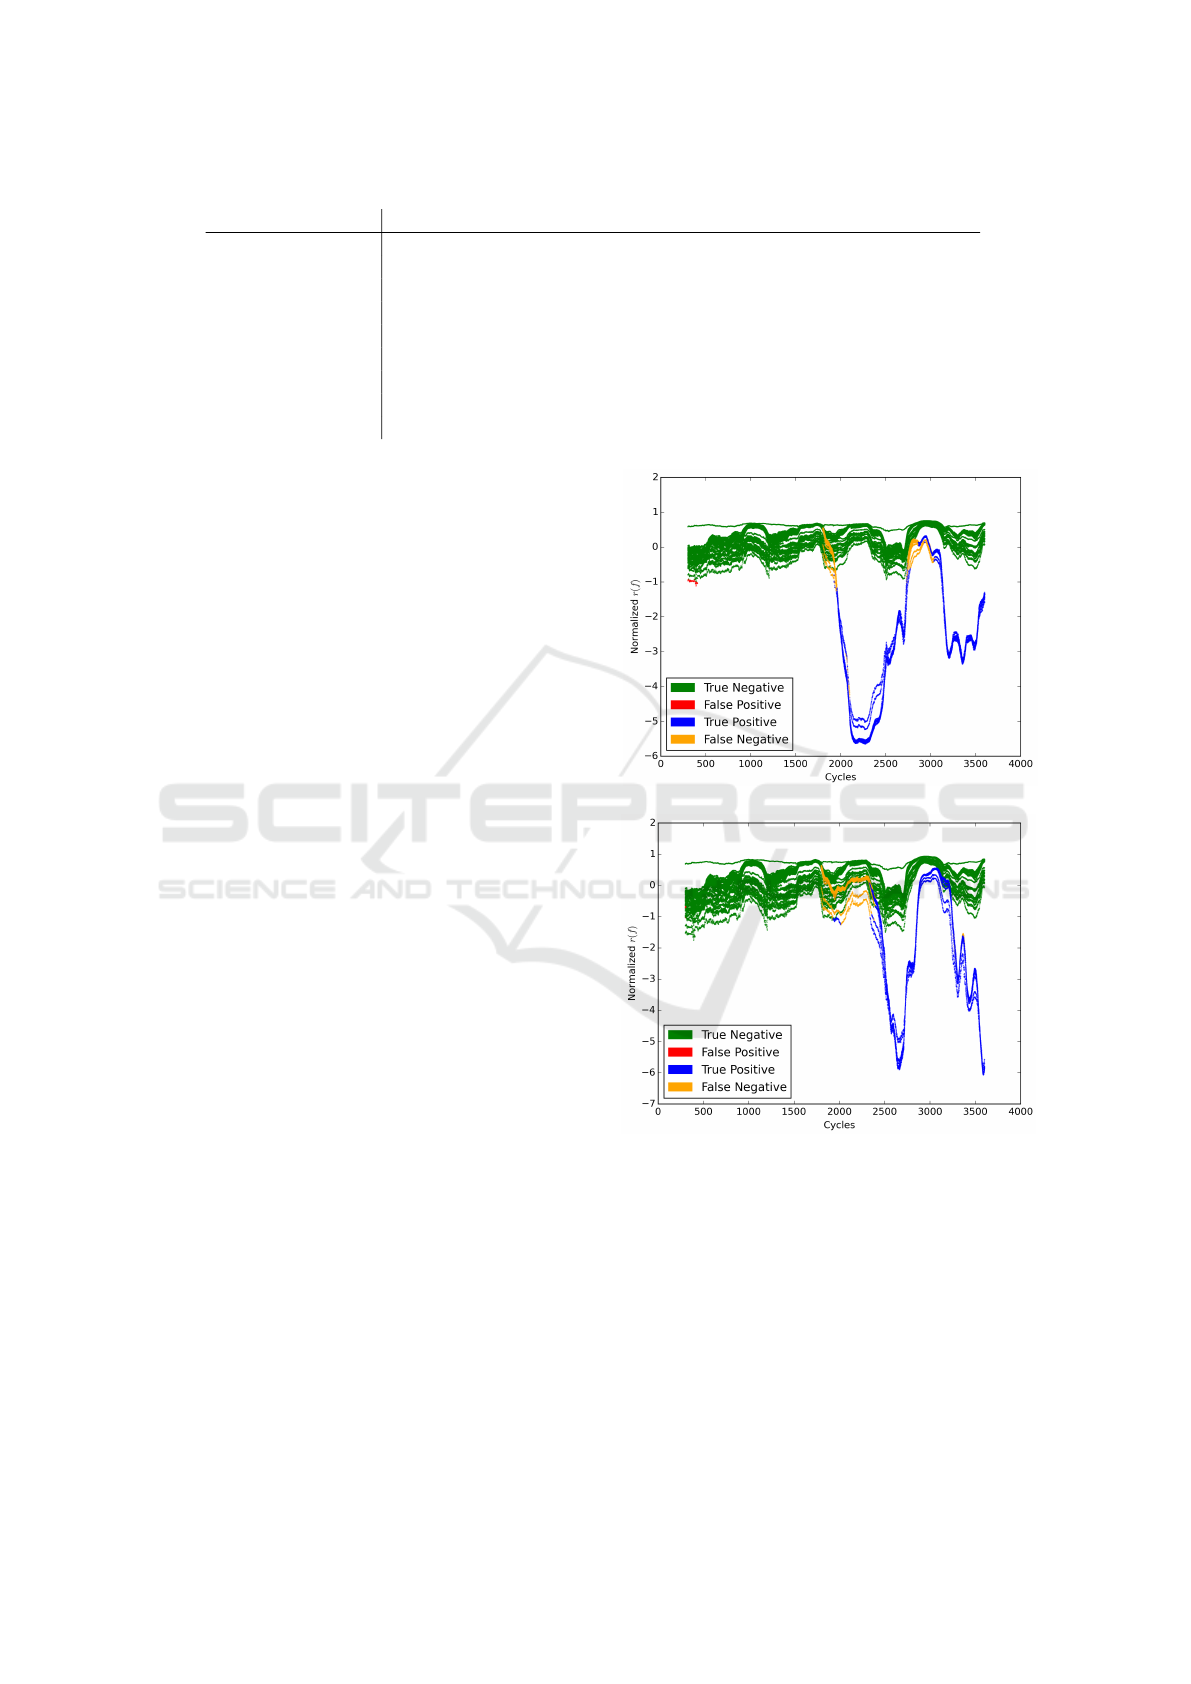
Table 2: SVM Performance When Trained on Specific Spoof Types. Spoof: + Normal: −.
Spoof Type True+ False+ False− Latency Sensitivity FDR F1
S1; Mirroring 40749 105 7905 [68, 148] 83.75% 0.26% 0.911
S2; Polynomial 39194 26 9460 [4, 204] 80.56% 0.07% 0.892
S3.1; Dilation x2 42163 301 6491 [120, 209] 86.66% 0.71% 0.926
S3.2; Dilation x3/2 41077 793 7577 [144, 223] 84.43% 1.89% 0.908
S3.3; Dilation x4/3 39602 870 9052 [154, 226] 81.40% 2.15% 0.889
S3.4; Dilation x5/4 39666 900 8988 [157, 214] 81.53% 2.22% 0.889
S3.5; Dilation x6/5 39054 1102 9600 [154, 213] 80.27% 2.74% 0.879
S3.6; Dilation x7/8 38138 654 10516 [134, 223] 78.39% 1.69% 0.872
S3.7; Dilation x8/9 37601 520 11053 [130, 217] 77.28% 1.36% 0.867
approximately 1800 cycles). The decorrelation hap-
pens much more slowly for the Time Dilation Spoof
(S3.7). For both spoofs, there are significant periods
during which the frequency correlation values for the
spoofed signal are well within the range exhibited for
normally operating pairs of PMUs. For example, one
such region occurs in both plots between cycles 2700
and 3200. Finally, note that although the frequency
correlation in Figure 3b is slow to reach maximum
decorrelation, a period of early detection still occurs
before the correlation window fills with spoofed data
at cycle 2100.
6 CONCLUSION
With digital and communication technologies being
integrated in modern electrical grids, data integrity of
these smart grid systems have become increasingly
critical. Spoof attacks may result in severe power out-
ages in large areas. In this paper, we have proposed
a novel approach for addressing the challenge of de-
tecting spoofed data from phasor measurement units
(PMUs) on the smart grid. Our approach uses ma-
chine learning techniques and correlation coefficients
between measurement parameters of electrically close
PMUs and, because of the short latency times for de-
tection, is capable of supporting streaming data and
real-time spoof detection in a live setting. Two-class
support vector machines (SVMs) are trained using
both normal and spoofed PMU data. Nine spoofed
data models are derived using three different spoof-
ing playback schemes. The SVMs are evaluated us-
ing PMU data collected from Bonneville Power Ad-
ministration’s extensive PMU network. Experimental
results show the SVMs can effectively detect spoofed
signals; against the nine spoof data sets, results show
high sensitivities and F1 scores while concurrently
demonstrating low false discovery rates and reason-
able latencies.
For future work, we are generalizing this approach to
use one-class learning for detecting spoof signals that
(a) Mirroring (S1): Normalized Frequency Correlation
(b) Time Dilation x8/9 (S3.7): Normalized Frequency
Correlation
Figure 3: Frequency Correlations for all pairs of PMUs
prior to and during two distinct spoofs.
have not been seen before. In addition, we are investi-
gating online learning approaches to efficiently detect
spoof attacks in PMU streams in real time.
Fast Sequence Component Analysis for Attack Detection in Smart Grid
231

ACKNOWLEDGMENTS
This research is supported by student scholarships
from Oregon BEST and the Bonneville Power Ad-
ministration. We thank both Portland General Electric
and the Bonneville Power Administration for provid-
ing PMU data.
REFERENCES
Amor, N. B., Benferhat, S., and Elouedi, Z. (2004). Naive
bayes vs decision trees in intrusion detection systems.
In Proc. ACM Symp. Appl. Comput., pages 420–424.
ACM.
Bonebrake, C. and ONeil, L. (2014). Attacks on GPS time
reliability. IEEE Security Privacy, 12(3):82–84.
Chang, C.-C. and Lin, C.-J. (2011). Libsvm: A library for
support vector machines. ACM Trans. Intelligent Syst.
and Technol., 2(3):27.
Chen, T. and Abu-Nimeh, S. (2011). Lessons from stuxnet.
Computer, 44(4):91–93.
Cortes, C. and Vapnik, V. (1995). Support-vector networks.
Mach. Learn., 20(3):273–297.
De La Ree, J., Centeno, V., Thorp, J., and Phadke, A.
(2010). Synchronized phasor measurement applica-
tions in power systems. IEEE Trans. Smart Grid,
1(1):20–27.
Humphreys, T. (2009). Assessing the spoofing threat. GPS
World, 20(1):28–38.
IEEE (2006). IEEE standard for synchrophasors for power
syst. IEEE Std C37.118-2005, pages 1–57.
Jiang, X., Zhang, J., Harding, B., Makela, J., and
Dominguez-Garcia, A. (2013a). Spoofing gps re-
ceiver clock offset of phasor measurement units. IEEE
Trans. Power Syst., 28(3):3253–3262.
Jiang, X., Zhang, J., Harding, B. J., Makela, J. J., and
Dominguez-Garcia, A. D. (2013b). Spoofing GPS re-
ceiver clock offset of phasor measurement units. IEEE
Trans. Power Syst., 28(3):3253–3262.
Kher, S., Nutt, V., Dasgupta, D., Ali, H., and Mixon, P.
(2012). A detection model for anomalies in smart grid
with sensor network. In Future of Instrumentation Int.
Workshop, 2012, pages 1–4. IEEE.
Kim, J., Tong, L., and Thomas, R. J. (2014). Data framing
attack on state estimation. IEEE J. Sel. Areas Com-
mun., 32(7).
Kim, J., Tong, L., and Thomas, R. J. (2015). Subspace
method for data attack on state estimation: Data-
driven approach. IEEE Trans. Signal Process., 63(5).
Kushner, D. (2013). The real story of stuxnet. IEEE Spectr.,
50(3):48–53.
Langner, R. (2011). Stuxnet: Dissecting a cyberwarfare
weapon. IEEE Security Privacy, 9(3):49–51.
Magiera, J. and Katulski, R. (2013). Accuracy of differen-
tial phase delay estimation for gps spoofing detection.
In 36th Int. Conf. Telecommun. and Signal Process.,
pages 695–699.
Meier, R., Histand, M., Landford, J., McCamish, B., Chiu,
D., Bass, R., and Cotilla-Sanchez, E. (2014). Man-
aging PMU data sets with bitmap indexes. In IEEE
Conf. on Technol. for Sustain., Portland, OR.
Mitchell, R., Chen, I., et al. (2013). Effect of intrusion de-
tection and response on reliability of cyber physical
systems. IEEE Trans. Rel., 62(1):199–210.
Pedregosa, F., Varoquaux, G., Gramfort, A., Michel, V.,
Thirion, B., Grisel, O., Blondel, M., Prettenhofer, P.,
Weiss, R., Dubourg, V., Vanderplas, J., Passos, A.,
Cournapeau, D., Brucher, M., Perrot, M., and Duch-
esnay, E. (2011). Scikit-learn: Machine learning in
Python. J. Mach. Learn. Res., 12:2825–2830.
Petit, J., Feiri, M., and Kargl, F. (2011). Spoofed data de-
tection in vanets using dynamic thresholds. In IEEE
Vehicular Networking Conf., pages 25–32.
Phadke, A. (2002). Synchronized phasor measurements-a
historical overview. In IEEE PES Asia Pacific Trans-
mission and Distribution Conf. and Exhibition, vol-
ume 1, pages 476–479 vol.1.
Psiaki, M., O’Hanlon, B., Bhatti, J., Shepard, D., and
Humphreys, T. (2013). Gps spoofing detection via
dual-receiver correlation of military signals. IEEE
Trans. Aerosp. Electron. Syst., 49(4):2250–2267.
Shepard, D., Humphreys, T., and Fansler, A. (2012). Evalu-
ation of the vulnerability of phasor measurement units
to gps spoofing attacks. In Int. Conf. Critical Infras-
tructure Protection, Washington, DC, USA.
Steinmetz, C. P. (1893). Complex quantities and their use
in electrical engineering. In Proc. American Institute
of Electrical Engineers, pages 33–74, Chicago, IL.
Vu, K., Begovic, M., Novosel, D., and Saha, M. (1999). Use
of local measurements to estimate voltage-stability
margin. IEEE Trans. Power Syst., 14(3):1029–1035.
Warner, J. and Johnston, R. (2002). A simple demonstration
that the global positioning system (gps) is vulnerable
to spoofing. J. Security Admin., 25:19–28.
Zhang, Z., Gong, S., Li, H., Pei, C., Zeng, Q., and Jin, M.
(2011). Time stamp attack on wide area monitoring
system in smart grid. In Comput. Res. Repository.
Zhang, Z., S.Gong, A.D.Dimitrovski, and H.Li (2013).
Time synchronization attack in smart grid: Impact and
analysis. IEEE Trans. Smart Grid, 4(1):87–98.
SMARTGREENS 2016 - 5th International Conference on Smart Cities and Green ICT Systems
232
