
Application of Metrics for Risk Management in Environment of
Multiple Software Development Projects
Júlio Menezes Jr
1,2
, Miguel Wanderley
1,2
, Cristine Gusmão
1,3
and Hermano Moura
2
1
SABER Tecnologias Educacionais e Sociais Research Group, Federal University of Pernambuco,
Av. dos Reitores, s/n, Cidade Universitária, Recife, Pernambuco, Brazil
2
Centre of Informatics, Federal University of Pernambuco,
Av. Jornalista Anibal Fernandes, s/n, Cidade Universitária, Recife, Pernambuco, Brazil
3
Department of Biomedical Engineering, Centre of Technologies and Geociences, Federal University of Pernambuco,
Av. da Arquitetura, s/n, Recife, Pernambuco, Brazil
Keywords: Risk Management, Multiple Software Project Management.
Abstract: Multiple Project Management currently is a reality in software development environments. In the case of
software projects, some characteristics are highlighted, such as constant changes in levels of scope or product,
software complexity and aspects related to human resources, such as technical knowledge and experience,
among others. We may consider these characteristics as risk factors that should be managed. In this aspect, a
tactical management requires the usage of better-structured information, which leads us to think about the
usage of a metrics-based strategy as a support tool for multiple project managers with emphasis on risk factors.
In this context, this work presents an an application of the metric “Risk Points” and its variations in an
environment of multiple software development project. This experience report aims to evaluate the proposed
metrics as a decision-support tool and monitoring of risk during project life-cycle.
1 INTRODUCTION
Nowadays there is a consensus that, in software
engineering, if adverse factors are not well managed,
projects might fail. According to (The Standish
Group, 2013) only 39% of software projects are
completed on time and on budget. It is interesting to
notice that the most of causes of project fail occur due
to not managed risk factors. On the other hand, we
realize that risk management in software engineering
needs more practical and deep studies (Bannerman,
2014), allowing more concise identification of its
practices as well as improvement points.
Despite the recognized importance, in practice the
explicit risk management in software engineering is
still limited. One of the reasons for this scenario is
that risk is subjective in software projects. In this
light, one way to reduce the subjectivity bias is using
metrics, because it could be helpful to provide to the
stakeholders a better knowledge, control and
improvement of risk management processes adopted
on environment of multiple software projects. Also,
there is a clear gap about risk measurement in
software engineering (Menezes Jr et. al., 2013).
One of the related works presents a proposal of
metrics called “Risk Points” (Lopes, 2005), whose
object is to measure the risk level of a project in an
environment of multiple software development
projects. The central idea is to help managers in
decision-making for risk reduction, as well as to
analyze the effectiveness of actions to do that.
Therefore, this paper presents a pilot experience
of the Risk Point metrics application in a real
environment of software development. The main goal
is to evaluate the metrics and its effectiveness in an
environment of multiple software projects.
After this introductory section, the rest of this
paper is organized as follows: Section 2 brings and
briefly discusses some related works; Section 3
introduces the proposed metrics and it alternatives;
Sections 4 and 5 presents the experience report
objectives and methodology, respectively; Section 6
shows the results of the presented methodology; the
next section discusses these results. Finally, Section 7
presents final considerations and future work.
2 RELATED WORK
There are few references in software engineering
504
Jr., J., Wanderley, M., Gusmão, C. and Moura, H.
Application of Metrics for Risk Management in Environment of Multiple Software Development Projects.
In Proceedings of the 18th International Conference on Enterprise Information Systems (ICEIS 2016) - Volume 1, pages 504-511
ISBN: 978-989-758-187-8
Copyright
c
2016 by SCITEPRESS – Science and Technology Publications, Lda. All rights reserved

about the usage of metrics for project risk
management. Barry Boehm (Boehm, 1989) is
considered a pioneer in the application of risk
management in software engineering. He proposed a
software risk management framework focused on risk
analysis. The activity of risk analysis in his work is
defined as Risk Exposure calculation, which is
defined as the multiplication between Probability of
Risk versus Loss or Impact of Risk. This analysis is
only used for risk prioritization.
The work (Lopes, 2005) proposes a way of to
measure the risk level of a project through a metrics
called Risk Point. According to the author, the
objective of Risk point metrics is to define how risky
is a software project based on number of identified
risks and project complexity factors. We use this
metrics as one of the indicators for this dissertation.
However, the author did not evaluate Risk Point in
practice.
Another related work defines a quantitative
approach where risk concepts of economics,
specifically credit risk, are used to propose a method
of risk assessment in software projects (Costa, 2005).
In this work, the author proposes a way to calculate
how much capital a software development
organization can gain or lose due to the risks of a
selected set of projects. The adopted method allows
the selection of projects’ sets that seeks to maximize
the cost-benefit for an organization. The risk
assessment method uses project characterization
(size, duration cost and return) and a questionnaire to
identify risks. However, this method was not
evaluated in practice.
The use of the Goal-Question Metric paradigm to
define software process metrics with the goal of
monitoring risk factors is discussed on (Fontoura and
Price, 2004). On the other hand, the proposal was not
put in practice.
Some works used metrics for technical risks using
Risk-Based Testing concept (RBT) (Amland, 2000)
(Souza et al, 2009). The objective of the metrics is to
indicate information regarding test cases control
through risk analysis and monitoring of system
requirements. However, these metrics are not
proposed as a tool for management of projects,
providing only product risk view based on system
requirements, architecture and coding analysis.
Another related work discusses the need of the
usage of metrics for risk management, and shows
examples of how they can be used (Bechtold, 1997).
For example, a risk factor related to team
qualification – experience and knowledge level on
certain technology. Hence, it is a data that could be
quantified and followed through project life cycle. On
the other hand, this paper does not present any
practical application or assessment.
This paper approaches the evolution of the
proposal presented by (Lopes, 2005) because it shows
a proposal of a metrics – Risk point, whose goal is to
measure risks in the context of multiple project
software management as support tool for project
managers. Therefore, the rest of this paper presents
Risk Point metrics in details as well as proposes
improvements and previous assessment in a real
environment.
3 RISK POINT METRICS
The Risk Point (RP) metric aims to represent the
overall risk exposure level of a project (Lopes, 2005).
Basically, the metric is defined in terms of the amount
of identified risks, where these risks are defined in
terms of its probability and estimated impact, as the
concept of Risk Exposure (RE) (Selby, 2007).
RP allows quantifying the project in terms of its
identified risks. It is necessary to estimate the Risk
Exposure value, i.e. Probability versus Impact, for
each identified risk, so, for a specific data collection
about the current risks of a project, it is possible to
determine a value of Risk Point (RP), as follows:
= ×
Where, PCF means the Project Characteristics
Factor and URPW means Unadjusted Risk Point
Weight. PCF is a value for giving the project a weight
and adjust the metric final value based on technical
and environmental factors (Coelho, 2003). This value
is defined through the answers of a questionnaire,
which was developed from an empirical study with
software project managers and management students,
as mentioned. Then, PCF is defined as:
= 1.05 + (0.015×)
= (
×ℎ
)
CF means Characteristic Factor, it is
determined by answering the 8 questions of a
questionnaire with scores between 0 and 4, and then
this answer is multiplied by the defined weighted
value for each question. Finally, these 8 products are
summed, resulting in the CF value (Coelho, 2003).
URPW is the Unadjusted Risk Point Weight,
composed by the identified risks during a data
collection, in terms of their Risk Exposure. In this
study, the estimation adopted was values in {0.1, 0.2,
… , 0.9}.
Application of Metrics for Risk Management in Environment of Multiple Software Development Projects
505
The Unadjusted Risk Point Weight (URPW)
value is formed by the summation of the Weights of
each identified risk, being this Weight defined
according the Risk Exposure value, as can be seen in
the following table.
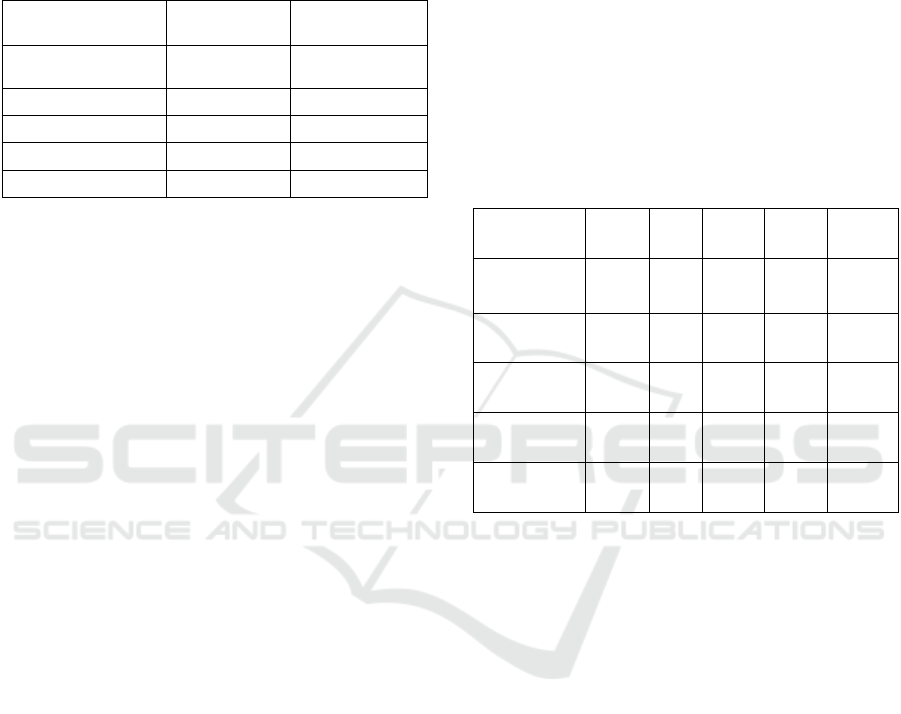
Table 1: Unadjusted Risk Point Weight (URPW) values.
Classification RE(Risk) Weight(Risk)
Very Low [0.0, 0.2) 1
Low [0.2, 0.4) 2
Average [0.4, 0.6) 3
High [0.6, 0.8) 4
Very High [0.8, 1.0] 5
Thus, for n identified risks, the URPW value
follows the rule:
=ℎ(
)| =
Briefly, a given data collection (even in a
subjective way, with values in a 5 levels scale for
Probability and Impact) about the current risks of a
project yields a value which represents the overall
evaluation concerning the known risks of a project in
a specific moment in its life cycle. This value allows
a broad risk assessment about the risk exposure level
of a project in different moments, and also allows a
way to compare between different projects based on
their identified risks.
3.1 Alternative Metrics
Just changing the weights for the Risk Exposures
classification, showed in Table 1, new alternative
metrics were defined. Note that by changing the
weights values we can create many other metrics, but
the ones presented in this paper focus on the concept,
taken as the most important, inside these changes.
Pure Risk Point (PRP). In this alternative metric, all
the weights from URPW are defined as 1. Therefore,
the URPW value composition becomes a simple
summation of all identified risks, without
distinguishing the different Risk Exposure values of
each risk. PRP metrics prioritize the assessment of the
number of different risks identified during some data
collection.
Exponential Risk Point (ERP). This metric presents
the weights from URPW in a base 2 exponential
growth, i.e. {1,2,4,8,16}. Therefore, ERP is even
higher for the highest occurrences of Risk Exposure
levels. The URPW receives higher values for
“Average” or upper levels of Risk Exposure.
Therefore, this metrics is more sensitive for high risk
exposures levels.
Criticality (CRIT). It is represented by the
difference ERP – RP. Therefore, the difference is
only visible when the risk exposure levels are defined
as medium, high and very high. CRIT is defined as:
=ERP–
P
This metrics reveals the risks for high values,
taking into consideration only the most critical risks
in an assessment. Finally, for better understanding of
the differences between the proposed metrics, the
Table 2 presents the weights defined for each metrics.
Table 2: Weight values of each metrics.
Classification
RE
(Risk)
W
(RP)
W
(PRP)
W
(ERP)
W
(CRIT)
Very low [0.0,
0.2]
1 1 1 0
Low [0.2,
0.4]
2 1 2 0
Medium [0.4,
0.6]
3 1 4 1
High [0.6,
0.8]
4 1 8 4
Very high [0.8,
1.0]
5 1 16 11
W = Weight of the risk according do Risk Exposure (RE)
calculation to URPW.
The main difference between the metrics is
basically the weight given to each identified risk: RP
uses a sequential scale; PRP basically counts the
number of risks; ERP highlights the difference for
high level of risks and, finally, CRIT only considers
risks factors with medium or higher levels.
Adjusted Metrics. It is possible to observe projects
with different number of risks in the same
environment. To allow comparison between projects,
in this work we divided the metrics by the number of
identified risks:
AdjustedMetrics=Metrics/Numberofidentifiedrisks
With this adjustment, it is possible to evaluate
directly the values of the metrics, independently of
the number of identified risks of each project.
4 OBJECTIVE
The main objective of this work is to evaluate the
applicability of the proposed metrics and their
ICEIS 2016 - 18th International Conference on Enterprise Information Systems
506

effectiveness in risk assessment in an environment of
multiple software projects. To do so, each week
information about risks were collected in five projects
in the same environment. For each project, risk
factors were identified and analyzed using predefined
scales of probability and impact of each risk. Next
sections present the methodology and results of the
experience report.
5 METHODOLOGY
To execute the study, we used an agile risk
management process called GARA (Ribeiro et al,
2009), consistent with agile development
methodologies, such as Scrum, focused to multiple
projects and simple enough for the risk management
activities, such as the data collecting. The metrics
were applied in a software development environment
from a research laboratory at Federal University of
Pernambuco (UFPE) specialized in educational
technologies, in which weekly data collecting of
information about risks were performed during 2
months. All the projects involve software applications
on educational technologies.
Five projects were monitored between May 2015
and July 2015 together with their leaders. The
projects are related to software development like web
platforms – front and back-end, web services and
mobile application. The following steps were
executed:
1. Risk Identification: through a combination of
brainstorming and the Risk Taxonomy from
Software Engineering Institute (Carr et al,
1993). Additionally, project characterization
factors were valued.
2. Risk Assessment: for each identified risks,
values of probability and impact are
calculated. For this work, we adopted the
following values:
Table 3: Values of probability and impact used.
Name Value
Very low 0.1
Low 0.3
Medium 0.5
High 0.7
Very high 0.9
3. Data Processing: with the raised information,
the identified risks are categorized as from
project and from environment. In this work
project risks appear on only single project and
environment risks appear on more than one
project. With the collected information in the
previous steps, the metrics calculation is
made.
4. Risk Controlling and Monitoring: consists
on the following-up of risk levels evolution of
each project.
It is important to notice that the steps were
performed weekly. Below we present some
information about each project used in this study –
description main product, number of participants and
duration:
Project 1: web system to support to students’
subscription in post-graduation and extension
courses, including management of data and reports
generation.
• Product: system information in web platform,
front-end and back-end.
• Teams: software development (2) and design
(3).
• Duration: 6 months
Project 2: system information for management of
academic works, including term papers for
undergraduate and graduate courses. This project has
3 important sub products: term paper elaboration and
discussion forum, management reports and CRUDs
requirements.
• Product: system information in web platform,
front-end and back-end.
• Teams: software development (3) and design (3).
• Duration: 10 months.
Project 3: mobile system to access to educational
contents about healthcare stored in external
repositories. The system demands an external
authentication server and the server side of the system
is developed by another institution.
• Product: mobile application developed with
Android platform.
• Teams: mobile development (4) and design (3).
• Duration: 12 months
Project 4: support-components for a distance course
about primary healthcare, that includes virtual
learning environment and a web portal.
• Product: web portal for access to the course,
front-end, including visual and usability
adjustments.
• Teams: web design (4), design (3) and virtual
learning environment (1).
• Duration: 3 months.
Application of Metrics for Risk Management in Environment of Multiple Software Development Projects
507
Project 5: development of a system information,
whose goal is to evaluate students present in
educational platforms (Moodle) and management of
them.
• Product: system information in web platform,
front-end and back-end.
• Teams: web design (4), design (3) and virtual
learning environment (1).
• Duration: 5 months.
6 RESULTS
During eight data collectings, the presented
methodology were applied. Table 4 summarize
results about number of identified risks.
Table 4: General results.
Total of identified risks 31
Total of Risk Exposure Mean 0.14
Number of identified risks – Project 1 30
Number of identified risks – Project 2 30
Number of identified risks – Project 3 22
Number of identified risks – Project 4 25
Number of identified risks – Project 5 26
Therefore, 31 different risks were identified in
five projects. Considering the mean of Risk Exposure
(Probability (risk) * Impact (risk)), most of the
identified risks has low value. Table 5 presents the top
ten risks from the environment, i.e, the ones with
highest risk exposure value (average).
Its important to notice that the project leader is the
responsible to valuate probability and impact
according to information present on Table 1.
Table 5: Top ten risks.
Risk
Average Risk
Exposure
Failures on deployment 0,25
Dependences of other teams 0.22
Dependence of specialists 0.22
Urgent demands, new
demands raises
0.20
Conflicts with external
activities of team members
0.20
Requirements changes 0.18
Team member absence 0.16
Team member unavailability 0.16
Exit of team member 0.16
Software testing process
problems
016
For each project, all the identified risks (for
respective risk exposure values) are synthetized in
one single value. Therefore, the idea is to represent
the overall risk level of each project in a specific
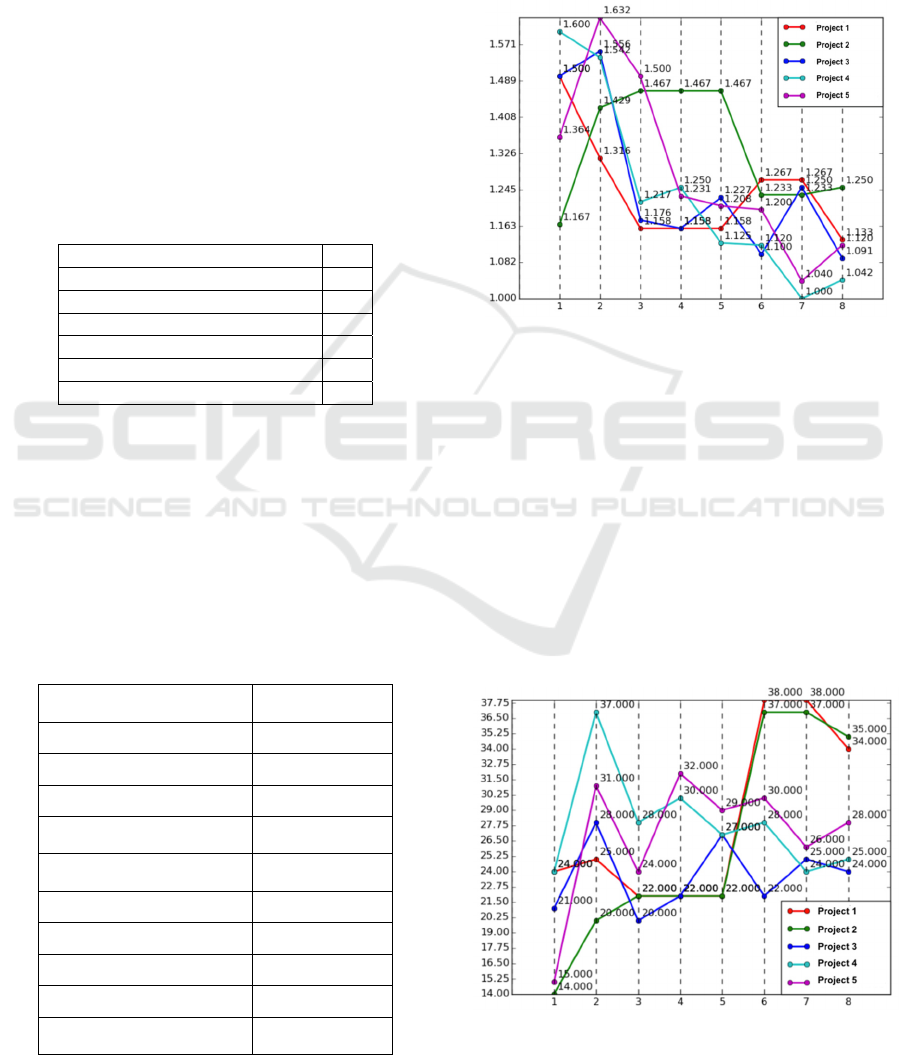
moment. Figure 1, for example, presents the results of
the application of Risk Points/Number of identified
risks. X axis represents the number of weeks, whereas
Y axis represents the metrics value.
Figure 1: Risk Points / Number of risks.
Considering Risk Points metrics application, we
can assume that, after 8 weeks, the Project 2 is the
riskier one in the environment, whereas the Project 4
has presented a high level of decrease.
Figure 2 presents the application of the metrics
Pure Risk Points (PRP). As mentioned before, this
metrics just represents the number of identified risks
of each project.
It is important to mention that the variation of
values in Figure 2 does not necessarily mean that new
risks arose or they were removed from the risk list. It
just represents the risks in which the calculation of
risk exposure was made.
Figure 2: Pure Risk Points (PRP).
ICEIS 2016 - 18th International Conference on Enterprise Information Systems
508
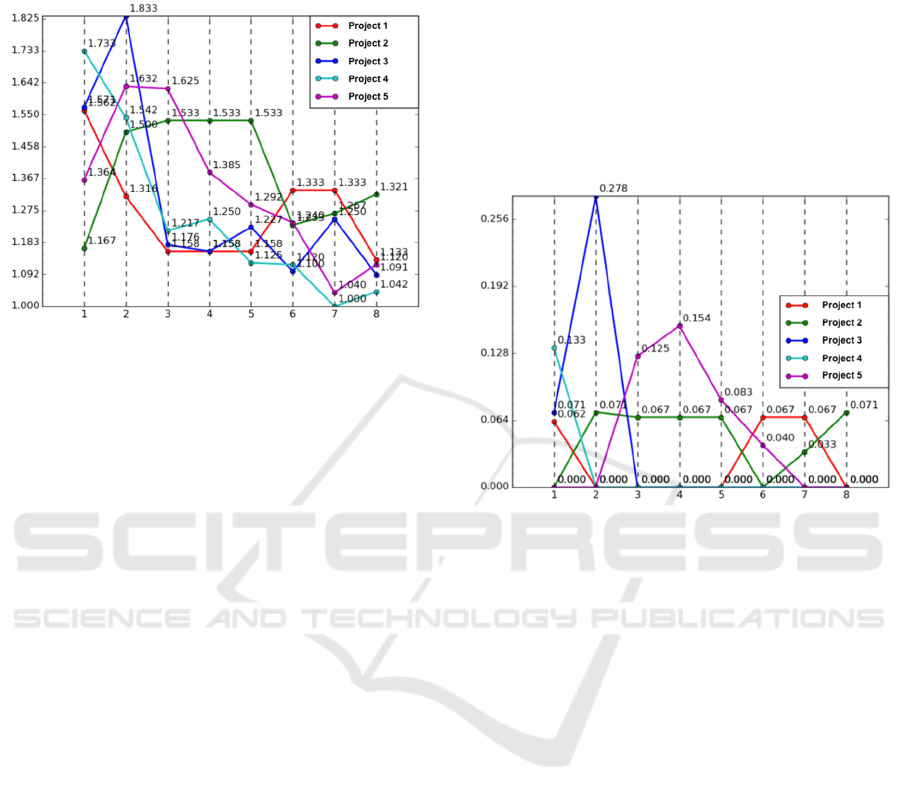
The application of Exponential Risk Point
(ERP)/Number of identified risks is presented in the
Figure 3.
Figure 3: Exponential Risk Points (ERP) / Number of
identified risks.
We can realize that the behavior of the Figure 3 is
similar to the presented in the Figure 1. It happens
because the differences between the metrics ERP e
RP are noted only to the highest risk exposure value
– between medium and very high.
The Project 1 was close to the end, so that it
presented a considerable risk level in the last weeks.
Before that, this project had a successful delivery.
The data collecting of the Project 2 started when
it was beginning a new development cycle after an
important milestone. At that moment, requirements
have been risen and new demands have been grown.
After the 5
th
week, the requirements were well
defined, so that the risk level decreased. Even though
this event, this project was considered as the riskier in
the environment after eight weeks.
In the first month of data collecting, the Project 3
delivered an important release, that justifies the
decrease of risk level during this period of time. In the
second month, the team got test results with new
requirements, adjustments and bugs to be fixed. It can
explain the oscillation that happened in the second
month of this project.
The Project 4 started as the riskier project and
finished with the less risky one. The schedule of this
project was relatively short, and it is similar to others
that were finished and it was close to the end. In fact,
this project was considered successful and did not
present problems during its life-cycle.
Project 5 also was being finished. It presented a
decrease during the period of assessment, just waiting
for assessment, feedback and final approval of the
testers.
In general, we realized that, after an important
milestone, the risk level presents accentuate decrease.
After the feedback, bugs identification and
adjustments on the scope, the values start to grown
and remains increasing until the next milestone or
delivery of a release.
As explained before, to show the difference
between RP and ERP, we used the metrics Criticality
(CRIT). Figure 4 shows the moments in which the
projects are presenting the most critical levels, i.e.,
with risk exposure level equal or greater than 0.5.
Figure 4: Criticality (CRIT) / Number of risks.
In the beginning of the study, the Project 4 presented
the highest level of criticality and its value reduced to
zero till the 8
th
week. In fact, this project had a relatively
short schedule and it was finishing successfully, just
waiting a final evaluation before the system deployment.
Project 2 was considered the most critical and
riskier. It means that there were risks classified as
medium or higher value. In the 8
th
week the project
was close to an important release.
Project 5 was delivering a release and it was close to
the end. The main functionalities were finished as it was
agreed and it was just waiting a final feedback from a
acceptance test. According to the leader of this project,
the presented values were pertinent once it was really
facing a critical phase between the third and sixth week.
Finally, the high value in the second week of the
Project 3 was expected, once at that moment an important
deliver was being finished. But the high difference
between the others values needs a deeper investigation,
because it can be a bias of the project leader.
7 DISCUSSIONS
An important characteristic identified in this work is:
most of identified risks are classified as very low or
Application of Metrics for Risk Management in Environment of Multiple Software Development Projects
509

low. The impact of this in the metrics is the fact that
the risks with high values are not well explored, even
using ERP metrics. The low values of the metrics
CRIT also shows this behavior.
Another point to be considered is that the
processed values of the metrics presents two
information: (i) it determines the risk level of a
project with an only single value in a certain moment
regarding the number identified risks; (ii) the
experience and knowledge of each project leader and
their respective skill to estimate the risks. Both
information is crucial for a better comprehension of
the context of the metrics application, because
different people can perform different estimations in
the same project. Therefore, the subjectivity bias still
has to be taken into consideration, but the experience
level of the project leader may be important to reduce
it.
The risk list used was built using information
given by project leaders during the first weeks. To
guide the process of risk identification, we used the
risk taxonomy of SEI (Carr et al, 1993), but only to
make the brainstorming more focused. We did not
used a predetermined risk list. Therefore, there is no
evidence that the identified risks are the main ones of
each project and from the environment. It also means
that the metrics values are an estimation of the general
level of project risk exposure.
8 CONCLUSIONS
This paper presented an experience report of the
usage of the metrics Risk Points (Lopes, 2005) and
proposed alternatives metrics in a real environment of
software development projects. Next subsections
bring main contributions, limitations and future
opportunities of research.
8.1 Main Contributions
The main positive points of the proposed metrics
show that they are capable to tell us, in only one single
value, the general level of a software project risk
exposure in a certain moment. Second, the metrics
allows an assessment in environments of multiple
projects, providing direct and indirect comparisons
between different projects through their life-cycle.
The main negative point about the metrics is their
sensitivity to experience level of the project manager
and the accuracy level of them. In other words, the
same project may have different values in the same
moment when it is assessed by more than one person.
This work did weekly data gathering through
online tools and meetings. At the end of the study, the
project leaders made an assessment of the process and
its effectiveness to improve knowledge about the
projects risks. In general, the project leaders
considered the study important for the process of
project risk management.
In the first month of the study, all the data
collection was face-to-face. This approach was
efficient for the understanding of the projects, risk
factors and, mainly, to make the process clearer. All
the project leaders said that the presence of a risk
manager is important to conduct risk identification
and to make better estimations. However, this kind of
meeting could be expensive, because demands more
face-to-face meetings with approximately one hour of
duration.
In the second month (last four gatherings), we
applied an online questionnaire with the managers.
The positive point of this approach was the flexibility
and agility. However, we observed difficulties to
assure that the project leaders answer the
questionnaires on time.
One proposal for the process could be an
intermediate approach, using both online and face-to-
face in order to take advantage of the positive points
of each one, using alternate iterations.
8.2 Future Work
Main directions for this work are to apply other case
studies with some adjustments:
• Replicate the study for more projects during
more time. Therefore, we can follow the
behavior and identify noises and point of
improvements;
• Analyze the main actions to mitigate levels of
risks, taking it into consideration during the
project life-cycle;
• Take into consideration the level of experience
of the project manager/leader. It can be a value
that may compose the metrics;
• Identify risk factors that are common in
software projects. The idea is to work with a
predetermined risk list to allow a better
comparison between projects in the same
environment;
• Perform research about the usage of
knowledge base of risks, combining with the
data collected, in order to predict risks for new
projects.
ICEIS 2016 - 18th International Conference on Enterprise Information Systems
510

ACKNOWLEDGEMENTS
The authors would like to thank SABER Tecnologias
Educacionais e Sociais research group for the whole
support to develop this work.
REFERENCES
Amland, S., 2000, Risk-based testing: Risk analysis
fundamentals and metrics for software testing including
a financial application case study, J. Syst. Softw., vol.
53, pp. 287–295.
Bannerman, P. L., 2014, A Reassessment of Risk
Management in Software Projects. v. 2, p. 1119–1134.
Bechtold, R., 1997, Managing risks with metrics, A term
paper for MJY Team Software Risk Management WWW
Site.
Boehm, B.W., 1989, Software Risk Management, Lect.
Notes Comput. Sci., vol. 387, p. pp 1–19.
Boehm, B., de Marco, T., 1997, Software risk management.
IEEE Software, v. 14, n. 3, p. 17-19.
Carr, M., Konda, S., Monarch, I., Ulrich, F., Walker, C.,
1993, Taxonomy Based Risk Identification. Software
Engineering Institute, Carnegie Mellon University,
USA.
Coelho, C., 2003, MAPS: Um Modelo de Adaptação de
Processos de Software. Master dissertation in
Computer Science. Universidade Federal de
Pernambuco, Recife, Brazil.
Costa, H., 2005, Uma Abordagem Econômica Baseada em
Riscos para Avaliação de uma Carteira de Projetos de
Software. Master dissertation. PESC/COPPE/UFRJ,
Rio de Janeiro, Brazil.
Fontoura, L., Price, R., 2004, Usando GQM para Gerenciar
Riscos em Projetos de Software. 18º Simpósio
Brasileiro de Engenharia de Software – SBQS P. 39 –
54.
Freitas, B., Moura, H., 2004, GMP: Uma Ferramenta para
a Gestão de Múltiplos Projetos. In: Simpósio Brasileiro
de Sistemas de Informação – SBSI.
Gusmão, C., Moura, H., 2005, Gestão de Riscos para
Ambientes de Múltiplos Projetos de Software: Teoria e
Prática. IV Escola Regional de Informática de Minas
Gerais - IV ERI MG, Belo Horizonte, Brazil.
Lopes, S., 2005, Análise e definição de métricas para o
processo de gerência de riscos para projetos de
software. Graduation work. Centro de Informática.
Universidade Federal de Pernambuco. Recife. Brazil.
Menezes Jr., J.V., Gusmão, C. M. G., Moura, H. P., 2013,
Defining Indicators for Risk Assessment in Software
Development Projects. CLEI Electronic Journal, v. 16,
p. 1-24.
Pressman, R., 2006, Engenharia de Software. 6th edition.
São Paulo: McGraw-Hill.
Ribeiro, L., Gusmão, C., Feijo, W., Bezerra, V., 2009, A
case study for the implementation of an agile risk
management process in multiple projects environments,
Management of Engineering & Technology, 2009.
PICMET 2009. Portland International Conference,
pp.1396,1404.
Selby, R.W., 2007, Software Engineering: Barry W.
Boehm's Lifetime Contributions to Software
Development, Management, and Research, John Wiley
& Sons.
Souza, E., Gusmão, C., Alves, K, Venâncio, J., Melo, R.,
2009, Measurement and control for risk-based test
cases and activities. 10th Latin American Test
Workshop, LATW.
The Standish Group, 2013, "Chaos Manifesto 2013."
Available at http://www.versionone.com/assets/img/fil
es/CHAOSManifesto2013.pdf.
Wysocki, R., 2011, Effective Project Management:
Traditional, Agile, Extreme. Wiley; 6 edition.
Application of Metrics for Risk Management in Environment of Multiple Software Development Projects
511
