
Development and Application in Clinical Routine of Computer Aided
Detection (CAD) Algorithms for the Identification of Pulmonary Nodules
Alberto Traverso
1,2,3
1
Department of Applied Science and Technology, Polytechnic University of Turin, Turin, Italy
2
Turin Section of INFN, Turin, Italy
3
Diagnostic Image Analysis Group, Radboud UMC, Nijmegen, The Netherlands
1 RESEARCH PROBLEM
Lung Cancer is one of the main public health issues
in developed countries, accounting for about 19%
and 28% of cancer-related deaths in Europe (Fer-
lay et al., 2010) and the United States of America
(Jemal et al., 2009), respectively, with a five-year
survival rate of only 10-16% (Jemal et al., 2010).
Computed Tomography (CT) has been shown to be
the most sensitive imaging modality for the detec-
tion of small pulmonary nodules: low dose high res-
olution CT-based screening trials are regarded as a
promising technique for detecting early-stage lung
cancers (Team et al., 2011). The identification of
early stage pathological Regions of Interests (ROIs)
in low dose high resolution CT scans is a very diffi-
cult and time consuming task for radiologists, because
of the large number (300/500) of noisy 2D slices to
be analyzed. In order to support radiologists, re-
searchers have started developing CAD algorithms to
be applied to CT scans. Several studies (Das et al.,
2006)(Brochu et al., 2007)(Matsumoto et al., 2008)
reported an improvement in the sensitivity of radiol-
ogists when assisted by CAD systems (Awai et al.,
2004). In addition, CAD systems act as detection
rates equalizers between observers of different level
of experience (Brown et al., 2005). Currently, the
usage of CAD inside clinical diagnostic routine has
not been a common and widespread practice yet. So
far, the most common way to make CAD algorithms
available in the clinical routine of health facilities is
the deployment of standalone workstations, usually
equipped with a vendor-dependent Graphic User In-
terface (GUI). This approach presents several draw-
backs, such as the high fixed cost of the software li-
censes, hardware and the obsolescence of both. Fur-
thermore, the computational power required by CAD
algorithms is often very high (increasing with the
complexity of the algorithms), often requiring power-
ful and expensive hardware. The emerging of Cloud
Computing solutions, accessible via secure Web pro-
tocols, solves almost all the previous issues. Further-
more, a solution pointing toward cloud computing fa-
cilities provides the possibility of combining several
CADs, with demonstrated benefits to the overall per-
formance (van Ginneken et al., 2010). I started my
PHD project inside the Magic5 group coordinated by
the Turin Section of INFN. This group is aiming at:
• Developing, validating and optimizing CAD algo-
rithms for the automatic detection of pulmonary
nodules in chest CT scans.
• Spreading the usage of CAD inside clinical rou-
tine, making CAD algorithms available without
requiring the users to install any kind of additional
software/hardware.
• Studying the impact of CAD algorithms on the
performance of radiologists in clinical practice.
During my PHD I have also started an internship
within the DIAG (Diagnostic Image Analysis Group)
inside the Radiology Department of the Radboud Uni-
versity Medical Center in Nijmegen (NL). Part of the
group is currently working to develop algorithms for
the automatic detection and assessment of pulmonary
nodules (and other diseases) in chest CT scans.
2 OUTLINE OF OBJECTIVES
In this section we intend to provide a detailed descrip-
tion of the objectives briefly enumerated in 1. We dis-
cuss each of these topics in dedicated subsections.
2.1 Development, Validation and
Optimization of CAD Algorithms
As mentioned in 1, researchers have started develop-
ing CAD algorithms for the automatic detection of
pulmonary nodules in chest CT scans. We believe
that a very big challenge for CAD algorithms will be
the capability not only to find pulmonary nodules, but
being able to assess something about the malignancy
24
Traverso, A.
Development and Application in Clinical Routine of Computer Aided Detection (CAD) Algorithms for the Identification of Pulmonary Nodules.
In Doctoral Consortium (DCBIOSTEC 2016), pages 24-34

of the nodules. In order to achieve this goal, CAD
algorithms should be able to identify and compute
some features of the nodules: among them, the vol-
ume is one of the most important. It has been shown
(MacMahon et al., 2005) that the growing rate of the
volume of a nodule can be a potential indicator of
malignancy. Usually, this growing rate is computed
considering the ratio between the volume of a nod-
ule among two different temporal scans of the same
patient. Despite this intuitive definition, the task rep-
resents a really challenge. In fact, the computation of
the volume of a nodule passes through two fundamen-
tal steps:
• The registration (i.e the alignment of anatomi-
cal structures) between the two scans in order to
avoid systematical errors due to different acquisi-
tion protocols.
• The delineation of the 3D contour of the nodule,
usually referred as segmentation.
Preliminary objectives for the computation of the vol-
ume are, indeed:
• Developing a robust system for the automatic reg-
istration of two different CT scans of the same pa-
tient.
• Developing a robust system for the 3D automatic
segmentation of pulmonary nodules.
Considering that segmentation is mandatory for the
computation of the 3D volume, we also would like to
consider the possibility to develop a tool for the in-
teractive semi-automatic segmentation or for manual
segmentation. The first case is needed when the re-
sult of the automatic segmentation is not satisfactory
for the user. With a minimum user interaction (like
drawing some boundaries of the nodule in 2D) the
user can re-initialize the automatic algorithms. The
second case is needed when the automatic segmenta-
tion totally fails and will allow the user to manually
segment the nodule. We will present some method-
ological approaches to develop these solutions in 4.
2.2 Spreading the Usage of CAD in
Clinical Practice
As mentioned in 1, the common approach so far is
to provide stand-alone workstation with pre-installed
CAD software, usually running on a proprietary oper-
ating system. We believe that this approach can really
represent a big issue for the diffusion of CAD algo-
rithm inside clinical structures due to these following
reasons:
• High fixed cost of license for the software instal-
lation.
• Strict requirements for software (e.g. specific op-
erating system) or hardware installation (usually
the computational power required is increasing as
the complexity of the algorithm increases).
• Difficulty to share CAD results among radiolo-
gists belonging to different institutions.
Our main objective is to propose a new approach
for the usage of CAD algorithms in clinical routine
without necessarily:
• Requiring user to install dedicated software.
• Requiring user to buy additional hardware for
CAD computations.
The first goal can be achieved adopting a SaaS (Soft-
ware As A Service) approach. SaaS is a software dis-
tribution model in which applications are hosted by a
vendor or service provider and made available to cus-
tomers over a network, typically the Internet. In order
to adopt a SaaS approach these preliminary objectives
have to be reached:
• Developing a dedicated web-fronted for the sub-
mission of chest CT scans for CAD analysis and
the access to CAD results.
• Considering the possibility to allow the radiolo-
gist to insert medical annotations and review them
according to CAD results directly on-line.
The second goal can be reached adopting an Infras-
tructure As A Service (IaaS) approach. Infrastructure
as a Service (IaaS) is a form of cloud computing that
provides virtualized computing resources over the In-
ternet. IaaS platforms offer highly scalable resources
that can be adjusted on-demand. In order to adopt a
IaaS approach these preliminary objectives have to be
reached:
• Developing a cloud back-end to handle the part of
the computation of the algorithms.
• Creating a system in which computing resources
(i.e. virtual machines) are created according to the
required computational power.
The combination of both the SaaS and IaaS seems
to be a very promising solution for the sharing of
CAD algorithms in clinical facilities. Furthermore,
the IaaS approach allows to easily combining differ-
ent CAD algorithms with no particular effort. It has
been proved (van Ginneken, 2010) that the combina-
tion of several CAD algorithm increases the overall
performance of the detection.
2.3 Studying the Impact of CAD in
Clinical Practice
As mentioned in 1, several studies showed the benefit
given by the usage of CAD as support for radiolo-
Development and Application in Clinical Routine of Computer Aided Detection (CAD) Algorithms for the Identification of Pulmonary
Nodules
25

gists in lung cancer detection. Despite these results,
we are still far from a common usage of CAD inside
clinical routine. Most of CAD algorithms have been
validated using data-set coming from screening cam-
paigns. On the contrary, there are few works which
validated CAD algorithms on a clinical data-set (no
more than few hundred of nodules). We believe that
an important factor for the usage of CAD systems in-
side clinical routine we will be a detailed validation
of these algorithms with CT scans from oncological
patients undergoing staging or re-staging in hospital
structures. CAD algorithms can be inserted in medi-
cal diagnosis in three different ways:
• Second-reader mode: the radiologist reads the CT
scan first without knowledge of the CAD findings.
In a subsequent step he/she reviews the findings of
CAD and decides if each CAD marking highlights
a previously overlooked lesion or a false-positive
finding.
• Concurrent-reader mode: the radiologist reads the
CT scan, and the CAD findings are displayed si-
multaneously. The radiologist can accept or reject
the CAD findings and combine them with his/her
own findings without the necessity of a second
reading step.
• First-reader mode: after pre-selection by the CAD
system only the slices with CAD findings are pre-
sented to the radiologist
In order to increase the usage of CAD in clinical prac-
tice we believe the following as mandatory objectives
to be reached:
• Increasing sensitively the data-set used by previ-
ous studies from few hundred to some thousands.
• Performing observer studies to investigate the im-
pact of CAD in clinical practice on oncological
patients undergoing staging or re-staging.
Furthermore, the possibility to collect a data-base
of annotated clinical data offers the great possibility
to perform further clinical studies, such as the val-
idation of malignancy prediction models. In addi-
tion, considering that most of available studies have
been performed using the CAD as second-reader, we
also would like to investigate the usage of CAD as
concurrent-reader and compare the two approaches.
3 STATE OF THE ART
In this section we present, for each of the subsec-
tions enumerated in 2, available literature and previ-
ous works. We also try to highlight possible points of
development and improvement.
3.1 Development and Optimization of
CAD Algorithms
In the first part we present a CAD algorithm devel-
oped inside the Magic5 project, discussing briefly the
main features and the result of the validation. In the
second part we present the CAD workstation devel-
oped by the DIAG group, focusing on the algorithms
for the segmentation of pulmonary nodules.
3.1.1 The M5L CAD
M5L is the combination of two independent CAD
sub-systems: the Channeler Ant Model (CAM) and
the Voxel-Based Neural Approach (VBNA). These
two algorithms have a common start line, which is
the parenchyma volume segmentation using a 3D re-
gion growing algorithm, which produces the separa-
tion of trachea, bronchi and lungs (De Nunzio et al.,
2011). The CAM CAD algorithm is based on the
reproduction of the life-cycle of colonies of virtual
ants (Cerello et al., 2008). CT voxel intensity is in-
terpreted as the amount of food available to the ants,
which progressively is reduced by the feeding of the
ants. The output of this stage is a pheromone map.
The pheromone map is a collection of segmented ob-
jects, each object gets classified using 13 different
features and a feed-forward artificial neural network
performs classification. The algorithm has the capa-
bility to reveal both pleural nodules and nodules in-
side the lung parenchyma. The VBNA CAD uses
two basically different procedures to detect nodules
inside the lung parenchyma (CADI) (Li et al., 2003;
Retico et al., 2008) and nodules attached to the pleura
(CADJP) (Retico et al., 2009). Before combining the
results of the two procedures there is an additional
step aiming at reducing the number of false positives
using a Supporting Vector Machine. The results, com-
bined as described in (Torres et al., 2015), have been
evaluated in terms of FROC (Free Response Receiver
Operating) curves. The M5L sensitivity at 8FP/scan
reaches 80% which, given the size and heterogene-
ity of the data-set, is quite satisfactory remarkable.
We believe that an interesting point of development
of the M5L CAD is the possibility to allow the user
to compare baseline and follow-up scans
1
of the same
patient. The idea is to perform longitudinal analysis
studies, i.e. the study of the evolution of the volume
of the nodule as a function of time in order to assess
something about the growing rate of a nodule and re-
late it to its malignancy.
1
A baseline scan is the first scan taken by a patient.
Follow-up scans refer to next scans of the same patient.
DCBIOSTEC 2016 - Doctoral Consortium on Biomedical Engineering Systems and Technologies
26

3.1.2 Cirrus Lung Workstation
CirrusLung is a flexible workstation for a quick and
effective extraction of quantitative imaging parame-
ters related to COPD, lung cancer and TB (B. et al.,
2013). The workstation loads an arbitrary number
of CT and chest radiography studies of each subject
simultaneously, allowing the user to instantly track
the evolution of any lesion. Each CT scan is elasti-
cally registered to all prior CT scans of the same sub-
ject. CIRRUS Lung workstation has been developed
jointly by the Diagnostic Image Analysis Group, Rad-
boud University Nijmegen Medical Centre, Nijmegen
The Netherlands, and Fraunhofer MEVIS, Bremen,
Germany. It is based on the MeVisLab software plat-
form. This work-station is a software which can be in-
stalled on PCs with a Windows operating system con-
figuration. The algorithm for the automatic segmenta-
tion of pulmonary nodules performs quite well, with
good results for all kind of nodules (solid, part solid
and non-solid) (Lassen et al., 2015). However, some-
times there can be cases, especially for very subtle
nodules, where the user cannot agree totally with the
proposed segmentation and would like to correct the
segmentation with few interactions through a semi-
automatic segmentation tool. This feature is manda-
tory when reaching the goal to built a complete clin-
ical workstation which allows the user to directly in-
teract, within an intuitive interface, with the automatic
algorithms (such as, for example, the possibility to
manually tune some of their parameters).
3.2 Spreading the Usage of CAD in
Clinical Practice
In the past, there have been some attempts to use an
approach similar to the GRID infrastructure used in
high energy physics to overcome problems related to
the spreading of CAD in clinical practice (Bellotti
et al., 2007)(Lamanna, 2004). The main issue with
GRID computing is the rigidity, complexity of the
structure and the man power required to manage the
system. Furthermore, this solution does not fit the
majority of Medical Physics projects, that require a
custom environment. For previous reasons, the use
of Cloud Computing solutions is progressively grow-
ing (Mell and Grance, 2011). Most of these works
where focused on providing computing facilities for
CAD computations, but they did not have the aim to
develop a solution to manage the sharing of CAD re-
sults. The emerging of cloud computing seems to of-
fer a great possibility to combine both computing re-
sources and web solution for the sharing of CAD re-
sults.
3.3 Studying the Impact of CAD
As mentioned in 2, several studies proved the useful
impact of CAD algorithms as as support for the ra-
diologists in the diagnosis. Most of them were per-
formed using the CAD as second-reader. However,
second-reader approach leads to a sensitive increasing
of the reading time if compared to the reading time
without CAD. The concurrent-reader mode can have
the appeal to substantially reducing the reading time
when compared to the second-reader mode. Anyhow,
an improvement of reading time is not enough to pre-
fer concurrent-reader mode with respect to second-
reader mode. A detailed analysis of the sensitivi-
ties reached through these two approaches needs to
be performed over a big collection of nodules. In
literature there were some attempts to perform stud-
ies about the comparison of CAD as concurrent or
second-reader modes. All these studies measured
time required for the radiologists to annotate cases
in both modes, in addition with studies on the per-
formances. In a work (Beyer et al., 2007), 4 radiolo-
gists were asked to annotate 50 studies two times (first
using CAD as concurrent-reader and then as second-
reader). The elapsed time between these two read-
ing sessions was about 4 weeks. The gold-standard
was formed by 340 nodules, most of them solid nod-
ules and no presence of non-solid nodules. The re-
sults showed a reading time much higher for the sec-
ond reader mode when compared to the concurrent
reader mode as expected. Sensitivity of the concur-
rent reader mode was found to be lower than sensi-
tivity achieved by second-reader mode. The authors
claim that they cannot exclude possible biases due to
memory-effects after only 4 weeks of elapsed time.
Another work (Matsumoto et al., 2013) reached simi-
lar results in term of reading time. This study used a
database formed only by not calcified nodules greater
than 4 mm leading to a reference standard of 207 nod-
ules. Results found about the comparison of sensitiv-
ities showed a discrepancy with work by Beyer, lead-
ing to conclude that concurrent-reader and second-
reader modes lead quite to the same sensitivity. We
believe that these improvements can be applied:
• Increasing the database size without limiting the
research to solid nodules, but including also sub-
solid and non-solid nodules.
• Eliminating the possible memory effect using
one radiologist for the annotations with CAD in
concurrent-reader mode and one radiologist for
the annotations with CAD in second-reader mode.
Development and Application in Clinical Routine of Computer Aided Detection (CAD) Algorithms for the Identification of Pulmonary
Nodules
27

4 METHODOLOGY
In this section we present a description of the method-
ology which can be used to achieve goals presented in
2.
4.1 Development and Optimization of
CAD Algorithms
We present two approaches for the improvement of
CAD systems presented in 3.1.1 and 3.1.2. The first
approach is aiming at developing a full automatic al-
gorithm for the comparison of baseline and follow-up
scans within the M5L CAD. The second is aiming at
improving the algorithms for the segmentation of pul-
monary nodules within the CirrusLung workstation.
4.1.1 Automatic Registration of CT Scans within
M5L CAD
The starting point to have an algorithm for studying
the evolution of the volume of pulmonary nodules is
the development of a robust algorithm for the regis-
tration of CT scans. Registration means determining
a geometrical transformation that aligns points (e.g.
anatomical structures) between different scans of the
same patient. There are some tools available for the
automatic registration of CT scans based on topo-
logical transformation. The most famous and public
available is called Elastix (Klein et al., 2010). Elastix
is open source software, based on the well-known
Insight Segmentation and Registration Toolkit (ITK)
(Ibanez et al., 2003). The software consists of a col-
lection of algorithms that are commonly used to solve
(medical) image registration problems. The modular
design of Elastix allows the user to quickly configure,
test, and compare different registration methods for
a specific application. A command-line interface en-
ables automated processing of large numbers of data
sets, by means of scripting. Registration algorithms
depend on several parameters, usually not tuned or
optimized for the registration of baseline and follow-
up chest CT scans. The goal will be to find the best
combination of parameters leading to the best regis-
tration of anatomical structures. In order to reach this
objective a possible methodological approach can be:
• Collecting a data-set of pair baseline/ follow-up
CT scans of different patients.
• Defining a set of points in both pair of scans cor-
responding to fixed anatomical structures which
position should not change in two different scans.
These points are usually called landmark points.
• Defining a metric for the quantitative evaluation
of the goodness of the original scan and the reg-
istered one. The standard approach is to evaluate
the performance of the algorithm, for example in
terms of smoothness and DICE coefficient. The
basic idea of the DICE coefficient is to measure
the overlap of some structures between a pair of
scans. Landmark points can be used to evaluate
the DICE.
• Run the registration algorithms for a defined set
of parameters
• Evaluate coefficients, change the value of param-
eters and re-iterate previous step
• Find the best combination of parameters
4.1.2 Editing of 3D Tumors Segmentation within
CirrusLung Workstation
As described in 3.1.2 this workstation has an auto-
matic algorithm for the segmentation of pulmonary
nodules. The user can also change some of the pa-
rameters and re-inizialize the automatic segmenta-
tion. Even if the tool is performing quite well with
all type of nodules, there are some cases in which
the automatic segmentation fails or cannot be sat-
isfactory for the user. This can happen with some
very big (more than 15 mm of diameter) solid nod-
ules usually attached to the pleura or with part-solid
nodules where there is a difficult solid core to be seg-
mented. The basic idea is to develop a tool for a semi-
automatic correction of failed segmentation. The user
will be allowed to draw some contours in 2D above
the proposed segmentation and the algorithm, taking
information from this manual correction, re-run the
segmentation in 3D. A possible methodological ap-
proach to reach this goal can be:
• Create a data-set of nodules for which the au-
tomatic segmentation fails or is not satisfactory.
This data-set can be composed looking at public
available screening data set.
• Trying to segment them using the automatic tool
already present in the workstation and store the
binary mask of failed segmentation.
• Creating an editing interface for sketch editing
segmentation in 2D.
• Developing an algorithm capable to, starting from
the drawn contour by the user, perform the seg-
mentation in 3D of the nodules using the informa-
tion provided by the contour itself
Varational interpolation with radial basis function
(Morse et al., 2005) seems to be a very prominent
path for this desired algorithm. Without going into
detail, the basic idea is to use the point belonging to
the contour drawn by the user as constrained point for
DCBIOSTEC 2016 - Doctoral Consortium on Biomedical Engineering Systems and Technologies
28

the interpolation. The segmentation will be a super-
position of radial basis function centered in the con-
straint points.
4.2 Spreading the Usage of CAD in
Clinical Practice
In order to make CAD algorithms available to radiolo-
gists without requiring any installation of software or
hardware we believe that a possible way is the com-
bination of the SaaS and Iaas approaches presented in
2. The methodology is intended to build:
• A web front-end accessible from every browser
through tablet, laptops and mobile devices for
managing CT uploading, on-line medical annota-
tion of the exam and access to CAD results
• A cloud back-end for the computation of CAD al-
gorithms
These two solutions were used to together to build
what we have called the M5L on-demand system,
which is basically composed by two main sub-
systems:
• A web front-end: available as a web applica-
tion accessible from every browser from desktop
and mobile devices. Having proper credentials,
DICOM images can be uploaded to the remote
repository and reviewers can insert their medical
diagnosis and see other reviewers ones.
• A cloud computing back-end: thought to guar-
antee flexibility in the available computing re-
sources. It allows to allocate computing resources
according to the need of the user. The back-end
handles the part of the computation of the CAD
algorithms.
We will describe in details the M5L on-demand ser-
vice we have developed in 5.2.
4.3 Studying the Impact of CAD in
Clinical Practice
In this subsection we intend to present two possible
different observer studies for the evaluation of im-
pact of CAD in clinical routine. The first observer
studying is aiming at evaluating the impact of CAD
as second-reader in the performance of the radiolo-
gists. Our approach is to evaluate the performance
of radiologist before and after having seen CAD re-
sults. Several papers cited in 1 proved an improve-
ment of the performance of the radiologists when as-
sisted in detection by CAD algorithms. However,
most of these studies have been performed using a
retrospective database coming from screening cam-
paigns. These data-set were usually composed by
no more than few hundred of nodules. Motivated by
the goal of upgrading these works we have decided
to setup a collaboration with the IRCCS of Candi-
olo (Italy). Using the M5L on-demand web service,
three radiologists with different expertise are annotat-
ing cases of oncological patients staging or re-staging
chest CT examination. The adopted methodology is
composed by the following steps:
• Every week one or more bunches of CT scans
from different patient is/are uploaded via the M5L
web front-end. They are elaborated by the M5L
CAD through the cloud back-end and results are
stored in the web-server.
• The three radiologists annotate independently the
exams through a dedicated web form without hav-
ing access to CAD results (first-reader).
• After having completed the annotation, the radiol-
ogist can access CAD results, review them and in-
sert CAD findings in his/her annotation (second-
reader).
The web form for the annotation has been built
similar to the LIDC/IDRI guidelines (Armato III,
2011). This approach was motivated in order to col-
lect several features about the shape and malignancy
of the nodules in a structured way, despite the com-
mon practice in clinical routine is not to have rigid
guidelines. Another important motivation underly-
ing this approach is the idea to create a database of
structured annotated clinical data to perform further
studies when looking at the features of pulmonary
nodules. All the public available databases are com-
ing from screening campaigns and all the most of
CADs have been evaluated using screening data-set.
No work has been performed usually a clinical data-
set with oncological patients undergoing staging or
re-staging. The second observer study is aiming at
comparing the CAD as concurrent-reader and second-
reader mode. The basic idea is to evaluate the differ-
ence of sensitivity between the CAD as concurrent-
reader and second-reader. We are expecting from pre-
vious studies that using CAD as concurrent-reader
reduces the annotation time with respect to the us-
age in second-reader mode, but a detailed analysis of
the sensitivities is needed to prefer one solution with
respect to the other. One of the crucial point is to
eliminate possible memory effects which can bias the
results. Furthermore, another bias which has to be
considered when performing this analysis is that the
results can suffer from inter-observer variability. In
order to achieve this goal we propose the following
methodology:
Development and Application in Clinical Routine of Computer Aided Detection (CAD) Algorithms for the Identification of Pulmonary
Nodules
29
• Two radiologists with similar grade of expertise
(A and B) will annotate independently a common
data-set of CT scans.
• Radiologist A will analyze a first half of the scan,
randomly chosen, in concurrent-reader mode. The
other half of the scans will be analyzed in second-
reader mode.
• Radiologist B, on the contrary, will analyze the
first half in second-reader mode, the second half
in concurrent-reader mode.
The results will be analyzed pairwise. For each
scan not only the findings of the radiologist will be
available, but also the reading time for each step.
A comparison of the sensitivities and reading times
could allow to assess and highlight the major dif-
ferences and benefit of the two different reading ap-
proaches.
5 EXPECTED OUTCOME
In this section we intend to present some preliminary
results already achieved applying methodologies de-
scribed in 4. If the development has not start yet, we
briefly delineate some expected results.
5.1 Development, Validation and
Optimization of CAD Algorithms
In the first part, since no detailed development has
started yet, we present a little bit in detail the expected
outcome for the algorithm presented in 4.1.1. In the
second part we will present some preliminary results
on the analysis of the algorithm for the segmentation
of pulmonary nodules presented in 4.1.2.
5.1.1 Automatic Registration of CT Scans within
M5L CAD
We are expecting to develop a robust algorithm for the
automatic registration of chest CT scans. This algo-
rithm takes as input two scans of the same patient, the
first is the baseline scan and the second is a follow-
up scan. The first part is the determination of land-
mark points in the scan. This can be done manually
or using some semi-automatic tools. An example of
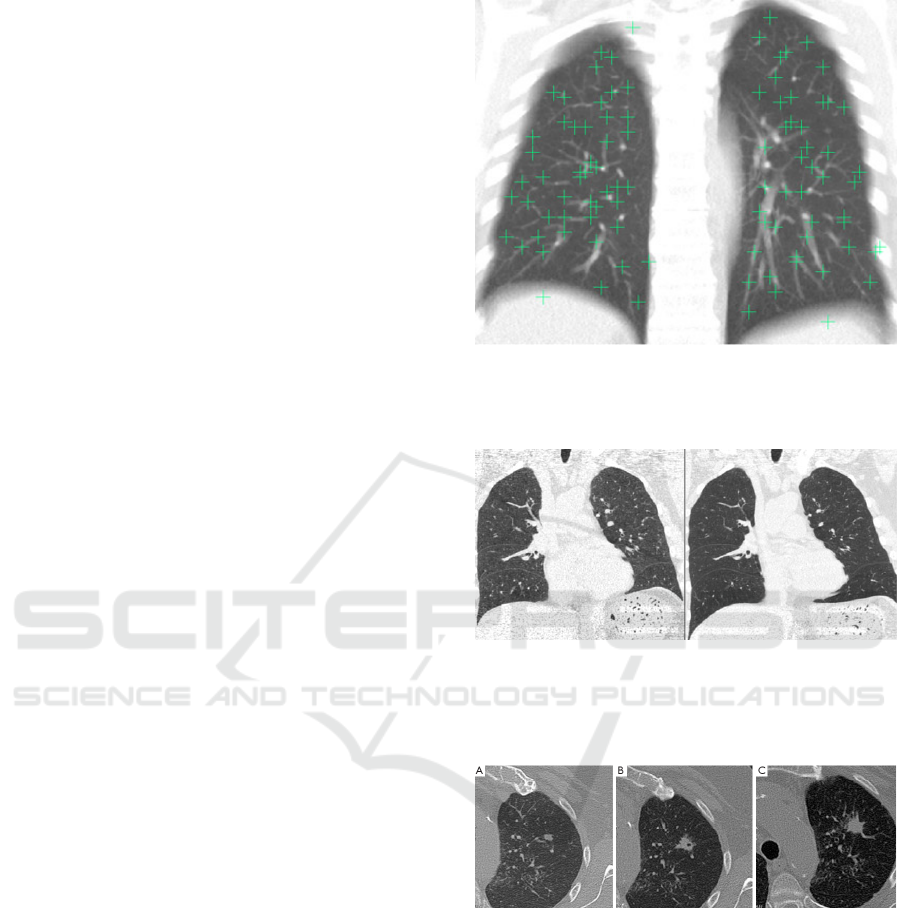
landmark point is shown in Figure 1. The next step is
running the registration algorithm which produces a
deformed (registered image) after applying topolog-
ical transformations, as shown in Figure 2. The last
step is the comparison of the same nodule in baseline
and follow-up scans as shown in Figure 3.
Figure 1: A sample fixed image showing the well-
distributed landmark points projected in the coronal direc-
tion. (An average intensity projection is used to help to
demonstrate that all points are within the lung volume).
Figure 2: On the left the fixed (target) image in an example
pair. On the right the deformed moving image after regis-
tration. It is clear that the fissures are relatively well aligned
in this example, but the lung boundaries in the lower lungs
are not).
Figure 3: 74-year-old man with rheumatoid arthritis had
solitary pulmonary nodule in left upper lobe. (A) Nodule
volume was 175 mm3 on first CT scan; (B) six months later,
nodule volume was 749 mm3, with doubling time of 114
days; (C) spiculate margins and nodule growth compatible
with malignant nodule.
5.1.2 Editing of 3D Tumors Segmentation within
CirrusLungScreening Workstation
We have started segmenting a list of nodules bigger
than 10 mm from some screening data-set public-ally
available. Our data-set was including all kind of nod-
ules: solid, calcified, part solid and non-solid. We
have tried to segment them first without interacting
DCBIOSTEC 2016 - Doctoral Consortium on Biomedical Engineering Systems and Technologies
30
with the automatic tool and then tuning some param-
eters (like threshold or shape) trying to reproduce a
satisfactory segmentation. We collected all the bi-
nary masks of nodules with failed segmentation. In
the LIDC/IDRI data-set for example, there were more
than three hundred nodules greater than 10 mm. We
found that almost 10% of those nodules could not be
segmented well by the algorithms. This sub-set was
mainly formed by very big solid nodules (usually at-
tached to the pleura) as shown in Figure fig:solid or
part-solid with a difficult solid core to be segmented
as shown in Figure 5. Starting from this list of nod-
ules we are extracting the contour from binary mask
of segmentation and we are, as starting point, devel-
oping the possibility for the user to manipulate and
correct the wrong contour in 2D.
5.2 Spreading the Usage of CAD in
Clinical Practice
A first proof of concept of the prototype of the M5L
on-demand web service was presented some years
ago (Nakayama et al., 2012). The entire system has
been recently completed and tested by some institu-
tions. Its features will be presented in Section 6.
5.3 Studying the Impact of CAD in
Clinical Practice
We briefly present the preliminary results achieved for
the clinical validation of the M5L CAD in collabora-
tion with the IRCCS of Candiolo. 20 cases out of 80
already submitted to the web site have been annotated
independently by two radiologists with a difference
in expertise of 20 years. After having completed the
annotation of a case, CAD results have been shown
to the radiologists. They were able to mark CAD
findings as False Positive, Irrelevant or True Posi-
tive. In this last case they were asked to specify the
malignancy of the finding. In order to be consistent
with the validation of M5L CAD performed within
the LIDC/IDRI data-set only nodules with a diameter
greater than 3 mm were considered. Furthermore, to
be consistent with the previous validation we took as
gold standard nodules annotated by both radiologists.
This procedure leads to a group of 27 nodules identi-
fied by both radiologists. The sensitivity of the CAD
with respect to the gold standard was of the 74% at
about 3.3 FPs/scan. The CAD added 7 more nodules,
so the sensitivity of both radiologists plus the CAD
reaches the value of 80% showing, as expected, an
improvement of performances also in clinical prac-
tice. We are expecting to proceed with this studies,
Figure 4: Screen shot of a big solid nodule with failed seg-
mentation.
increasing the validation data-set and performing fur-
ther statistical clinical studies.
Development and Application in Clinical Routine of Computer Aided Detection (CAD) Algorithms for the Identification of Pulmonary
Nodules
31
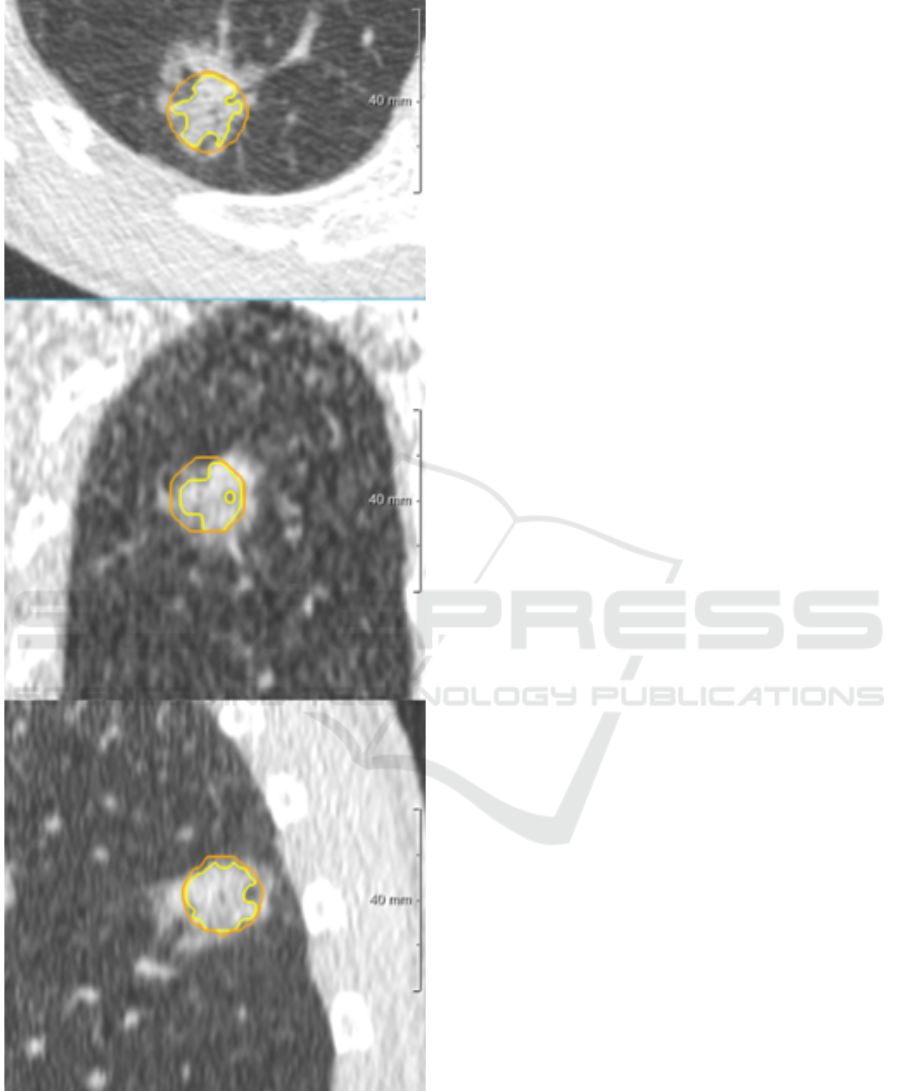
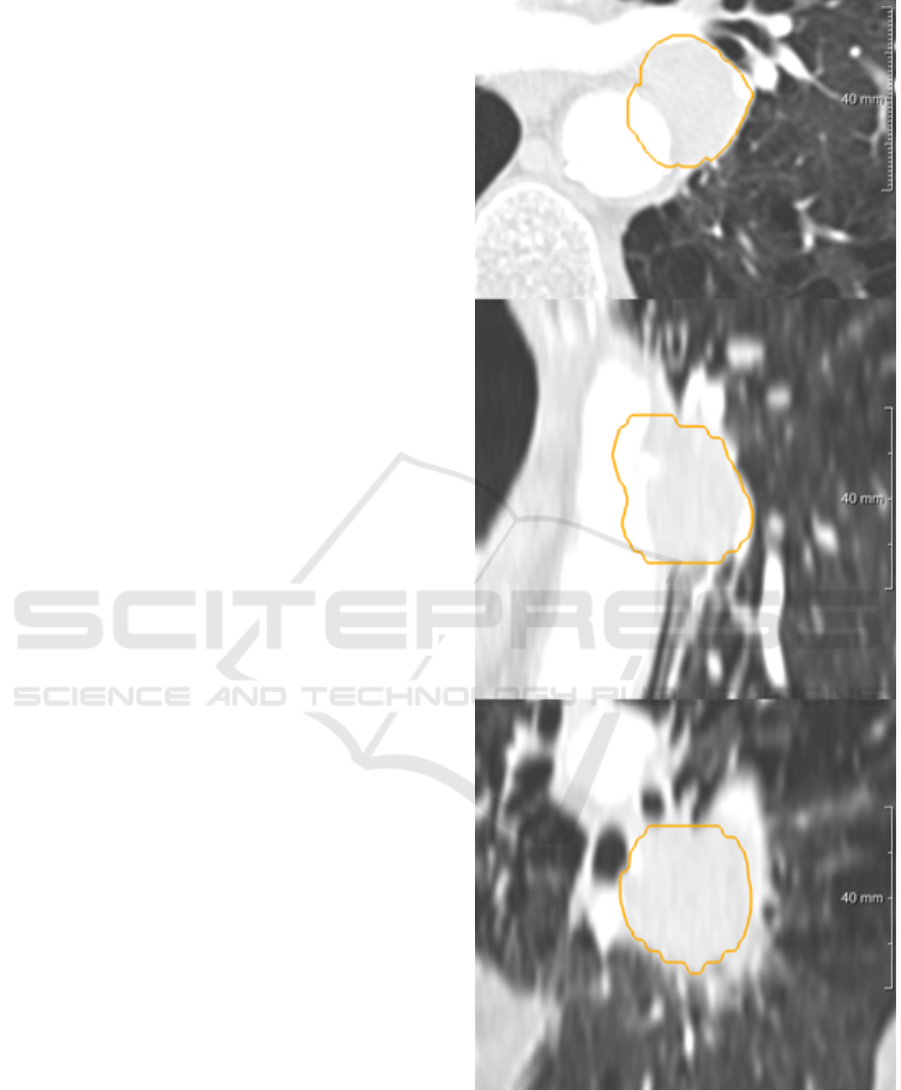
Figure 5: Screen shot of a part solid nodule with failed seg-
mentation, Orange line is the contour of the lesion, while
yellow line is the contour of the solid core.
6 STAGE OF THE RESEARCH
The outcomes of the PHD thesis can be divided into
two parts. The former is a more technical part aiming
at:
• Improving exiting CAD algorithms with the en-
hancement of some functionality useful for relat-
ing CAD outcomes to clinical results.
• Build and test a system, to be inserted in clinical
practice, which allows radiologists:
– Submit case through a dedicated front-end for
CAD computations.
– Having the possibility to directly insert their
medical annotations through a dedicated web-
form.
– Having the possibility to access to CAD re-
sults and operate both in concurrent-reader or
second-reader mode.
The M5L on-demand system can be considered as
the first main outcome of my PHD thesis. The entire
front-end web interface has been developed using the
DRUPAL free and open source tool (Coombs, 2009).
DRUPAL easily allows the development of custom
modules in PHP code. We have basically developed
two modules:
• Submission module: this module is conceived to
be used by a technician operating with a submit-
ter role, who uploads one or more CT studies to be
analyzed and selects a radiologist (not necessarily
belonging to the same institutions) who will re-
view the studies. The module layout is shown in
Figure 6.
• Review module: this module is conceived to be
used by a radiologist. After logging in with
his/her credentials and reviewer role, the radiol-
ogist can insert the medical annotation of studies
assigned for review during the submission pro-
cess. The M5L results are available in differ-
ent formats, such as DICOM Structured Report,
HTML, XML and PDF. The M5L marks can then
be reviewed ad assessed, with the options to in-
clude them into the annotation, as shown in Figure
7, or reject them.
The M5L CAD on- demand service is hosted by
the INFN Torino Computing Center, which is a Tier-2
of Large Hadron Collider Computing Grid (Turner IV
et al., 2006). A Private Cloud infrastructure has
been created. The facility is managed by OpenNeb-
ula, a free and open-source Cloud Management Plat-
form which allows hardware and virtual infrastructure
control and monitoring, adding the possibility of vir-
tual machine life-cycle management (Miloji
ˇ
ci
´
c et al.,
2011). OpenNebula orchestrates storage, networking,
actualization, monitoring, and security technologies
to deploy computing services as virtual machines on
distributed Resources infrastructures. The resources
used by M5L are:
DCBIOSTEC 2016 - Doctoral Consortium on Biomedical Engineering Systems and Technologies
32
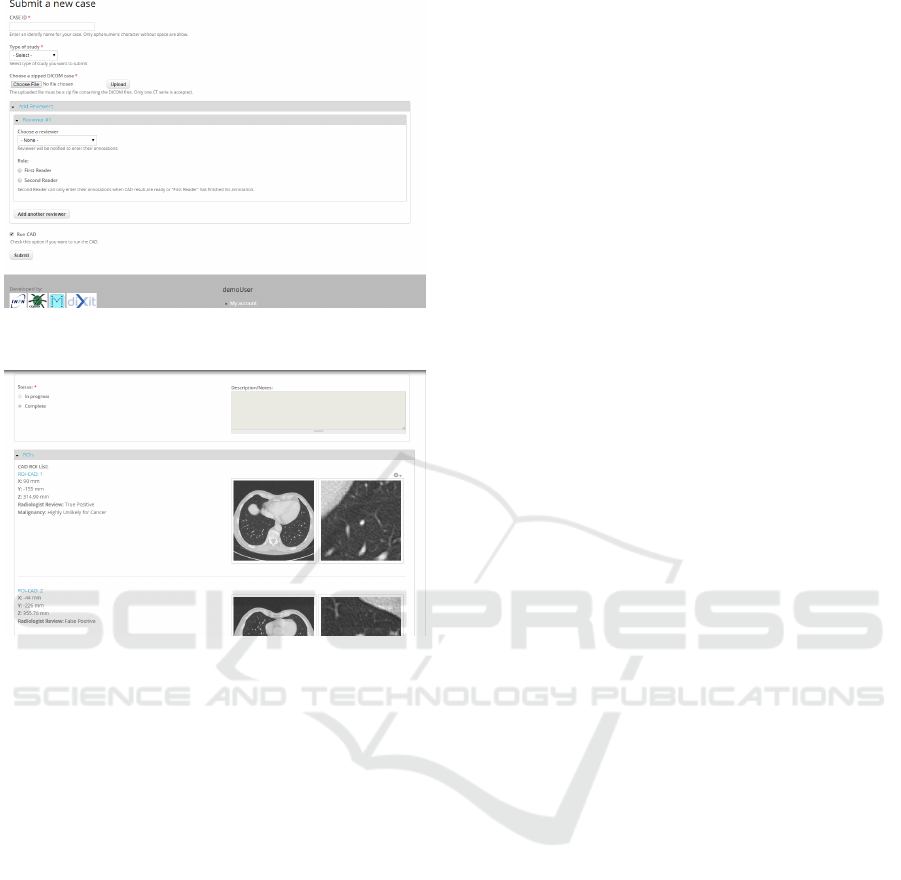
Figure 6: Screenshot of the submission page as seen buy a
submitter.
Figure 7: Screenshot of CAD review page as seen by a ra-
diologist.
• One physical host for the web-server.
• Several Virtual Machines (VMs) as computational
power.
At this moment M5L is allowed to deploy up to 18
VMs, with a total of 48 cores. An elastic cluster based
on CernVM Online (Buncic et al., 2010), a service
that can create clusters with a head node and many
workers based on CernVM OS, was configured so
as to achieve the capability to scale resources up or
down. Using CernVM Online VMs can be contextu-
alized, so as to define the use of resources, user set-
tings and automatically install and enable some spe-
cific tools, which in our case are like HTCondor (Tan-
nenbaum et al., 2001) and Elastiq (Berzano, 2014).
The second part of the PHD thesis is more a clinical
part, aiming at performing observer studies to inves-
tigate the impact of CAD in clinical routine and to
diffuse the usage of CAD as support for cancer de-
tection. We believe that technical aspects cannot be
divided from clinical requirements. CAD algorithms
have to fit clinical guidelines. The link between tech-
nically aspects and clinical requirements is mandatory
if we really want to insert CAD in clinical practice.
CAD workstations should we built according to re-
quirements provided by clinicians.
REFERENCES
Armato III, S. (2011). The lung image database consortium
(lidc) and image database resource initiative (idri): a
completed reference database of lung nodules on ct
scans. Medical Physics, 38(2):915–931.
Awai, K., Murao, K., Ozawa, A., Komi, M., Hayakawa, H.,
Hori, S., and Nishimura, Y. (2004). Pulmonary nod-
ules at chest ct: Effect of computer-aided diagnosis
on radiologists detection performance 1. Radiology,
230(2):347–352.
B., V. G. et al. (2013). Cirrus lung: an optimized work-
flow for quantitative image analysis of thoracic com-
puted tomography and chest radiography for major
pulmonary diseases: chronic obstructive pulmonary
disease, lung cancer and tuberculosis. In RSNA.
Bellotti, R. et al. (2007). Distributed medical images anal-
ysis on a grid infrastructure. Future Generation Com-
puter Systems, 23(3):475–484.
Berzano, D. (2014). Elastiq,github.com/dberzano/elastiq.
Beyer, F., Zierott, L., Fallenberg, E., Juergens, K., Stoeckel,
J., Heindel, W., and Wormanns, D. (2007). Com-
parison of sensitivity and reading time for the use of
computer-aided detection (cad) of pulmonary nodules
at mdct as concurrent or second reader. European Ra-
diology, 17(11):2941–2947.
Brochu, B., Beigelman-Aubry, C., Goldmard, J., Raffy, P.,
Grenier, P., and Lucidarme, O. (2007). Evaluation de
limpact dun systeme cad sur la performance des radi-
ologues pour la d
´
etection des nodules pulmonaires sur
des examens scanographiques multicoupes du thorax.
Journal de Radiologie, 88(4):573–578.
Brown, M. et al. (2005). Computer-aided lung nodule detec-
tion in ct: Results of large-scale observer test1. Aca-
demic Radiology, 12(6):681–686.
Buncic, P., Sanchez, C. A., Blomer, J., Franco, L., Haru-
tyunian, A., Mato, P., and Yao, Y. (2010). Cernvm–
a virtual software appliance for lhc applications. In
Journal of Physics: Conference Series, volume 219,
page 042003. IOP Publishing.
Cerello, P. et al. (2008). The channeler ant model: ob-
ject segmentation with virtual ant colonies. In Nu-
clear Science Symposium Conference Record, 2008.
NSS’08. IEEE, pages 3147–3152. IEEE.
Coombs, K. (2009). Drupal done right. Library journal,
134(19):30–32.
Das, M., Muhlenbruch, G., Mahnken, A. H., Flohr, T. G.,
Gundel, L., Stanzel, S., Kraus, T., Gunther, R. W., and
Wildberger, J. (2006). Small pulmonary nodules: Ef-
fect of two computer-aided detection systems on radi-
ologist performance 1. Radiology, 241(2):564–571.
De Nunzio, G. et al. (2011). Automatic lung segmentation
in ct images with accurate handling of the hilar region.
Journal of digital imaging, 24(1):11–27.
Development and Application in Clinical Routine of Computer Aided Detection (CAD) Algorithms for the Identification of Pulmonary
Nodules
33

Ferlay, J., Parkin, D., and Steliarova-Foucher, E. (2010).
Estimates of cancer incidence and mortality in europe
in 2008. European Journal of Cancer, 46(4):765–781.
Ibanez, L., Schroeder, W., Ng, L., and Cates, J. (2003). The
itk software guide.
Jemal, A., Siegel, R., Ward, E., Hao, Y., Xu, J., and Thun,
M. (2009). Cancer statistics, 2009. CA: a cancer jour-
nal for clinicians, 59(4):225–249.
Jemal, A., Siegel, R., Xu, J., and Ward, E. (2010). Cancer
statistics, 2010. CA: a cancer journal for clinicians,
60(5):277–300.
Klein, S. et al. (2010). Elastix: a toolbox for intensity-based
medical image registration. Medical Imaging, IEEE
Transactions on, 29(1):196–205.
Lamanna, M. (2004). The lhc computing grid project at
cern. Nuclear Instruments and Methods in Physics
Research Section A: Accelerators, Spectrometers, De-
tectors and Associated Equipment, 534(1):1–6.
Lassen, B., Jacobs, C., Kuhnigk, J., van Ginneken, B.,
and van Rikxoort, E. (2015). Robust semi-automatic
segmentation of pulmonary subsolid nodules in chest
computed tomography scans. Physics in medicine and
biology, 60(3):1307.
Li, Q., Sone, S., and Doi, K. (2003). Selective enhance-
ment filters for nodules, vessels, and airway walls in
two-and three-dimensional ct scans. Medical physics,
30(8):2040–2051.
MacMahon, H., Austin, J. H., Gamsu, G., Herold, C. J., Jett,
J., Naidich, D., Patz Jr, E. F., and Swensen, S. (2005).
Guidelines for management of small pulmonary nod-
ules detected on ct scans: a statement from the fleis-
chner society 1. Radiology, 237(2):395–400.
Matsumoto, S., Ohno, Y., Aoki, T., Yamagata, H., Nogami,
., Matsumoto, K., Yamashita, Y., and Sugimura, K.
(2013). Computer-aided detection of lung nodules
on multidetector ct in concurrent-reader and second-
reader modes: A comparative study. European Jour-
nal of Radiology, 82(8):1332–1337.
Matsumoto, S., Ohno, Y., Yamagata, H., T., D., and
Sugimura, K. (2008). Computer-aided detection of
lung nodules on multidetector row computed tomog-
raphy using three-dimensional analysis of nodule can-
didates and their surroundings. Radiation medicine,
26(9):562–569.
Mell, P. and Grance, T. (2011). The nist definition of cloud
computing.
Miloji
ˇ
ci
´
c, D., Llorente, I. M., and Montero, R. S. (2011).
Opennebula: A cloud management tool. IEEE Inter-
net Computing, (2):11–14.
Morse, B. S., Yoo, T. S., Rheingans, P., Chen, D. T., and
Subramanian, K. R. (2005). Interpolating implicit sur-
faces from scattered surface data using compactly sup-
ported radial basis functions. In ACM SIGGRAPH
2005 Courses, page 78. ACM.
Nakayama, R., Nakako, N., Namba, K., Hizukuri, A., Naga-
sawa, N., Kobayashi, S., and Takeda, K. (2012). 14th
international workshop on computer-aided diagnosis.
Int J CARS, 7(1):S485–S496.
Retico, A., Delogu, P., Fantacci, M., Gori, I., and Martinez,
A. (2008). Lung nodule detection in low-dose and
thin-slice computed tomography. Computers in biol-
ogy and medicine, 38(4):525–534.
Retico, A., Fantacci, M., Gori, I., Kasae, P., Golosio, B.,
Piccioli, A., Cerello, P., De Nunzio, G., and Tangaro,
S. (2009). Pleural nodule identification in low-dose
and thin-slice lung computed tomography. Computers
in biology and medicine, 39(12):1137–1144.
Tannenbaum, T., Wright, D., Miller, K., and Livny, M.
(2001). Condor: a distributed job scheduler. In Be-
owulf cluster computing with Linux, pages 307–350.
MIT press.
Team, N. L. S. T. R. et al. (2011). Reduced lung-
cancer mortality with low-dose computed tomo-
graphic screening. The New England journal of
medicine, 365(5):395.
Torres, E. L., Fiorina, E., Pennazio, F., Peroni, C., Saletta,
M., Camarlinghi, N., Fantacci, M., and Cerello, P.
(2015). Large scale validation of the m5l lung
cad on heterogeneous ct datasets. Medical Physics,
42(4):1477–1489.
Turner IV, W. P., PE, J., Seader, P., and Brill, K. (2006). Tier
classification define site infrastructure performance.
Uptime Institute, 17.
van Ginneken, B. et al. (2010). Comparing and combining
algorithms for computer-aided detection of pulmonary
nodules in computed tomography scans: the anode09
study. Medical Image Analysis, 14(6):707–722.
DCBIOSTEC 2016 - Doctoral Consortium on Biomedical Engineering Systems and Technologies
34
