
Performance Monitoring Framework for Service Oriented System
Lifecycle
Tehreem Masood, Chantal Cherifi and Néjib Moalla
Decision and Information for Production Systems (DISP), Université Lumière Lyon 2, Lyon, France
Keywords: Web Services, Service Oriented System, Quality of Service, Ontology, Technical Indicators and
Performance.
Abstract: Service oriented systems are highly dynamic systems composed of several web services. One of the most
important challenges in service oriented systems is to deliver acceptable quality of service. For this purpose,
it is required to monitor quality of service along different activities of service oriented system. Existing
research focuses on specific activities but do not take into account all the activities of service oriented
system together at the infrastructure level. In this paper, we present performance monitoring framework to
provide support for the whole service oriented system lifecycle. Our framework integrates several
ontologies to monitor the performance of service oriented systems in order to ensure their sustainability. We
design a base Service Monitoring Ontology that captures all the information about the service domain.
Along with that we design ontologies for technical indicators at service level, binding level, composition
level and server level. We conduct a performance evaluation over real web services using suitable
estimators for response time, delay, loss and more.
1 INTRODUCTION
For many companies using big data path, collecting
data has been a costly exercise with varying degrees
of risk factors. Using big data is time consuming and
hence lacks reactiveness which is not acceptable in
real time decision making (Agrawal, 2015). These
days understanding how real-time external data
sources benefit an organization is vital.
Service oriented systems are highly dynamic
systems composed of various web services
providing by different service providers
(Andrikopoulos et al., 2008). These systems are
based on service oriented architecture (SOA) which
provides interoperability, reusability, composition of
web services and loose coupling (Erl, 2008). SOA
allows realizing business processes by recursively
combining services into orchestrations
(Weerawarana et al., 2005). The business process is
then itself exposed as a service to consumers. The
standard language for service orchestration based on
Web services is BPEL (BPEL 2.0 2007).
Service oriented architecture is used as a means
to develop adaptive distributed software applications
in a reactive manner. We can now develop
techniques which take into account key data points
to arrive at a more accurate real time predictions.
An important aspect in the service oriented
system lifecycle is management of the performance
along its lifecycle. Performance requirements on
service or business processes are specified as
technical indicators with target values which are to
be achieved in a certain analysis period. Typical
technical indicators are service duration, process
duration, service response time, process response
time and more. Due to the dynamic nature of service
oriented systems, it is required to monitor Quality of
Service (QoS) along various stages of its lifecycle.
Technical indicators can be monitored at service or
process execution time using WSO2, Oracle or
Business Activity Monitoring technology.
Semantic web uses the notion of ontologies for
the creation and elicitation of domain knowledge
(Gomez-Perez et al., 2001). Ontologies represent
formal specifications about the components of
systems and their relationships in a machine
understandable and processable manner (Antoniou et
al., 2004). They play an important role in both
semantic web applications and knowledge
engineering systems (Fahad and Qadir, 2008).
Several tasks such as information storage,
800
Masood, T., Cherifi, C. and Moalla, N.
Performance Monitoring Framework for Service Oriented System Lifecycle.
DOI: 10.5220/0005853608000806
In Proceedings of the 4th International Conference on Model-Driven Engineering and Software Development (MODELSWARD 2016), pages 800-806
ISBN: 978-989-758-168-7
Copyright
c
2016 by SCITEPRESS – Science and Technology Publications, Lda. All rights reserved

processing, retrieval, decision making etc. are done
on the basis of ontologies by such systems.
In this paper, we introduce a framework towards
performance monitoring of service oriented system
based on technical indicators. The framework
consists of four major steps (i) Monitoring of
performance to ensure its sustainability, (ii) Service
monitoring ontology (iii) Ontologies for
performance measurement of service oriented
activities and (iv) Merging ontologies.
The remaining of the paper is organized as
follows: Section 2 includes related work. Section 3
discusses performance measurement of service
oriented activities. Section 4 discusses our proposed
performance monitoring framework. We conclude
the research in the last section.
2 RELATED WORK
In this section we discuss some techniques that have
been proposed to ensure performance of web
services.
2.1 Performance Analysis of SOA
Techniques
In this section we analyze research that focuses on
QoS.
(Tari et al., 2011) proposed a benchmark of
different SOAP bindings in wireless environments.
Three sets of experiments were carried out: loopback
mode, wireless network mode and mobile device
mode. The experimental results show that HTTP
binding inherits very high protocol overhead (30%–
50% higher than UDP binding) from TCP due to the
slow connection establishments and tear-down
processes and the packet acknowledgement
mechanism. UDP binding has the lower overhead
because it does not require establishing connections
before transmitting datagram’s and does not address
reliability. This results in a reduction in the response
time and an increase in the total throughput. Its
configuration and results can serve as a standard
benchmark for other researchers who are also
interested in the performance of SOAP bindings in
wireless networks.
(Lin et al., 2008) proposed an ontology based
QoS-Aware support for semantic web services. They
have used ontology to describe Quality of service
metrics. They have composed their ontology into
upper and lower level property. They have not
considered the input/output operations. They have
not included real time values for the performance
analysis to reach towards optimal web service.
2.2 Ontology based QoS Analysis
Techniques
(Moraes et al., 2008) designed an ontology named
MonONTO for proposing recommendation for the
advanced internet applications users. They have
considered information concerning the application
type, traffic generated and user profile along with
network performance metrics. Their expert system
monitors the performance of advanced internet
applications. Their ontology serves as a support to a
decision reference tool by providing high-level
information to the user about the agreement of the
network facing the service level demands. They
have used a fixed list of network parameters.
Therefore, it does not deal with the heterogeneity
and extensibility issues. Implementations of web
services have not been done by them. Additionally,
it does not deal with QoS mapping.
(Benaboud et al., 2012) proposed Semantic Web
Service Discovery Based on Agents and Ontologies
considering the fuzzy constraints. Their framework
is modelled by adding semantics of QoS attributes
with web service profiles. It describes the design and
implementation of a web service matchmaking
agent. Agent uses an OWL-S based ontology and an
OWL reasoner to compare ontology based service
descriptions. They have used fuzzy constraints
increases the efficiency of the web service discovery
approach by providing the customers the web
services which are not actually satisfying the input
QoS constraints, but are close to the QoS constraints
specification.
2.3 QoS Aggregation and Performance
Prediction Techniques
QoS-based service selection has been done (Jaeger
et al., 2005) to describe how to find an optimal
selection of functionally equivalent services based
on their QoS properties. QoS aggregation as part of
QoS-based service selection mostly addresses only
QoS properties when interacting with other services
(Unger, 2005). It also neglects the time which is
taken by the BPEL engine software to navigate
through the process model (Rud, 2007). The IT
infrastructure consisting of hardware and software
effects response time, throughput and availability of
the service oriented system lifecycle. If the IT
infrastructure is predefined, the goal is to estimate
performance of service oriented system lifecycle
(performance prediction) (Marzolla 2007), for
Performance Monitoring Framework for Service Oriented System Lifecycle
801
example, by using benchmarking techniques.
3 SERVICE ORIENTED
ACTIVITIES FOR
PERFORMANCE ANALYSIS
An important aspect in the service oriented system
(SOS) is management of the performance of
different activities. There are different activities in
service based systems to analyze performance like
messaging, service, binding, business process and
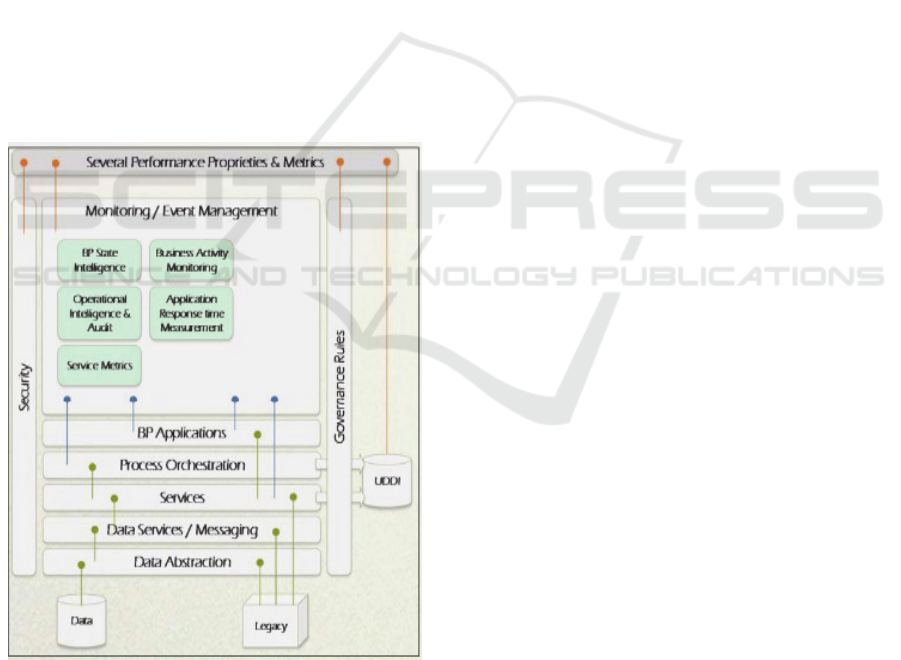
server. Service based activities for performance
analysis are shown in Figure 1. Service is composed
of different operations. Performance can be
monitored at both the service and different
operations level. Business process level is used for
the performance analysis at the composition of
service. Binding level covers the performance at the
protocols level. Server level covers the performance
of resources available. There are different types of
technologies available which we can effectively
utilize to guarantee better performance.
Figure 1: Service based Activities for Performance
Analysis.
Data abstraction layer is used to query data from
the database and the historical information about the
data and components which is available in the
legacy. The component services access the Data
abstraction layer to fetch and retrieve data.
Messaging through SOAP provides the ability to
perform the necessary message transformation to
connect the service requestor to the service provider
and to publish and subscribe messages and events
asynchronously (Tari et al., 2011). In this way
services are published in the service layer. Service
oriented architecture is in process at the process
orchestration layer. All this information is stored in
the UDDI (Zhou et al., 2009). On the top level layer,
BP applications provide process orchestration
mechanism to
execute enterprise business processes.
BP application use Business Process Modeling
Notation (BPMN) to design their business processes.
Governance rules are the set of policies like service
will be available for one year etc. Security is used to
provide some integrity to the system like
authentication with the help of user name and
password. Service metrics are the parameters in
order to guarantee the performance of web services.
For example in the ITIL (Donna, 2014), there are 5
sub- categories and more than 100 metrics available
for service support process and 5 sub- categories and
more than 50 metrics available for service delivery
processes. BP state intelligence is used to provide
some intelligence or flags to measure the
performance of BPEL.
4 PERFORMANCE
MONITORING FRAMEWORK
This section presents our Performance Monitoring
Framework. The first step of our approach is the
specification of service or business process
performance requirements. This specification is
typically performed on user requirement or business
goals in a certain time period. We divide our
proposed performance monitoring framework into
different steps as shown in Figure 2. We design
performance based ontologies for all the activities of
SOS. After the creation of these ontologies, we
identify the common concept by merging these
ontologies which results in performance profile.
Performance requirements of SOS are monitored
in terms of technical indicators. These technical
indicators have target values that are required to
achieve in a certain time period. For this purpose we
perform performance analysis for SOS activities
already explained in Section 3. We identify technical
indicators at the service level, business process level,
server level and binding level. We create ontologies
for all these levels and merge these ontologies to
create performance profile at the infrastructure level.
MDE4SI 2016 - Special Session on Model-Driven Enterprise Services and Applications for a Sustainable Interoperability: New Paradigms
for Development in the Future Enterprise - 2nd Edition
802
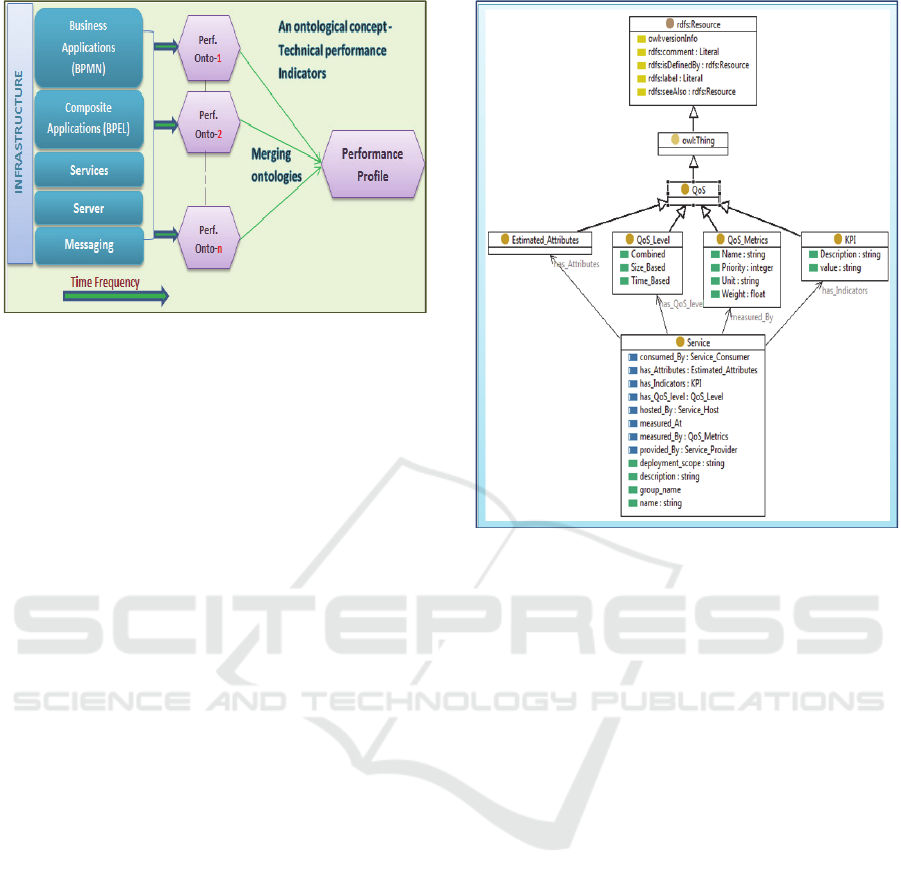
Figure 2: Creation of Performance Profile.
Major steps for the creation of performance profile
are:
• Specifying ontological concepts
• Management of common concepts
• Quality assurance on the performance profile
In the following sub sections we explain service
monitoring ontology and ontologies at service level,
server level, business process level and binding
level.
4.1 Service Monitoring Ontology
(SMOnt)
In this step we design a sophisticated Service
Monitoring ontology (SMOnt) as a base
infrastructure. It aggregates the main concepts and
relationships between them. QoS requirements,
service domain concepts, key performance
indicators and performance levels are the major
domains. SMOnt is shown in Figure 3.
Service: This concept has various data type
properties to capture different attributes in SMOnt. It
also has various object properties that links Service
concept to other concepts. The details are as follows:
Data Type Properties:
Name: records the name of the service.
Description: captures the description about the
service.
Group_name: records name of the group to which
the service belongs.
Deployment_Scope: captures the deployment scope
of the service.
Figure 3: Service Monitoring Ontology (SMOnt).
Object Properties:
Consumed_By: captures the relationship of each
service consumed by its consumers.
Has_Attributes: Each service has some attributes
linked by this property between service and
Estimated_Attributes.
Has_Indicators: The performance of each service is
monitored via various KPI and this property relates
service with KPI concept.
Has_QoS_level: makes relation between service
concept and QoS_Level.
Hosted_By: It captures the relation of each service
hosted by its Host.
Measured_At: Each service is monitored and
performance is measured at the Performance_Level.
Measured_By: Each service is measured by the
QoS_Metrics via this property.
Provided_By: It captures the relation of each service
provided by its provider.
Performance Level: This concept conceptualizes
the level where a service network can be monitored.
It has various sub concepts, each for capturing the
performance levels such as Domain Level, Node
level, Server Level, Service Level, Operation Level,
and Messaging Level.
QoS Level: Quality of service model is classified as
metrics into time based, size based and combined
(both time based and size based) metrics. Key
Performance Monitoring Framework for Service Oriented System Lifecycle
803
performance indicator (KPI) assessment model has
classified the indicators as response time, delay,
error, loss, SLA, number of operations per second
and average data blocks per time unit.
Time based: Time based classification includes all
those indicators that can be measured in time units
like availability, delay, response time. Availability is
defined as the total down time per service. Delay is
defined as downtime divided by uptime. Response
time is also called latency. It is the time perceived by
a client to obtain a reply for a request for a web
service. It includes the transmission delays on the
communication link. It is measured in time units.
Size based: Size based classification includes all
those indicators that can be measured in size units.
For example reliability. Reliability can be analyzed
as loss or error of service. It is measured as number
of successful invocations divided by total number of
invocations.
Combined: Combined based classification includes
all those indicators that can be measured by both
time and size units like bandwidth and throughput.
Bandwidth is defined as the tasks per time unit and
average data blocks per time unit. Throughput is
defined as the number of operations per second.
4.2 Performance Ontologies
In this step, we explain the ontological concepts of
technical indicators at service level, business process
level, binding level and server level. Ontologies for
all these activities are shown below step by step.
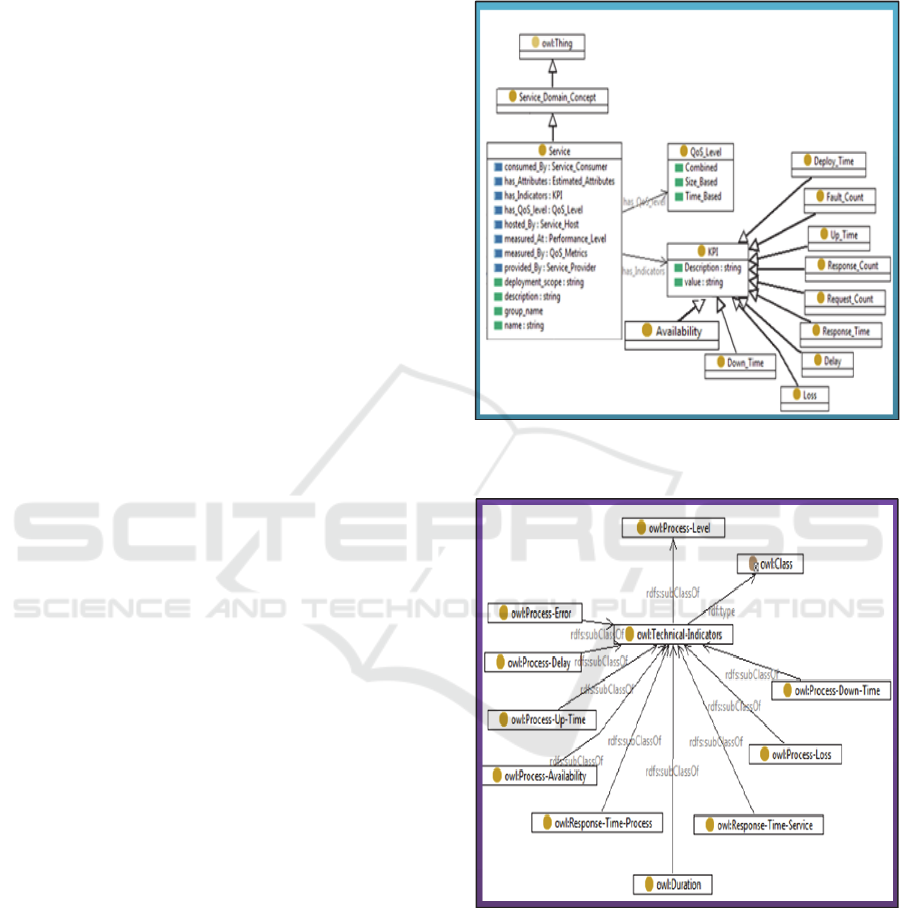
Figure 4 shows the ontology of technical indicators
at service level.
Technical indicators at service level are
explained below.
Response Time: captures the response time of a
service/operation. It has three sub concepts to record
Maximum, Minimum and Average response time.
Request Count: shows the number of invocation of
a service.
Response Count: shows the number of replies for
an invocation of a service.
Fault Count: shows the number of invocations the
service has not replied.
Deploy Time: shows when the service is deployed
at the server.
Up Time: shows the time period the service is
available since its deployment.
Down Time: shows the time period of un-
availability of a service since its deployment.
Delay: shows the average response time of a service.
Loss: shows that the service is un-available (i.e., it
cannot be invoked).
Figure 4: Ontology of Technical Indicators at Service
Level.
Figure 5: Ontology of Technical Indicators at Business
Process Level.
Figure 5 shows the ontology of technical indicators
at business process level. Technical indicators at
business process level are explained below.
Process-Response-Time: captures the response
time of a business process. It has three sub concepts
to record Maximum, Minimum and Average
response time.
MDE4SI 2016 - Special Session on Model-Driven Enterprise Services and Applications for a Sustainable Interoperability: New Paradigms
for Development in the Future Enterprise - 2nd Edition
804
Process-Up-Time: shows the time period the
business process is available since its deployment
Process-Down-Time: shows the time period of un-
availability of a business process.
Process-Delay: shows the average response time of
a business process.
Process-Loss: shows that the business process is un-
available (i.e., it cannot be invoked).
Process-Duration: shows the time duration of
business process since it is deployed, executed and
remained in process.
Some other technical indicators of service level are
also used in order to estimate their value at
composition level like availability and service
response time.
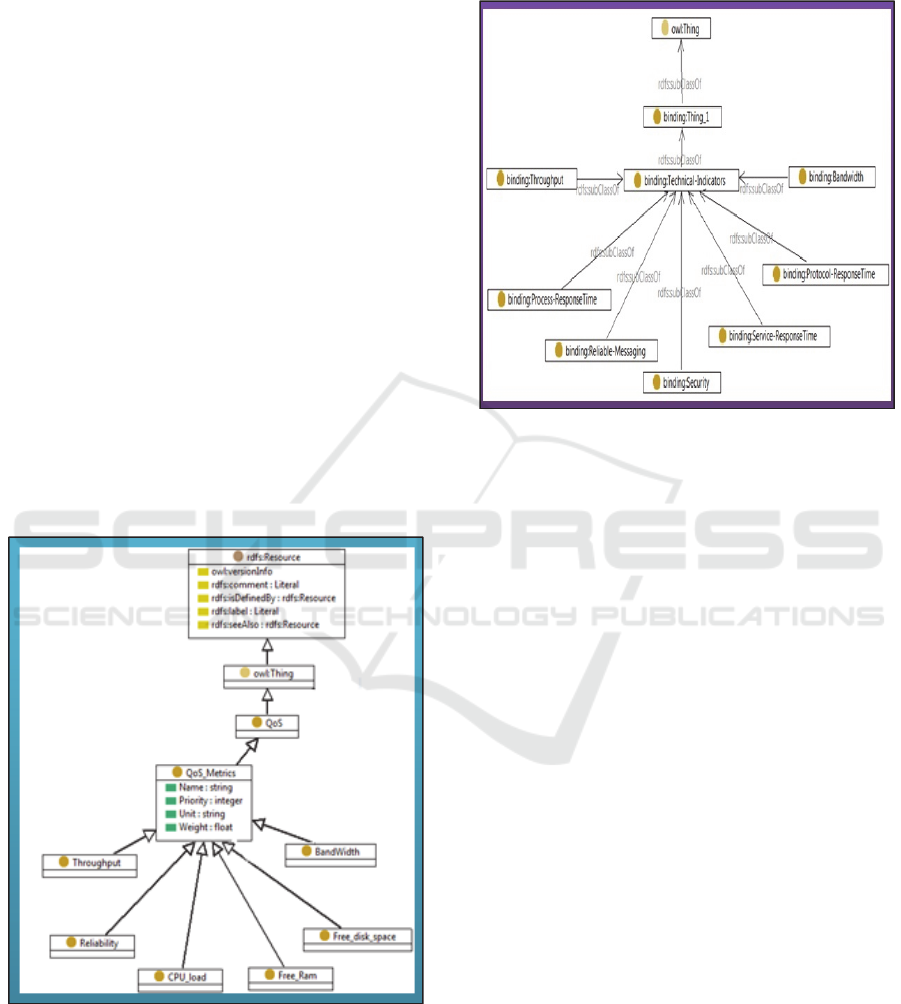
Figure 6 shows the ontology of technical
indicators at server level.
Technical indicators for the server level are free
disk space, CPU Load, free RAM, throughput,
bandwidth and reliability. We estimate available
memory to support the new deployment by
analyzing free disk space, CPU load and free RAM.
Bandwidth is defined as the tasks per time unit and
average data blocks per time unit. Throughput is
defined as the number of operations per second.
Figure 6: Ontology of Technical Indicators at Server
Level.
Figure 7 shows the ontology of technical
indicators at binding level. Binding level means at
the messaging level. Technical indicators at
transport messaging level are binding-throughput,
binding-reliable-messaging, binding-security
(authentication, authorization, and encryption),
binding-bandwidth.
Figure 7: Ontology of Technical Indicators at Binding
Level.
4.3 Merging Ontologies
After designing ontologies for technical indicators of
SOS activities, we merge them to create
performance profile at the infrastructure level. There
are three levels of analysis required for performance
monitoring of SOS lifecycle.
Level 1:
In level 1, we try to increase the coverage of
monitoring performance model. Also identification
of sources of performance loss.
Level 2: Recommendations reengineering
Recommendations reengineering includes following
steps.
• Traceability of the collected events
• Event Classification Model
• Operations for the re-engineering of components
• Number of instances of business application
At the Business Level:
• Assigning a job task to an available resource role.
At System Level:
• Evolution of the specification of a service for better
interoperability or better adaptation to specifications
the overall architecture.
At the Technical Level:
• Need more hardware resources.
Level 3: User Demand Assessment
Recommendations reengineering includes following
Performance Monitoring Framework for Service Oriented System Lifecycle
805

steps.
• Type of application
• Deploy a new component (i.e. service)
• Use an existing component
• Orchestrating existing components
• Assessment criteria:
• Compliance with the business logic
• Scope of the functional impact and dependency
analysis
• Use of hardware resources
• Estimation of mounting costs and usage
We conduct a performance evaluation over real web
services using suitable estimators for all the
technical indicators at service level, business process
level, server level and binding level. We perform
this performance evaluation using WSO2 server and
Oracle® Content Services Administrator.
5 CONCLUSIONS
In this paper we propose a performance monitoring
framework to ensure sustainability of SOS at the
infrastructure level. The framework consists of
monitoring of performance, Service monitoring
ontology, ontologies for performance measurement
of service oriented activities and merging of
ontologies. Extensive analysis of technical indicators
with timing constraint to create performance profile
is in process. We will implement our work by using
real time case study.
REFERENCES
Agrawal, D, (2015) Challenges and Opportunities with.
Big Data. White paper, USA.
Andrikopoulos, V., Bertoli, P., & Bindelli, S. (2008).State.
of the art report on software engineering design
knowledge and survey of HCI and contextual
knowledge. Project Deliverable PO-JRA.
Erl, T. (2008). Soa: Principles of service
design(Vol.1).Prentice Hall Upper Saddle River.
Weerawarana, S., Curbera, F., Leymann, F., Storey, T.,
Ferguson, D. (2005) Web Services Platform
Architecture. Prentice Hall PTR.
Web Services Business Process Execution Language
Version 2.0 (2007) – Committee Specification.
Published via Internet.
Antoniou, G., and Harmelen, F.V. 2004. A Semantic Web
Primer. MIT Press Cambridge, ISBN 0-262-01210-3.
Fahad M. and Qadir, M. A. (2008). “A Framework for
Ontology Evaluation.” ICCS Suppl, vol. 354, pp 149–
158.
Gomez-Perez, A., Lopez, M.F, and Garcia, O.C. (2001).
Ontological Engineering: With Examples from the
Areas of Knowledge Management, E-Commerce and
the Semantic Web. Springer ISBN: 1-85253-55j-3.
Zhou, C., Chia, L. T., and Lee, B. S. (2009) “QoS-Aware
Web Services Discovery with Federated Support for
UDDI,” Modern Technologies in Web Services
Research, IGI Publishing Hershey New York.
Tari,Z., A. Phan, A. K., Jayasinghe,M., Abhaya, V. G.
(2011) “Benchmarking Soap Binding. On the
Performance of Web Services,” pp 35-58, Springer.
Donna, K. (2014) A Guide to Service Desk Concepts:
Service Desk and the IT Infrastructure Library, 4th
edition, Course Technology Press Boston, MA, United
States, ISBN- 10: 1285063457 ISBN-13:
9781285063454.
Tari. Z, Phan. A. K. A, Jayasinghe. M, Abhaya. V.
G,“Benchmarking. (2011) Soap Binding. On the
Performance of Web Services,” pp 35-58, Springer.
Lin L, Kai S, and Sen S. (2008) “Ontology-based QoS-
aware support for semantic web services,” Technical
Report at Beijing University of Posts and
Telecommunications.
Moraes, P, Sampaio, L, Monteiro, J, Portnoi M. (2008):
Mononto: A domain ontology for network monitoring
and recommendation for advanced internet
applications users. In: Network Operations and
Management Symposium Workshops, IEEE.
Benaboud R, Maamri R, and Sahnoun Z. (2012)Semantic
Web Service Discovery Basedon Agents and
Ontologies, International Journal of Innovation,
Management and Technology, Vol. 3, No. 4, pp 467-
472.
Jaeger, M.C., Muehl, G.; Golze, S. (2005) QoS-Aware
Composition of Web Services: An Evaluation of
Selection Algorithms. OTM Conferences.
Unger, T. (2005) Aggregation on QoS und SLAs in BPEL
Geschaeftsprozessen Diplomarbeit Nr. 2305,
Universitaet Stuttgart.
Rud, D, Kunz, M, Schmietendorf, A. (2007) Dumke, R.:
Performance Analysis in WS-BPEL- Based
Infrastructures. In Proc. “23rd Annual UK
Performance Engineering Workshop” (UKPEW
2007), pp. 130-141.
Marzolla, M, Mirandola, R. (2007) Performance
Prediction of Web Service Workflows, Proc.
QoSA'07, Software Architectures, Components and
Applications Third International Conference on
Quality of Software Architectures, QoS A 2007,
Medford, MA, USA, July 11-13.
MDE4SI 2016 - Special Session on Model-Driven Enterprise Services and Applications for a Sustainable Interoperability: New Paradigms
for Development in the Future Enterprise - 2nd Edition
806
