
Shifts of Attention During Spatial Language Comprehension
A Computational Investigation
Thomas Kluth
1
, Michele Burigo
1
and Pia Knoeferle
2
1
Language & Cognition Group, CITEC (Cognitive Interaction Technology Excellence Cluster), Bielefeld University,
Inspiration 1, 33619 Bielefeld, Germany
2
Department of German Language and Linguistics, Humboldt University, Unter den Linden 6, 10099 Berlin, Germany
Keywords:
Spatial Language, Spatial Relations, Cognitive Modeling, Visual Attention.
Abstract:
(Regier and Carlson, 2001) have investigated the processing of spatial prepositions and developed a cognitive
model that formalizes how spatial prepositions are evaluated against depicted spatial relations between objects.
In their Attentional Vector Sum (AVS) model, a population of vectors is weighted with visual attention, rooted
at the reference object and pointing to the located object. The deviation of the vector sum from a reference
direction is then used to evaluate the goodness-of-fit of the spatial preposition. Crucially, the AVS model
assumes a shift of attention from the reference object to the located object. The direction of this shift has been
challenged by recent psycholinguistic and neuroscientific findings. We propose a modified version of the AVS
model (the rAVS model) that integrates these findings. In the rAVS model, attention shifts from the located
object to the reference object in contrast to the attentional shift from the reference object to the located object
implemented in the AVS model. Our model simulations show that the rAVS model accounts for both the data
that inspired the AVS model and the most recent findings.
1 INTRODUCTION
Imagine a household robot that helps you in the
kitchen. You might want the robot to pass you the
salt and instruct it as follows: “Could you pass me the
salt? It is to the left of the stove”. Here, the salt is the
located object (LO), because it should be located rela-
tive to the reference object (RO, the stove). To find the
salt, the robot should interpret this sentence the way
you meant it. In the interaction with artificial systems,
humans often need to instruct artificial systems to in-
teract with objects in their environment. To this end,
artificial systems need to interpret spatial language,
i.e., language that describes the locations of the ob-
jects of interest. To make the interaction as natural
as possible, artificial systems should understand spa-
tial language the way humans do it. The implementa-
tion of psychologically validated computational mod-
els of spatial language into artificial systems might
thus prove useful. With these kind of models, artifi-
cial systems could interpret and generate human-like
spatial language.
(Logan and Sadler, 1996) were the first to outline a
computational framework of the processes that are as-
sumed to take place when humans understand spatial
language. Their framework consists of “four different
kinds of processes: spatial indexing, reference frame
adjustment, spatial template alignment, and comput-
ing goodness of fit” (Logan and Sadler, 1996, p. 500).
Spatial indexing is required to bound the percep-
tual representations of the RO and the LO to their cor-
responding conceptual representations. According to
(Logan and Sadler, 1996, p. 499), “the viewer’s at-
tention should move from the reference object to the
located object”. Reference frame adjustment consists
of imposing a reference frame on the RO and setting
its parameters (origin, orientation, direction, scale).
“The reference frame is a three-dimensional coordi-
nate system [...]” (Logan and Sadler, 1996, p. 499).
Spatial template alignment is the process of impos-
ing a spatial template on the RO that is aligned with
the reference frame. A spatial template consists of re-
gions of acceptability of a spatial relation. Every spa-
tial relation is theorized to have its own spatial tem-
plate. Finally, computing goodness of fit is the evalu-
ation of the location of the LO in the aligned spatial
template.
Trying to identify possible nonlinguistic mecha-
nisms that underlie the rating of spatial prepositions,
(Regier and Carlson, 2001) developed a cognitive
Kluth T., Burigo M. and Knoeferle P.
Shifts of Attention During Spatial Language Comprehension - A Computational Investigation.
DOI: 10.5220/0005851202130222
In Proceedings of the 8th International Conference on Agents and Artificial Intelligence (ICAART 2016), pages 213-222
ISBN: 978-989-758-172-4
Copyright
c
2016 by SCITEPRESS – Science and Technology Publications, Lda. All rights reserved
213

model: the Attentional Vector Sum (AVS) model
1
.
This model – based on the assumption that goodness-
of-fit ratings for spatial prepositions against depicted
objects reflect language processing – accounts for a
range of empirical findings in spatial language pro-
cessing. A central mechanism in the AVS model con-
cerns the role of attention for the understanding of
spatial relations.
Direction of the Attentional Shift. Previous re-
search has shown that visual attention is needed to
process spatial relations ((Logan, 1994; Logan, 1995;
Logan and Sadler, 1996); see (Carlson and Logan,
2005) for a review). The AVS model has formal-
ized the role of visual attention. Although (Regier and
Carlson, 2001) do not explicitly talk about attentional
shifts, the AVS model can be interpreted as assuming
a shift of attention from the RO to the LO. (Regier and
Carlson, 2001) motivate the implementation of atten-
tion based on studies conducted by (Logan, 1994) and
(Logan, 1995, p. 115): “The linguistic distinction be-
tween located and reference objects specifies a direc-
tion for attention to move – from the reference object
to the located object.” (See also (Logan and Sadler,
1996, p. 499): “the viewer’s attention should move
from the reference object to the located object”). But
are humans actually shifting their attention in this di-
rection while they are understanding a spatial prepo-
sition?
Evidence for shifts of covert attention is pro-
vided by studies in the field of cognitive neuroscience
by Franconeri and colleagues (Roth and Franconeri,
2012; Franconeri et al., 2012). Using EEG, (Fran-
coneri et al., 2012) showed that humans shift their
covert attention when they process spatial relations.
In their first experiment, they presented four objects
of which two had the same shape but different colors.
Two objects were placed to the right and two objects
were placed to the left of a fixation cross such that two
different shapes appeared on each side of the cross.
Participants had to fixate the fixation cross and judge
whether, say, the orange circle was left or right of the
cyan circle. After the stimulus display was shown,
participants chose one spatial relation out of two pos-
sible arrangements on a response screen (cyan circle
left of orange circle or orange circle left of cyan cir-
cle). During the experiment, event-related potentials
were recorded. All experiments reported in (Fran-
coneri et al., 2012) revealed that participants shifted
their attention from one object to the other object, al-
1
Apart from the AVS model, a range of other computa-
tional models of spatial language processing were also pro-
posed (e.g., Cangelosi et al., 2005; Gapp, 1995; Kelleher,
Kruijff and Costello, 2006; Richter et al., 2014.)
though they had been instructed to attend to both ob-
jects simultaneously. However, the role of the direc-
tion of these shifts remained unclear in (Franconeri
et al., 2012).
In another experiment, (Roth and Franconeri,
2012) presented questions like “Is red left of green?”
to participants. Subsequently, either a red or a green
object appeared on the screen, followed shortly after-
wards (0-233ms) by a green or a red object respec-
tively. By manipulating the presentation order of the
objects, a shift of attention was cued. Participants
were faster to verify the question if the presentation
order was the same as the order in the question. (Roth
and Franconeri, 2012)interpreted this as evidence that
the perceptual representation of a spatial relation fol-
lows its linguistic representation.
Evidence that a shift of attention from the RO to
the LO as suggested in the AVS model is not nec-
essary for understanding spatial language has been
recently reported by (Burigo and Knoeferle, 2015),
who conducted a visual world study. Here, partici-
pants inspected a display and listened to spoken ut-
terances while their eye movements were recorded.
Note that (Burigo and Knoeferle, 2015) investigated
overt attention – unlike (Franconeri et al., 2012) and
(Roth and Franconeri, 2012) who studied covert at-
tention. (Burigo and Knoeferle, 2015) presented sen-
tences with two German spatial prepositions (
¨
uber
[above] and unter [below]) across four different tasks.
The RO and the LO of the sentence as well as a com-
petitor object (not mentioned in the sentence) were
presented on a computer screen. In their first ex-
periment, participants verified the spatial sentence as
quickly as possible, even before the sentence ended.
In their second experiment, participants also verified
the sentence, but they had to wait until the sentence
was over. The third experiment consisted of a pas-
sive listening task, i.e., no response was required from
the participants. Finally, in the fourth experiment, a
gaze-contingent trigger was used: the competitor ob-
ject and either the LO or the RO was removed from
the display after participants had inspected the LO at
least once.
The results from this study revealed that partici-
pants shifted their overt attention from the RO to the
LO, as predicted by the AVS model. However, the
task modulated the presence of these shifts. These
shifts were only frequent in the post-sentence verifi-
cation experiment (experiment 2), but infrequent in
the other experiments. Crucially, if participants did
not shift their attention from the RO to the LO, they
performed equally well (as accuracy was not affected)
– i.e., they were able to understand the sentence with-
out shifting their attention from the RO to the LO.
ICAART 2016 - 8th International Conference on Agents and Artificial Intelligence
214
By contrast, participants frequently shifted gaze
overtly from the LO towards the RO (in line with the
incremental interpretation of the spoken sentence).
This suggested that people may be able to apprehend
a spatial relation with an overt attentional shift from
the LO to the RO (and not from the RO to the LO as
suggested by the AVS model).
Thus, the direction of the attentional shift as im-
plemented in the AVS model conflicts with recent
empirical findings. We propose a modified version
of the AVS model: the reversed AVS (rAVS) model,
where the attentional shift has been reversed. Instead
of a shift from the RO to the LO, we implemented a
shift from the LO to the RO. We designed the rAVS
model otherwise to be as similar as possible to the
AVS model. By doing so, we can compare the influ-
ence of the reversed shift on the performance of the
two models.
2 THE MODELS
In this section, we first describe the AVS model, since
the proposed rAVS model is based on the structure of
the AVS model and modifies some parts of it. Next,
we introduce the rAVS model.
2.1 The AVS Model
(Regier and Carlson, 2001) proposed a cognitive
model of spatial term comprehension: the Attentional
Vector Sum (AVS) model. The AVS model takes
the 2D-location and the 2D-shape of a RO, the 2D-
location of a LO, and a spatial preposition as input
and computes an acceptability rating (i.e., how well
the preposition describes the location of the LO rel-
ative to the RO). In the following, we are presenting
how the AVS model processes the spatial relation be-
tween the RO and the LO and how it computes the
acceptability rating. The AVS model consists of two
components: The angular component and the height
component. Figures 1(a)-1(c) depict the angular com-
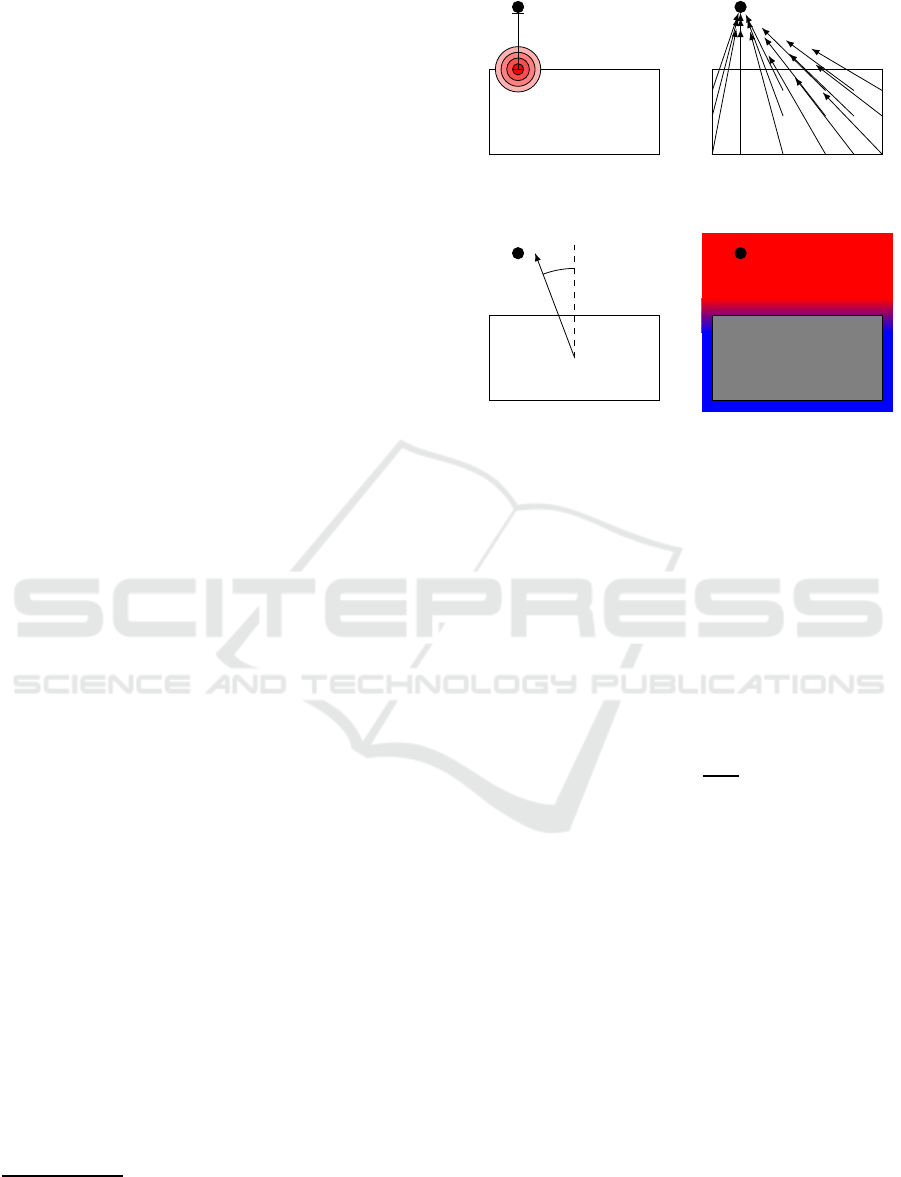
ponent which we describe first. Figure 1(d) visualizes
the height component that we describe thereafter.
Angular Component. First, the AVS model defines
the focus F of a distribution of visual attention as
the point on top of the RO “that is vertically aligned
with the trajector [LO] or closest to being so aligned”
2
(Regier and Carlson, 2001, p. 277). Next, the model
2
In the case of other prepositions, the corresponding part
of the RO is chosen for the location of the focus (e.g., the
focus lies on the bottom of the RO for below).
LO
RO
σ
F
(a) Attentional Distribution.
Darker color means higher
amount of attention.
(b) Vectors weighted with at-
tention and pointing to the LO.
δ
(c) Deviation of the final vec-
tor from canonical upright. The
final vector does not necessarily
point to the LO, because it is the
weighted sum of all vectors in
Figure 1(b).
(d) Height Component. Red
means a value of 1 and blue
means a value of 0. The height
component modulates the out-
come of the angular component
with respect to the y-coordinate
of the LO: A 0 results in a low
rating, a 1 does not change the
output of the angular compo-
nent.
Figure 1: Schematized steps of the AVS model developed
by (Regier and Carlson, 2001).
defines the distribution of attention on every point i of
the RO as follows (see Figure 1(a) for visualization):
a
i
= exp
−d
i
λ· σ
(1)
Here, d
i
is the euclidean distance between RO
point i and the attentional focus F, σ is the euclidean
distance between the attentional focus F and the LO,
and λ is a free parameter. The resulting distribution of
attention is highest at the focal point F and declines
exponentially with greater distance from F (see Fig-
ure 1(a)). Furthermore, the distance σ of the LO to
the RO as well as the free parameter λ affect the width
of the attentional distribution: A close LO results in a
more focused attentional distribution (a large decline
of attention from point F) whereas a distant LO re-
sults in a more broad attentional distribution (a small
decline of attention from point F).
In the next step, vectors v
i
are rooted at every
point i of the RO. All vectors are pointing to the LO
and are weighted with the amount of attention a
i
that
was previously defined (see Figure 1(b)). All these
vectors are summed up to obtain a final vector:
Shifts of Attention During Spatial Language Comprehension - A Computational Investigation
215
# »
direction =
∑
i∈RO
a
i
·
#»
v
i
(2)
The deviation δ of this final vector to canonical
upright (in the case of above) is measured (see Fig-
ure 1(c)) and used to obtain a rating with the help of
the linear function g(δ) that maps high deviations to
low ratings and low deviations to high ratings:
g(δ) = slope· δ + intercept (3)
Both, slope and intercept, are free parameters and
δ is the angle between the sum of the vectors and
canonical upright (in the case of above):
δ = ∠(
# »
direction, upright) (4)
Height Component g(δ) is the last step of the an-
gular component. This value is then multiplied with
the height component. The height component weights
the angular component with the elevation of the LO
relative to the top of the RO. It is defined as follows:
height(y
LO
) =
sig(y
LO
− hightop, highgain) + sig(y
LO
− lowtop, 1)
2
(5)
Here, highgain is a free parameter, hightop (or
lowtop) is the highest y-coordinate of the highest (or
lowest) point on top of the RO, and the sig(·, ·) func-
tion is defined as:
sig(x, gain) =
1
1+ exp(gain· (−x))
(6)
The AVS model has four free parameters in total:
λ, slope,intercept, highgain. Taken together, the final
acceptability rating is computed by the AVS model
with the following formula:
above(LO, RO) = g(δ) · height(y
LO
) (7)
2.2 The rAVS Model
Although (Regier and Carlson, 2001) do not explic-
itly mention shifts of attention, the AVS model can
be interpreted as assuming a shift of attention from
the RO to the LO: This shift is implemented by the
location of the attentional focus and in particular by
the direction of the vectors (see Figs. 1(a)- 1(c)). As
discussed before, this direction of the attentional shift
conflicts with recent empirical findings (Burigo and
Knoeferle, 2015; Roth and Franconeri, 2012; Fran-
coneri et al., 2012). This is why our modified version
of the AVS model, the reversed AVS (rAVS) model,
implements a shift from the LO to the RO.
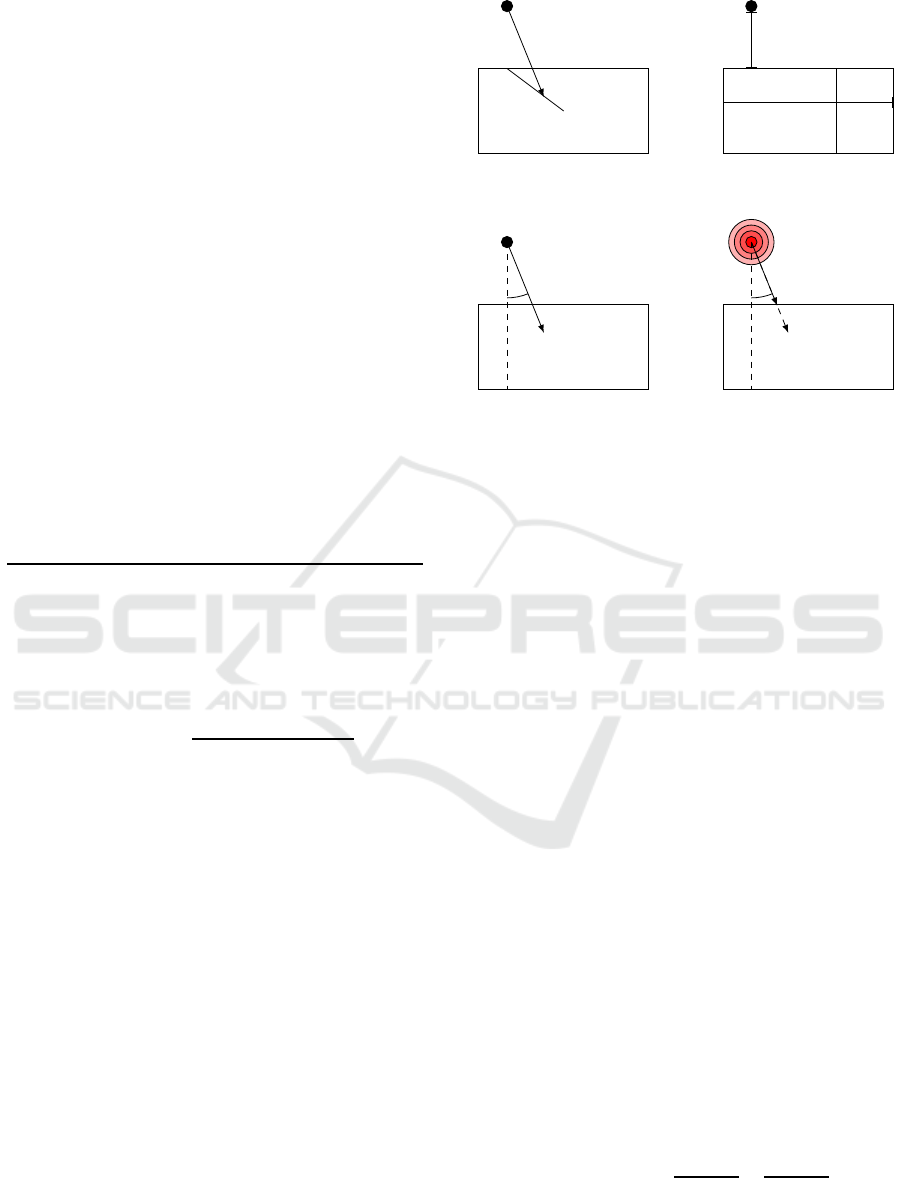
C
D
F
(a) Vector destination lies
always on the line that con-
nects C and F.
d
abs
w
h
(b) Relative distance: Ab-
solute distance divided by
the size of the RO.
δ
(c) Deviation from canoni-
cal downwards.
δ
(d) The attentional distribu-
tion does not change the de-
viation.
Figure 2: Schematized steps of the rAVS model.
To this end, the rAVS model reverses the direction
of the vectors in the vector sum in the following way:
Instead of pointing from every point in the RO to the
LO, the vectors are pointing from every point in the
LO to the RO. Since the LO is simplified as a single
point in the AVS model, the vector sum in the rAVS
model consists of only one vector. The end point of
this vector, however, must be defined, since the RO
has a mass.
In the rAVS model, the vector end point D lies
on the line between the center-of-mass C of the RO
and the proximal point F (see Figure 2(a)). Here, F
is the same point as the attentional focus in the AVS
model. Depending on the relative distance of the LO,
the vector end point D is closer to C (for distant LOs)
or closer to F (for close LOs). Thus, the center-of-
mass orientation is more important for distant LOs,
whereas the proximal orientation becomes important
for close LOs, which corresponds to the rating pattern
found by (Regier and Carlson, 2001, experiment 7).
The width of the attentional distribution in the AVS
model has a similar effect.
In the rAVS model, the distance of a LO is consid-
ered in relative terms, i.e., the width and height of the
RO change the relative distance of a LO, even if the
absolute distance remains the same (see Figure 2(b)).
The relative distance is computed as follows:
d
rel.
(LO, RO) =
|LO, P|
x
RO
width
+
|LO, P|
y
RO
height
(8)
Here, P is the proximal point in the intuitive sense:
The point on the RO that has the smallest absolute
ICAART 2016 - 8th International Conference on Agents and Artificial Intelligence
216

distance to the LO. F is guaranteed to lie on top of
the RO, whereas P can also be at the left, right, or
bottom of the RO. If P is on top of the RO, P equals
F.
Furthermore, the computation of the vector end
point D is guided with an additional free parameter
α (with α ≥ 0). The new parameter α and the relative
distance interact within a linear function to obtain the
new vector destination D. Here is the corresponding
formula:
D =
(
# »
LO,C + (−α · d
rel.
+ 1) ·
# »
CF if (−α· d
rel.
+ 1) > 0
C else
(9)
The direction of the vector
# »
LO, D is finally com-
pared to canonical downwards instead of canonical
upright (in the case of above, see Figure 2(c)) – simi-
lar to the angular component of the AVS model:
δ = ∠(
# »
LO, D, downwards) (10)
As in the AVS model, this angular deviation is
then used as input for the linear function g(δ) (see
equation 3) to obtain a value for the angular compo-
nent. Note that a comparison to downwards is mod-
eled, although the preposition is above. (Roth and
Franconeri, 2012, p. 7) also mention this “counter-
intuitive, but certainly not computationally difficult”
flip of the reference direction in their account.
In the rAVS model, the attentional focus lies on
the LO. In fact, however, the location of the atten-
tional focus as well as the attentional distribution do
not matter for the rAVS model, because its weighted
vector sum consists of only one single vector (due to
the simplified LO). Since the length of the vector sum
is not considered in the computation of the angle (nei-
ther in the AVS nor in the rAVS model), the amount
of attention at the vector root is not of any importance
for the final rating (as long as it is greater than zero,
see Figure 2(d)).
3
The height component of the AVS model is not
changed in the rAVS model. So, it still takes the y-
value of the LO as input and computes the height ac-
cording to the grazing line of the RO (see equation 5).
The final rating is obtained by multiplying the height
component with the angular component:
above(LO, RO) = g(δ) · height(y
LO
) (11)
3
Therefore, the rAVS model does not need to compute
a vector sum nor does it rely on an underlying attentional
distribution and thus has a lower computational complexity.
This lower computational complexity, however, originates
from the simplification of the LO. Accordingly, these con-
siderations are also only valid for simplified LOs.
3 MODEL COMPARISON
In the previous section, we have presented the AVS
model by (Regier and Carlson, 2001) and proposed
the rAVS model, since the AVS model conflicts with
recent empirical findings regarding the direction of
the attentional shift (Burigo and Knoeferle, 2015;
Franconeri et al., 2012; Roth and Franconeri, 2012).
But how does the rAVS model perform in comparison
to the AVS model?
(Regier and Carlson, 2001) conducted seven ex-
periments and showed that the AVS model was able to
account for all empirical data from these experiments.
We evaluated the rAVS model on the same data set to
assess its performance. Before we present the results,
we briefly introduce the method that we applied.
3.1 Method
To assess the two models, we fitted them to the data
(Regier and Carlson, 2001) used to evaluate the AVS
model: the data from seven acceptability rating tasks
conducted by (Regier and Carlson, 2001). These data
consist of acceptability ratings for 337 locations of
the LO above 10 different types of ROs.
4
We fit-
ted both models to these data by minimizing the Root
Mean Square Error (RMSE). To this end, we used a
method knownas simulated annealing, a variant of the
Metropolis algorithm (Metropolis et al., 1953). This
method estimates the parameters of the model in or-
der to minimize the RMSE and has the advantage to
not get stuck in local minima. The found RMSE gives
us a Goodness-Of-Fit (GOF) value.
Since more complex models might obtain a bet-
ter GOF value just because of their complexity (Pitt
and Myung, 2002), we also applied a cross-validation
method that takes model complexity into account:
the simple hold-out (SHO) method described in
(Schultheis et al., 2013). (Schultheis et al., 2013)
showed that this method performs very well in com-
parison to other model comparison methods. In the
SHO method, the data set is split into a training and
a test set. Model parameters are estimated on the
training set and used to compute a prediction error
(RMSE) on the test set. This is done several times
with different, random splits of the data. The median
of the prediction error is the final outcome of the SHO
method.
The results presented here were computed with
101 iterations of the SHO method. In each itera-
tion 70% of the data was used as training data and
4
We thank Terry Regier and Laura Carlson for sharing
these data.
Shifts of Attention During Spatial Language Comprehension - A Computational Investigation
217
0.65
0.66
0.67
0.68
0.69
0.7
0.71
0.72
0.73
AVS rAVS
RMSE / prediction error
SHO
GOF
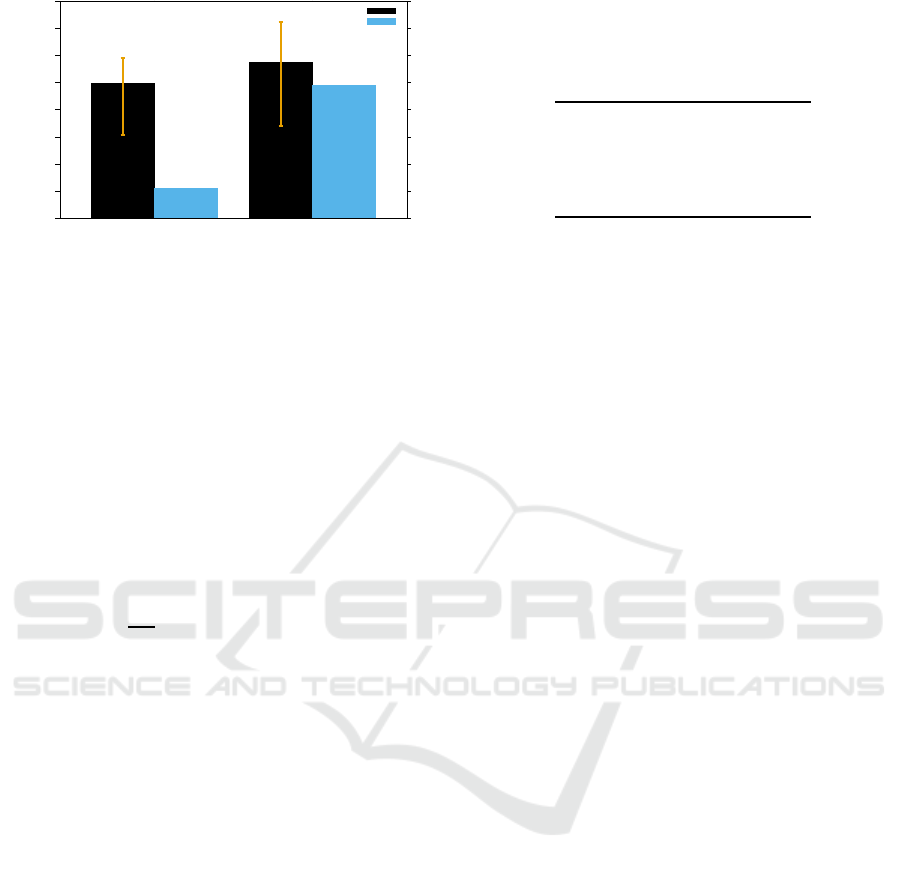
Figure 3: GOF and SHO results for the AVS and the rAVS
model for fitting all data from (Regier and Carlson, 2001).
Error bars show 95% confidence intervals computed with
100,000 bootstrap samples.
30% was used as test data. Moreover, we com-
puted 95% confidence intervals of the SHO median
by using 100,000 bootstrap samples with the help of
the
boot
package for
R
(Canty and Ripley, 2015).
Both models and the data fitting methods were imple-
mented in
C++
with the help of the
Computational
Geometry Algorithms Library
(cga). The source
code is available from (Kluth, 2016). We constrained
the range of the model parameters for both the GOF
and the SHO computation in the following way:
−1
45
≤ slope ≤ 0 (12)
0.7 ≤ intercept ≤ 1.3 (13)
0 ≤ highgain ≤ 10 (14)
0 < λ ≤ 5 (15)
0 < α ≤ 5 (16)
3.2 Results
Figure 3 shows the GOF and SHO results for fitting
both models to all data from (Regier and Carlson,
2001). The model parameters for the plotted GOFs
can be found in Table 1. First of all, both models
are able to account for the data very closely as is evi-
dent from the overall low RMSE. A RMSE of 0 would
mean that both models can produce the exact empir-
ical data. The theoretically worst possible RMSE of
9 means that model and data are maximally different.
This worst value is 9 because (Regier and Carlson,
2001) used a rating scale from 0 to 9. Consider rating
data where humans rated all LOs with a 9. The model,
however, computes only 0s. This would then result in
the worst possible RMSE of 9.
The rAVS model has a slightly worse GOF value,
but the value is still very low and only shows a small
difference (< 0.04) to the GOF value of the AVS
model. In light of the problems with using GOF
Table 1: Values of the model parameters and RMSE to
achieve the GOF shown in Figure 3. The λ parameter of
the rAVS model does not change the output of the rAVS
model, see footnote 3.
AVS rAVS
slope -0.005 -0.004
intercept 0.973 0.943
highgain 0.083 7.497
λ 0.189 (1.221)
α – 0.322
RMSE 0.661 0.699
measures discussed by (Pitt and Myung, 2002) and
(Roberts and Pashler, 2000), this small difference in
the GOF remains inconclusive. Moreover, the GOF
values itself change slightly with each new estimation
due to the random nature of the parameter estimation
method. The most important conclusion one can draw
from the GOF values is whether the models are able to
fit the data at all. Assessing the relative performance
of more than one model solely with their GOF, how-
ever, should be done very carefully.
The SHO values, on the other hand, are suitable to
compare the performance of two or more models. In
our case, both models obtain similar SHO values with
overlapping confidence intervals for the SHO values.
That is, both models perform equally well and can-
not be distinguished on these data. Accordingly, both
directions of the attentional shift are equally well sup-
ported by these model simulations.
3.3 Discussion
Although our model simulations do not result in the
support of one of the two shifts in question, they rise
the question to which degree the attentional shift from
the RO to the LO as theorized by (Logan, 1995) and
(Logan and Sadler, 1996) is the only shift that is im-
plicated in the processing of spatial relations. The re-
sults from (Burigo and Knoeferle, 2015) suggest that
humans perform both shifts, but that the shift from
the LO to the RO alone (as in the rAVS model) can
be enough to apprehend the spatial relation between
the objects. The shift back (from the RO to the LO)
could be a way to double-check the goodness-of-fit
of the spatial preposition. Our results support this by
showing that the rAVS model – that assumes only the
shift from the LO to the RO – can account for the data
from (Regier and Carlson, 2001).
ICAART 2016 - 8th International Conference on Agents and Artificial Intelligence
218

4 CONCLUSION
We proposed a new cognitive model for spatial lan-
guage understanding: the rAVS model. This model
is based on the AVS model by (Regier and Carl-
son, 2001) but integrates recent psycholinguistic and
neuroscientific findings (Burigo and Knoeferle, 2015;
Franconeri et al., 2012; Roth and Franconeri, 2012)
that conflict with the assumption of the direction of
the attentional shift in the AVS model. In the AVS
model, attention shifts from the RO to the LO; in the
rAVS model, attention shifts from the LO to the RO.
We assessed both models using the data from (Regier
and Carlson, 2001) and found that both models per-
form equally well. Accordingly, our model simula-
tions do not favor any of the two models and thus, do
also not favor any of the two directionalities of the
attentional shift.
Theoretical Contribution. (Regier and Carlson,
2001) developedthe AVS model with the goal to iden-
tify possible nonlinguistic mechanisms that underlie
spatial term rating. To this end, they implemented two
independent observations in the AVS model: First,
the importance of attention to understand spatial re-
lations and second, the neuronal representation of a
motor movement as a vector sum. So, the main goal
of the AVS model was not to examine the direction of
the shift of attention but rather to describe linguistic
processes with nonlinguistic mechanisms.
Although the focus of the AVS model was not on
the direction of the attentional shift, the model implies
a shift from the RO to the LO. (Regier and Carlson,
2001) motivated the use of a vector sum because it
seems to be a widely used representation of direction
in the brain. (Georgopoulos et al., 1986) found that
the direction of an arm movement of a rhesus monkey
can be predicted by a vector sum of orientation tuned
neurons. (Lee et al., 1988) found a similar represen-
tation for saccadic eye movements. Eye movements
(overt attention) are motor movements that are closely
connected to covert visual attention: “Many studies
have investigated the interaction of overt and covert
attention, and the order in which they are deployed.
The consensus is that covert attention precedes eye
movements [...].” (Carrasco, 2011, p. 1487) Although
the authors of the AVS model do not explicitly speak
about which movement the vector sum in their model
represents nor do they clearly specify the kind of at-
tention in the model, it seems reasonable to interpret
the direction of the vector sum in the AVS model as
the direction of a shift of attention that goes from the
RO to the LO.
Our aim is to implement the most recent findings
of attentional mechanisms into the AVS model. To
this end, we designed the rAVS model as similar as
possible to the AVS model. So, the rAVS model fol-
lows the same basic concepts whilst it integrates the
most recent findings. We do not claim that the non-
linguistic mechanisms proposed in the AVS model do
not happen – rather, we propose an alternate way how
they might take place. Keeping the same basic con-
cepts as the AVS model, the rAVS model accounts
for the same data equally well – and also for the re-
cent empirical findings regarding the direction of the
attentional shift.
Model Complexity. Due to the simplification of the
LO as a single dot, the vector sum in the rAVS model
consists of only one vector, i.e., there is no population
of vectors to be processed. This drastically reduces
the time needed for computation.
The attentional distribution in combination with
the vector sum are giving the AVS model a high
amount of flexibility (the flexibility of a model
is strongly connected to its complexity, (Pitt and
Myung, 2002)). While a cognitive model should be
flexible enough to account for individual differences,
it should not be too flexible. A model that is too flex-
ible could otherwise fit data that humans would never
generate (see (Roberts and Pashler, 2000), for a thor-
ough discussion of this issue).
5
The flexibility of the AVS model (stemming from
the complex interplay of the attentional distribution
and the vector sum) makes it hard to analyze the AVS
model: It is often not easy to determine the influence
of, say, the relative distance of the LO to the RO on the
behavior of the model. This is particular true if one
considers different values of the model parameters.
The rAVS model, on the other hand, has clear for-
mulations for the relative distance that do not change
in their qualitative behavior with different sets of pa-
rameters. Still, the rAVS model shows the same per-
formance as the AVS model on the data from (Regier
and Carlson, 2001).
Note that the lower computational complexity of
the rAVS model arises from the simplification of the
LO. Conceptually, the rAVS model also computes an
attentional vector sum that points from the LO to the
RO. Thus, the discussion of the model flexibility is
only valid for rating data that was collected with a
simplified LO (as the data from (Regier and Carlson,
2001)). A more comprehensive model of spatial lan-
guage should also represent the LO in more detail
(see Future Work). It remains to be seen whether or
5
However, it could be that the human cognitive pro-
cesses can only be described with a flexible model (simply
because they are complex).
Shifts of Attention During Spatial Language Comprehension - A Computational Investigation
219

not a model with a single vector can also account for
the processing of spatial relations when the LO has a
mass.
4.1 Future Work
Modeling Both Shifts. The success of both the
rAVS model and the AVS model support the exis-
tence of both directionalities of the attentional shift. It
might well be that people shift their attention in both
directions during the processing of spatial relations –
depending on the task and the linguistic input. Ac-
cordingly, a model that implements both attentional
shifts might fit more data than the AVS or the rAVS
model.
6
It might be interesting to investigate this possi-
bility by creating a model that allows both shifts of
attention. Such model should be applicable to more
types of experimental data than the AVS model and
the rAVS model (which both can only account for ac-
ceptability rating data). In particular, the model with
both shifts should also specify when in time what type
of attentional shift occurs and how long the computa-
tion takes. This model could then be fitted to a greater
range of data, like real-time eye movement data from
visual world studies (e.g., (Burigo and Knoeferle,
2015)) or reaction time data (e.g., (Roth and Fran-
coneri, 2012)). Modeling different tasks would give
more insight into the role of the attentional shift.
Modeling the LO. The reason for the lower com-
putational complexity of the rAVS model is the sim-
plification of the LO as a single point (this was done
to keep the rAVS model as close as possible to the
AVS model). There is evidence, however, that geo-
metric features of the LO also affect acceptability rat-
ings (Burigo and Sacchi, 2013; Burigo, 2008; Burigo
et al., ress). A comprehensive model of spatial lan-
guage thus should also model the LO in more detail.
Accordingly, we are planning to extend the represen-
tation of the LO in the rAVS model by giving a mass
to it. This would give us the opportunity to see first
how the rAVS model deals with the situation where
the computation of a vector sum is necessary to deter-
mine the angular deviation. Second, this changes the
role of the attentional distribution in the rAVS model.
We are also planning to change the use of the
height component in the rAVS model. At the mo-
ment, the rAVS model applies the same computation
as the AVS model for the height component: the y-
coordinate of the LO is compared relative to the top
6
We thank an anonymous reviewer for suggesting this
idea.
of the RO (see Fig. 1(d)). In the rAVS model, the at-
tentional focus is located on the LO. So, it would be
more consistent if the location of the LO is taken as
the baseline for the comparison with the location of
the RO. Thus, we want to reverse the computation of
the height component such that the grazing line lies
on the bottom of the LO.
Model Distinction. To tease apart the two models
and evaluate the accuracy of their predictions, we
are currently analyzing the models with an algorithm
called Parameter Space Partitioning (PSP) proposed
by (Pitt et al., 2006; Kim et al., 2004). The PSP algo-
rithm is a Markov chain Monte Carlo (MCMC) based
method and searches in the parameter space of the
models for regions of patterns that are qualitatively
different. First results confirm the high flexibility of
the AVS model (i.e., the AVS model is able to gen-
erate many patterns that are qualitatively different by
using different sets of parameters). The rAVS model,
however, generates fewer patterns with a qualitative
difference.
The PSP analysis seems to confirm that the two
models make different predictions for the displays un-
der consideration. We are planning an empirical rat-
ing study that tests these different predictions. With
the data collected in this study, we should be able to
distinguish which model makes more accurate predic-
tions.
We are also planning to further compare the two
models with both versions of the parametric boot-
strap crossfitting method (Wagenmakers et al., 2004;
Navarro et al., 2004).
Functionality. The AVS model does not account
for any effects of the functionality of objects on spa-
tial language comprehension, although there is evi-
dence that – beside purely geometric effects – func-
tional interactions between objects also affect the
use of spatial prepositions (Carlson-Radvansky et al.,
1999; Coventry et al., 2001; H¨orberg, 2008; Carlson
et al., 2006; Coventry et al., 2010; Coventry and Gar-
rod, 2004).
For instance, (Carlson-Radvansky et al., 1999)
conducted an object placement task, where partici-
pants had to place a toothpaste tube above a tooth-
brush. They showed that the toothpaste tube was not
placed abovethe center-of-mass of the toothbrush, but
rather above the bristles of the toothbrush – that is, at
the location where both objects can functionally inter-
act. Objects with a smaller amount of functional in-
teraction (here, a tube of oil paint) were placed more
above the center-of-mass of the toothbrush instead
over the bristles.
ICAART 2016 - 8th International Conference on Agents and Artificial Intelligence
220

Despite this evidence, the AVS model (and thus
also our rAVS model) only considers geometric repre-
sentations of the RO and the LO. For the AVS model,
however, a range of extensions that integrate func-
tionality were already proposed (Carlson et al., 2006;
Kluth and Schultheis, 2014). Since the rAVS model
is designed to be as similar as possible to the AVS
model, these functional extensions might also be ap-
plicable for the rAVS model.
Implementing the Models in Artificial Systems.
In order to implement these models into artificial sys-
tems, additional steps are necessary. The models were
designed to model spatial language understanding.
So, the models produce an acceptability rating given
a RO, a LO, and a preposition. As part of an artifi-
cial system that interprets spatial language, the mod-
els can be used straightforwardly: Given a spatial ut-
terance and a visual scene, the models can be used
to compute acceptability ratings for all points around
the RO (i.e., a spatial template). The artificial system
then starts the search for the LO at the point with the
highest rating.
To generate spatial language with the help of
these models, one could imagine the following steps:
Compute the acceptability ratings of different spatial
prepositions (e.g., above, below, to the left of, in front
of, ...) and subsequently pick the one with the highest
rating.
In conclusion, we proposed a modified version of
the AVS model: the rAVS model. The rAVS model
accounts for the same empirical data as the AVS
model while integrating additional recent findings re-
garding the direction of the attentional shift that con-
flict with the assumptions of the AVS model.
ACKNOWLEDGEMENTS
This research was supported by the Cluster of Ex-
cellence Cognitive Interaction Technology ‘CITEC’
(EXC 277) at Bielefeld University, which is funded
by the German Research Foundation (DFG). The au-
thors would also like to thank two anonymous review-
ers for their useful comments and suggestions.
REFERENCES
Burigo, M. (2008). On the role of informativeness in spa-
tial language comprehension. PhD thesis, School of
Psychology, University of Plymouth.
Burigo, M., Coventry, K. R., Cangelosi, A., and Lynott, D.
(in press). Spatial Language and Converseness. Quar-
terly Journal of Experimental Psychology.
Burigo, M. and Knoeferle, P. (2015). Visual attention
during spatial language comprehension. PloS ONE,
10(1):e0115758.
Burigo, M. and Sacchi, S. (2013). Object orientation affects
spatial language comprehension. Cognitive Science,
37(8):1471–1492.
Canty, A. and Ripley, B. (2015). boot: Bootstrap R (S-Plus)
Functions. R package version 1.3-15.
Carlson, L. A. and Logan, G. D. (2005). Attention and spa-
tial language. In Itti, L., Rees, G., and Tsotsos, J. K.,
editors, Neurobiology of Attention, chapter 54, pages
330–336. Elsevier.
Carlson, L. A., Regier, T., Lopez, W., and Corrigan, B.
(2006). Attention unites form and function in spa-
tial language. Spatial Cognition and Computation,
6(4):295–308.
Carlson-Radvansky, L. A., Covey, E. S., and Lattanzi, K. M.
(1999). What effects on where: Functional influ-
ences on spatial relations. Psychological Science,
10(6):516–521.
Carrasco, M. (2011). Visual attention: The past 25 years.
Vision Research, 51(13):1484–1525.
CGAL, Computational Geometry Algorithms Library.
http://www.cgal.org.
Coventry, K. R. and Garrod, S. C. (2004). Saying, seeing,
and acting: The psychological semantics of spatial
prepositions. Essays in cognitive psychology. Psy-
chology Press, Taylor and Francis, Hove and New
York.
Coventry, K. R., Lynott, D., Cangelosi, A., Monrouxe, L.,
Joyce, D., and Richardson, D. C. (2010). Spatial
language, visual attention, and perceptual simulation.
Brain and Language, 112(3):202–213.
Coventry, K. R., Prat Sala, M., and Richards, L. (2001). The
interplay between geometry and function in the com-
prehension of over, under, above, and below. Journal
of Memory and Language, 44(3):376–398.
Franconeri, S. L., Scimeca, J. M., Roth, J. C., Helseth, S. A.,
and Kahn, L. E. (2012). Flexible visual processing of
spatial relationships. Cognition, 122(2):210–227.
Georgopoulos, A. P., Schwartz, A. B., and Kettner, R. E.
(1986). Neuronal Population Coding of Movement
Direction. Science, 233:1416–1419.
H¨orberg, T. (2008). Influences of form and function on
the acceptability of projective prepositions in swedish.
Spatial Cognition & Computation, 8(3):193–218.
Kim, W., Navarro, D. J., Pitt, M. A., and Myung, I. J.
(2004). An MCMC-based method of comparing con-
nectionist models in cognitive science. Advances in
Neural Information Processing Systems, 16:937–944.
Kluth, T. (2016). A C++ Implementation of the reversed
Attentional Vector Sum (rAVS) model.
Kluth, T. and Schultheis, H. (2014). Attentional distribu-
tion and spatial language. In Freksa, C., Nebel, B.,
Hegarty, M., and Barkowsky, T., editors, Spatial Cog-
nition IX, volume 8684 of Lecture Notes in Computer
Shifts of Attention During Spatial Language Comprehension - A Computational Investigation
221

Science, pages 76–91. Springer International Publish-
ing.
Lee, C., Rohrer, W. H., and Sparks, D. L. (1988). Popula-
tion coding of saccadic eye movements by neurons in
the superior colliculus. Nature, 332:357–360.
Logan, G. D. (1994). Spatial attention and the appre-
hension of spatial relations. Journal of Experimen-
tal Psychology: Human Perception and Performance,
20(5):1015.
Logan, G. D. (1995). Linguistic and conceptual control
of visual spatial attention. Cognitive Psychology,
28(2):103–174.
Logan, G. D. and Sadler, D. D. (1996). A computational
analysis of the apprehension of spatial relations. In
Bloom, P., Peterson, M. A., Nadel, L., and Garrett,
M. F., editors, Language and Space, chapter 13, pages
493–530. The MIT Press.
Metropolis, N., Rosenbluth, A. W., Rosenbluth, M. N.,
Teller, A. H., and Teller, E. (1953). Equation of state
calculations by fast computing machines. The journal
of chemical physics, 21(6):1087–1092.
Navarro, D. J., Pitt, M. A., and Myung, I. J. (2004). Assess-
ing the distinguishability of models and the informa-
tiveness of data. Cognitive Psychology, 49(1):47–84.
Pitt, M. A., Kim, W., Navarro, D. J., and Myung, J. I.
(2006). Global model analysis by parameter space
partitioning. Psychological Review, 113(1):57.
Pitt, M. A. and Myung, I. J. (2002). When a good fit can be
bad. Trends in cognitive sciences, 6(10):421–425.
Regier, T. and Carlson, L. A. (2001). Grounding spatial lan-
guage in perception: An empirical and computational
investigation. Journal of Experimental Psychology:
General, 130(2):273–298.
Roberts, S. and Pashler, H. (2000). How persuasive is a
good fit? A comment on theory testing. Psychological
review, 107(2):358–367.
Roth, J. C. and Franconeri, S. L. (2012). Asymmetric cod-
ing of categorical spatial relations in both language
and vision. Frontiers in Psychology, 3(464).
Schultheis, H., Singhaniya, A., and Chaplot, D. S. (2013).
Comparing model comparison methods. In Proceed-
ings of the 35th Annual Conference of the Cognitive
Science Society, pages 1294 – 1299, Austin, TX. Cog-
nitive Science Society.
Wagenmakers, E.-J., Ratcliff, R., Gomez, P., and Iverson,
G. J. (2004). Assessing model mimicry using the para-
metric bootstrap. Journal of Mathematical Psychol-
ogy, 48(1):28–50.
ICAART 2016 - 8th International Conference on Agents and Artificial Intelligence
222
