
A Reference Architecture for Mobile Crowdsensing Platforms
Herbertt B. M. Diniz, Emanoel C. G. F. Silva, Thomas C. C. Nogueira and Kiev Gama
Centro de Informatica, Universidade Federal de Pernambuco (CIn/UFPE), Av. Jorn. Anibal Fernandes, Recife, Brazil
Keywords:
Smart Cities, Complex Event Processing, Software Architecture, Crowdsensing.
Abstract:
Many software solutions today rely on systems that integrate and analyze city data gathered from different
sources (sensors and information systems) in real-time. Thanks to smartphones, citizens can act as smart
sensors collecting city data in what is being called mobile crowdsensing (MCS). The literature that explores
systems in that area, typically present high-level software architectures without much detail about their im-
plementation or feasibility. With the intention of offer a straightforward and easy-to-follow reference archi-
tecture, this paper presents an approach that employs off-the-shelves components for the construction of an
MCS platform for participatory sensing solutions in Smart Cities. We demonstrate an implementation of that
architecture in a specific domain.
1 INTRODUCTION
As a consequence of problems resulting from pop-
ulation growth in cities, many technologies are be-
ing used for urban monitoring (Odendaal, 2003), in-
fluencing the way we are interacting with the urban
spaces that are becoming more chaotic, due to the
swelling population. Smart Cities (Naphade et al.,
2011) is a term that gained traction in academia, busi-
ness and government to describe cities that, on the
one hand, are increasingly composed and monitored
by pervasive and ubiquitous computing. Many soft-
ware systems in that context seek to integrating vari-
ous sources of information technologies (ICTs), tak-
ing into account a holistic view of the city and cen-
tralized monitoring and control to aid in supporting
decision making (Ganti et al., 2011).
These sources of ICTs form complex structures
(Nagel et al., 2014), and generate a large volume
of data, which present enormous challenges and op-
portunities, hindering the possibility to provide pro-
grams that integrate sensor information and that cap-
ture from the physical space, taking samples of what
is happening in real-time. It is necessary to integrate
easily data from different sources, and also consider
additional sources, such as people providing informa-
tion in a collaborative way.
The usage of FLOSS (Freely Licensed Open
Source Software) combined with COTS (Commercial
Off-The-Shelf ) allows the creation of cost-effective
solutions with little implementation effort. From a
business perspective, Gasperoni (Gasperoni, 2006)
elaborates on the use of FLOSS and COTS offering
numerous advantages, such as software quality and
speed of evolution.
However, when analyzing the literature on Smart
Cities, there is a lack of detailed information on
how these types software architectures implemented.
Even when looking into particular types of smart
cities (sub)systems, such as those focused on Mobile
Crowdsensing, there is only shallow evidence on soft-
ware design and almost absent evidence on the effec-
tive usage of FLOSS and COTS components in that
context.
Aiming to provide a reference architecture and
implementation of Mobile Crowdsensing platforms,
in this paper we present an approach using freely
available off-the-shelves components. The platform
was implemented together with an application in the
domain of urban mobility along with some experi-
ments were carried out to prove the feasibility of the
proposed approach.
The remainder of this paper organized as follows:
Section 2 discusses background and motivation for
our work; Section 3, presents an overview of the ref-
erence architecture; Section 4 brings details about the
architecture implementation in the urban mobility do-
main; Section 5 presents the tools and methods of the
tests in Section 6; Section 7 introduces results and dis-
cussions; Section 8, presents related work; and Sec-
tion 9 brings conclusions and future work.
600
Diniz, H., Silva, E., Nogueira, T. and Gama, K.
A Reference Architecture for Mobile Crowdsensing Platforms.
In Proceedings of the 18th International Conference on Enterprise Information Systems (ICEIS 2016) - Volume 2, pages 600-607
ISBN: 978-989-758-187-8
Copyright
c
2016 by SCITEPRESS – Science and Technology Publications, Lda. All rights reserved

2 BACKGROUND
2.1 Smart Cities Software Architectures
It is important to have software architectures that can
use as reference models for those who want to put in
practice such types of integration scenarios in Smart
Cities. The work from Chourabi et al (Chourabi et al.,
2012), for instance, provides only a more strategic
and high-level perspective on smart cities as a whole.
Al-Hader and colleagues (Al-Hader et al., 2009) pro-
pose more details about Smart Cities Components Ar-
chitecture but remain shallow. Even when getting into
a more detailed literature survey about software ar-
chitectures for smart cities, da Silva and colleagues
(da Silva et al., 2013) were only capable of extract-
ing general requirements for such architectures. The
surveyed articles presented speculative or high-level
architecture drafts, with little or no evidence on how
such architectures implemented.
Many systems being developed including the peo-
ple as more participatory elements in the system and
the city, turning them into crowd sensors. Ganti and
colleagues (Ganti et al., 2011), for instance, present
only the general functioning of Mobile Crowdsensing
(MCS), although their main purpose is not focused on
software architecture. However, Guo et al (Guo et al.,
2014) propose different layers of architectures such
as data collection, transmission, and processing, but
do not give details on concrete architectures or how
to implement that. Cardone and colleagues (Cardone
et al., 2014a) bring one of the MCS architectures that
get into more detail, illustrating what component plat-
form to use but without concrete examples on which
components to use.
2.2 Crowdsensed Data Analysis
As pointed out by Erickson(Erickson, 2010), humans
can contribute to deeper qualitative knowledge, ana-
lyze vague or incomplete data and act in a way that
digital systems are often not capable. Mobile Crowd-
sensing (MCS) (Ganti et al., 2011), in turn, refers to
community sensing (e.g by people) for data collec-
tion, in which people act as sensors (crowd sensors).
Sherchan (Sherchan et al., 2012) considers two
categories of crowdsensing: personal and community
sensing. The former refers to the processing of data
from a single individual to benefit this same individ-
ual with the result of processing of the data which it
has issued. In the case of community sensing (Ganti
et al., 2011) there are two distinct types of mod-
els: opportunistic sensing, which requires minimal
user involvement (e.g. automatic geolocation through
GPS), and participatory sensing, which requires the
active participation and direct provider of user data.
A major point in collecting that information in
real-time is how to generate application-level mean-
ingful events based on the collected data. Many
projects combine MCS and EDA (Event-driven Ar-
chitecture). In Etzion e Niblett (Etzion and Niblett,
2010), EDA is an architectural style in which one
or more software components responsive to receiv-
ing one or more notification events. Complex Event
Processing (CEP) (Buchmann and Koldehofe, 2009)
iis one of the possible strategies for achieving EDA
in distributed systems. It helps to build scalable and
dynamic systems, allowing to analyze data (e.g. cor-
relation, filtering, aggregation) in real-time.
2.3 Application Domain
One of the widely accepted visions of smart cities,
provided by Caragliu (Caragliu et al., 2011), men-
tions different axes in smart cities (smart economy;
smart mobility; a smart environment, smart people,
smart living and smart governance). There is an evi-
dent relationship between smart living and smart mo-
bility there is a continuous growth of infrastructure,
programs and policy interventions to promote bicy-
cling throughout the world (Pucher et al., 2010).
In the context of the work presented here, we are
motivated by a mobile application can help cyclists
on their daily trips. Although most applications in
that context are typically focused on route planning
(Gavin et al., 2011), our proposition is focused on
reporting users about dangerous spots on their route,
while they are moving. These places (e.g., accidents,
robbery, intense traffic) are reported collaboratively
by the application users.
3 REFERENCE ARCHITECTURE
In the face of middleware solutions for smart cities
currently most commonly proposed, some character-
istics were taken into account in building our architec-
ture, to be treated in the most common form different
approaches. As an example, we can mention the sen-
sor connection usage using message queue services
for the integration of data sources of the asynchronous
and synchronous way using RESTful web services,
complex event processing for analysis of streams of
data in real-time and using human sensors through
Crowdsensing systems. To do this, we organized the
platform into components that can be easily found as
free off-the-shelves components, aiming to facilitate
and to simplify the implementation. The role of each
A Reference Architecture for Mobile Crowdsensing Platforms
601
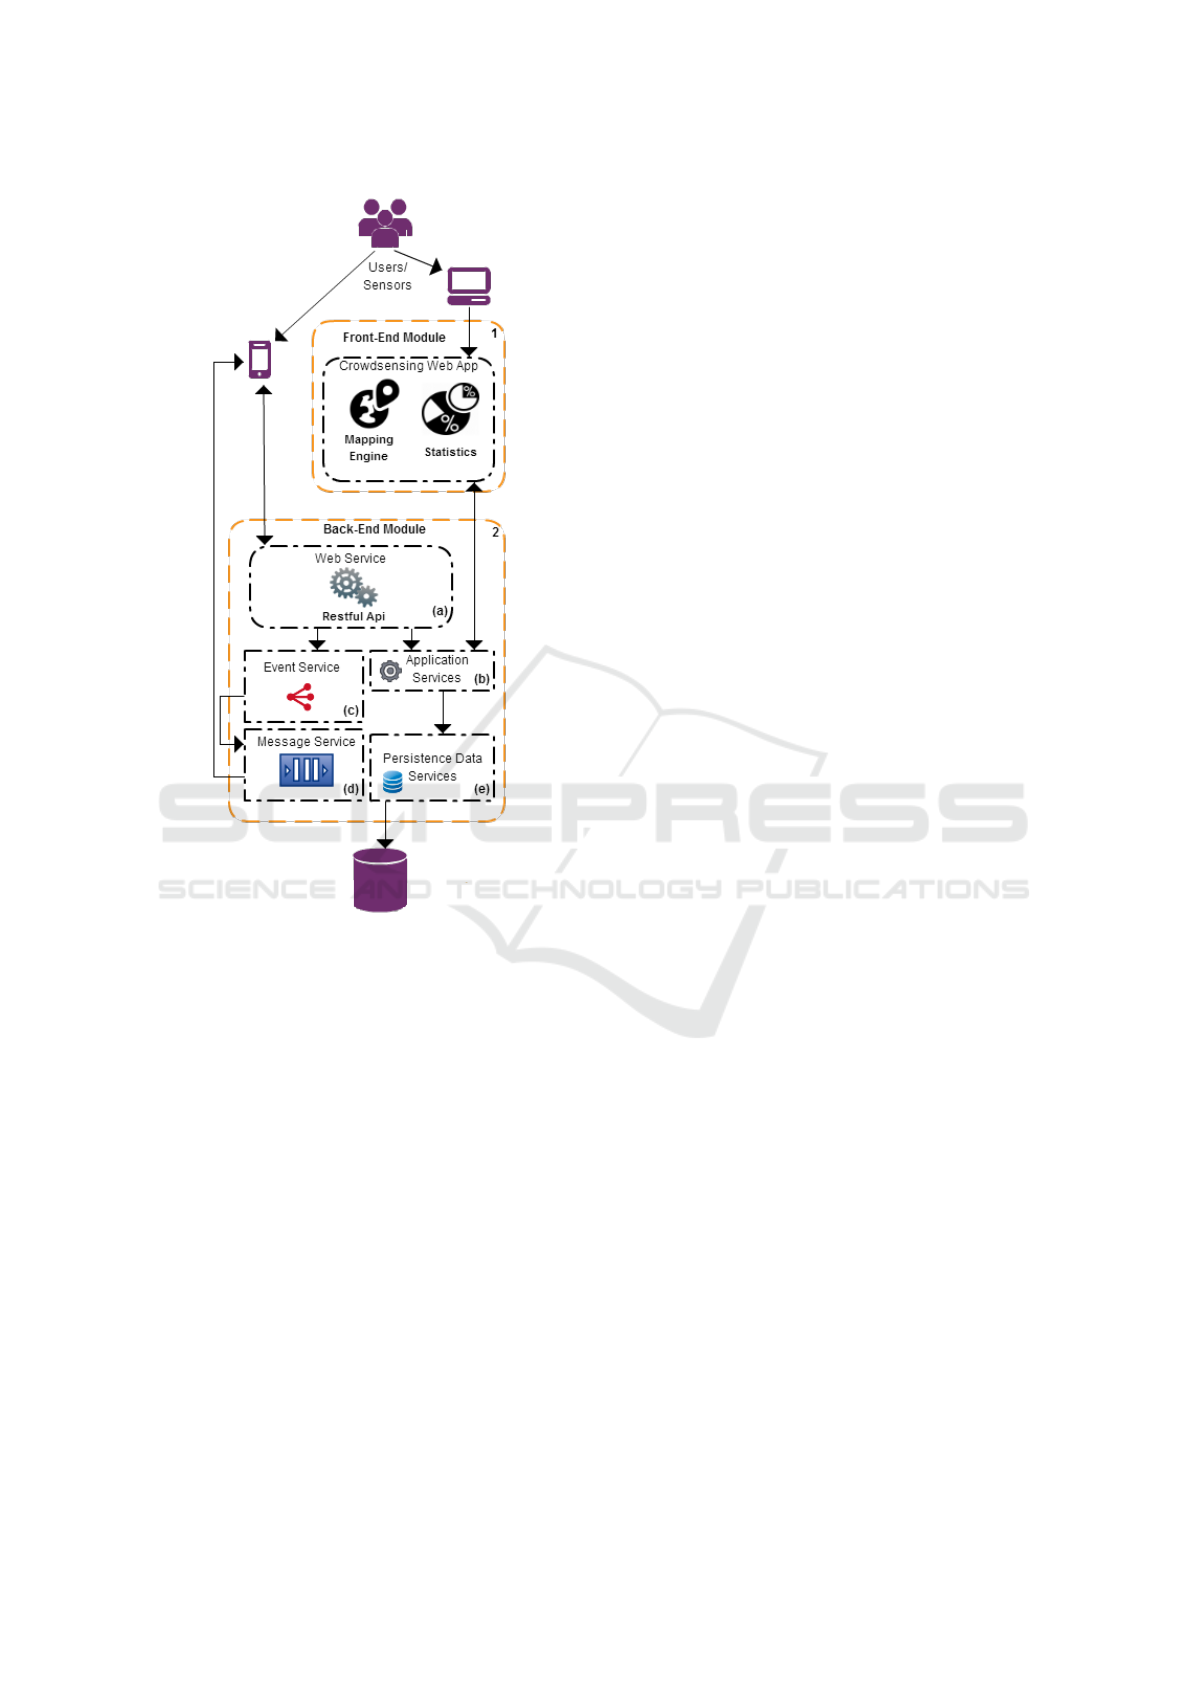
Figure 1: Reference Architecture for Mobile Crowdsensing.
component will be presented later in the description
of the platform architecture, which is built based on
these characteristics.
The platform architectural design is described in
two service modules: Front-End Module and Back-
End Module, as shown in Figure 1. In the Front
End Module (Figure 1 (1)), is the crowdsensing sys-
tem that can either be Web or Mobile. The Back-
End module (Figure 1 (2)) contains the RESTful
API services (Figure 1 (2.a)). It is responsible for
coordinating access to synchronous services of Re-
quest/Response and event processing service (Figure
1 (2.c)). That, in turn, accesses the services of the
asynchronous messaging service module in the model
Publish/Subscribe (Figure 1 (2.d))). Thus provid-
ing the transmission of real-time data and signaling
the connected clients, which allows establishing and
maintaining connections via socket and service inter-
faces allowing any device to send and receive data
to be processed and redistributed. This data is con-
trolled by the Services Manager of the application,
(Figure 1 (2.b))), which accesses through the persis-
tence ser-vice, the data persisted in the database (Fig-
ure 1 (2.e)).
The platform has two data entry services that
can be provided through crowdsensing system on the
Front-End module or the Web Service API in Back-
End Module.
4 IMPLEMENTATION
The system described here details a Crowdsensing ap-
proach, which has a Google Maps service, which al-
lows users in the form of human sensors view occur-
rences of points on the map with bookmarks, graphs
with statistics and the table with the detailed list oc-
currences of data. The proposed platform, the ap-
plication of crowdsensing is parameterized for vari-
ous domains offering the opportunity to create custom
bookmark this, such as the map described in Figure 2,
with urban mobility domain data describing points of
traffic accidents involving bicycles.
4.1 Front-end Module
The front-end module is comprised of two applica-
tions: a Web Application and an Android Mobile Ap-
plication. The Web Application has a dashboard with
charts and statistics showing the total occurrences, a
pie chart format showing statistics for each type of oc-
currence, and the list of events in a tabular format, in
addition to being can also report accidents as we can
see in Figure 2.
The Android application developed with the inten-
tion of consuming platform data and present context-
aware information. The application has a cyclist pro-
file with two basic features provided through the Web
Services Module data consumption. One such ser-
vice is the Crowdsensing Alert, where the application
sends its current GPS position and receives the infor-
mation of the distance between the cyclist and the ac-
cident points registered by the Crowdsensing system,
alerting to the cyclist that he is close to an accident
point and the other report problems with cyclists by
crowdsensing information with markers on the map.
A second profile is the Driver Profile that has a ser-
vice to the CEP Alert, which in real-time can be iden-
tified the nearest user who is using the application in
motor-vehicle mode, and be alerted to be more care-
ful, avoiding possible accidents with cyclists. CEP al-
lowed us to employ the concept of geofencing, which
is the capability of detecting user proximity to a given
geolocation (Cardone et al., 2014b).
ICEIS 2016 - 18th International Conference on Enterprise Information Systems
602
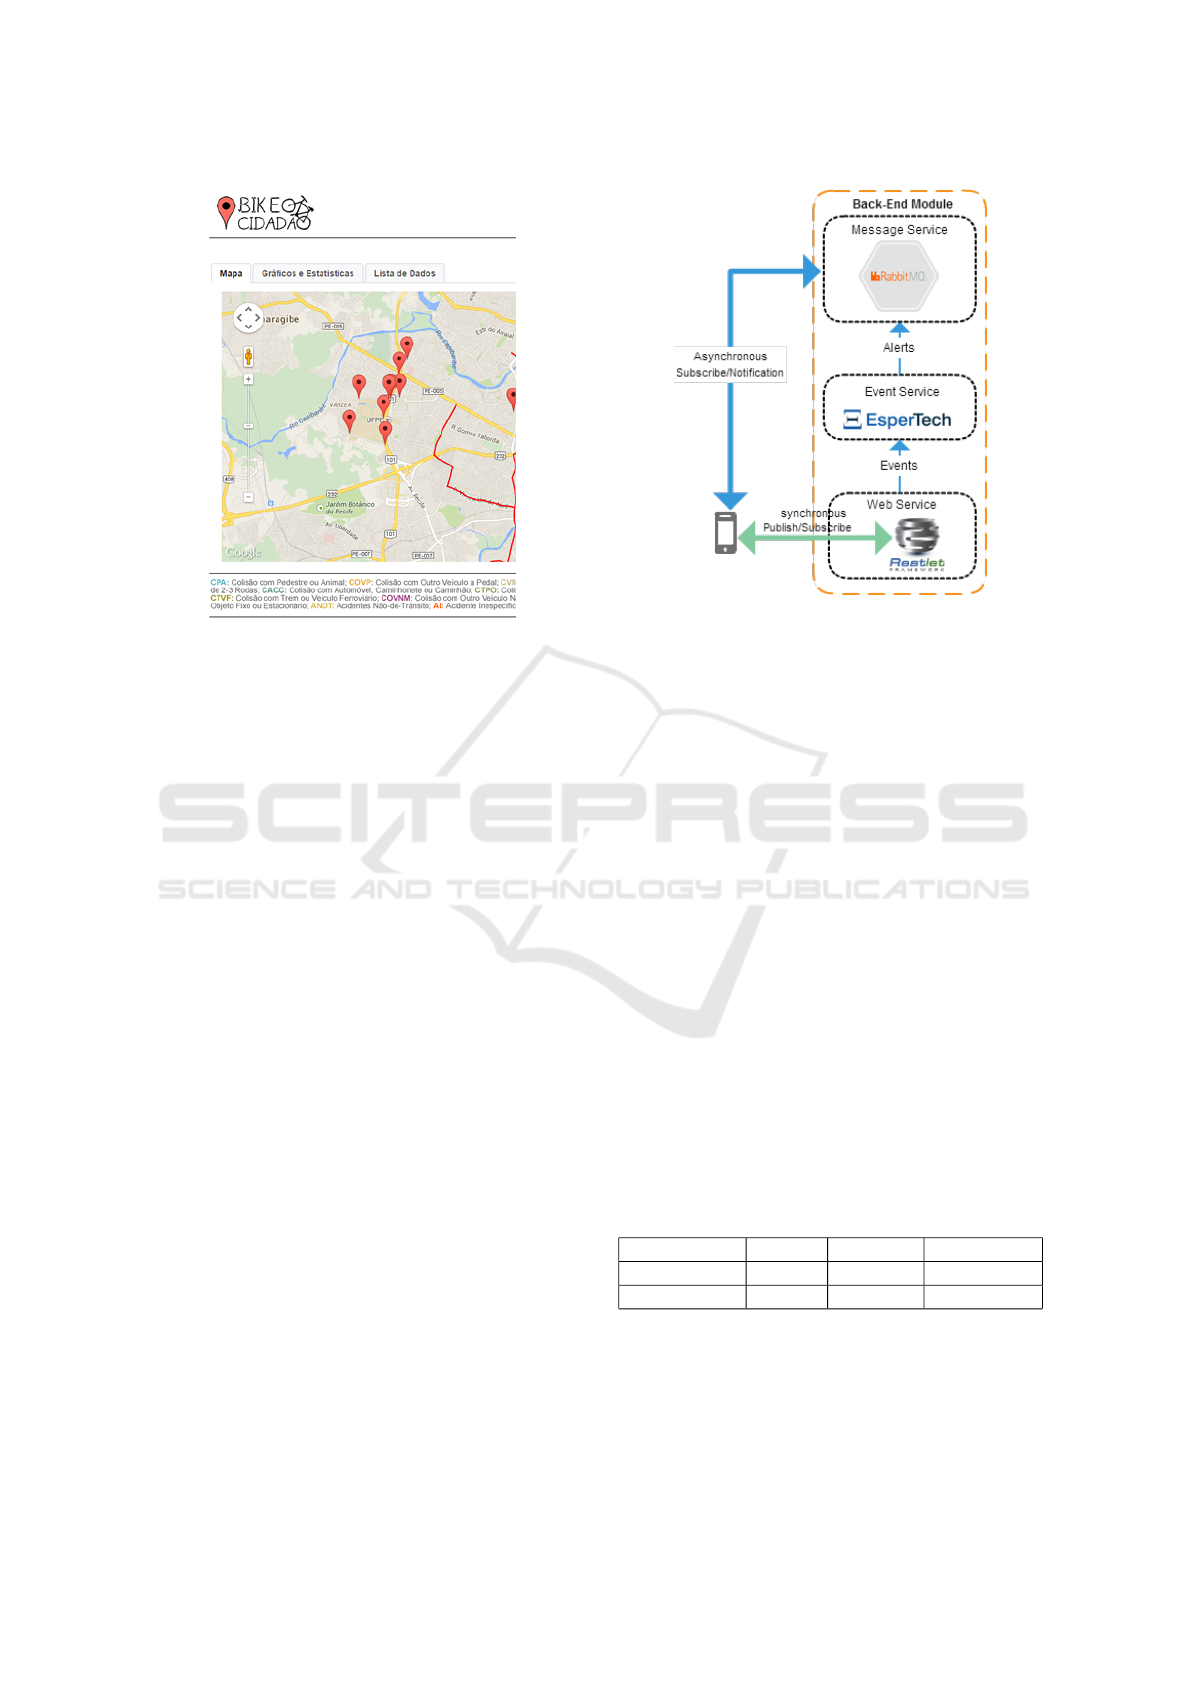
Figure 2: Web view of the example crowdsensing system.
4.2 Back-end Module
The Web services model, shown in Figure 3, provides
data services in real-time via synchronous and asyn-
chronous requests. Synchronous requests are made
through a RESTful web service using the JSON for-
mat for data transmission. The requests are made
through the client data send requesting services pro-
vided by the Web Service via POST/GET that, in turn,
requests data persistence layer through configurable
functions. For example, there is a location service re-
turning the type of occurrence and the distance be-
tween a point latitude and longitude sent from a client
and the location of the nearest occurrence, point per-
sisted by the user through the Crowdsensing service.
As the requests come in, events are registered
in the FLOSS/COTS Esper CEP engine and alerts
are triggered for queues in the event processing ser-
vice the asynchronous model to be consumed by cus-
tomers. Thus, this model uses the Message Queue
service, to capture the CEP alert triggered asyn-
chronously, by capturing events and processing rules,
and provides services through the Restlet framework,
processing occurrences stored in the data layer.
The Web Services module provides location ser-
vices that can be parameterized by the functions and
customizations of CEP tool of rules, as well as allow-
ing the user to create new rules to be provided through
the FLOSS/COTS component RabbitMQ queuing
system service, the asynchronous model. A rule of
this model (illustrated by Listing 4.2) A rule of this
model is parameterized location, that allows trigger
alerts with distance, in real-time, the last two loca-
Figure 3: The Service Layer Model.
tion requests latitude and longitude points sent via the
REST service and inserted them in the message queue
to be consumed by registered users.
SELECT 6378137 * Math.sqrt(
Math.pow((Math.toRadians(cast(Vehicle.lat,
double)) - Math.toRadians(cast(
BikePosition.lat, double))), 2) +
Math.pow((Math.toRadians(cast(Vehicle.
lng, double)) - Math.toRadians(cast(
BikePosition.lng, double))), 2))
AS distance, bikePosition.imei,
bikePosition.lat, bikePosition.lng,
Vehicle.imei, Vehicle.lat, Vehicle.lng
FROM BikePosition.win:length(1)
AS bikePosition, Vehicle
ORDER BY distance ASC LIMIT 1
5 TEST ENVIRONMENT
This section discusses the materials and methods used
for proof of concept of the proposed platform. For test
running, we used two computers, whose configuration
is described in Table 1.
Table 1: Setup of the machines used in the experiment.
- CPU Clock RAM
M.USER 2410M 2,3GHz DDR3 8GB
M.SERVER M380 2,53GHz DDR3 4GB
The computer named M.USER was used to simu-
late users and send status and requests to the platform.
The simulation of the requests was held in M.USER
using the performance testing tool JMeter v. 2.9. The
computer named M.SERVER was the one who hosted
A Reference Architecture for Mobile Crowdsensing Platforms
603

the platform, received and processed requests from
M.USER. Altogether there were two tests. The first
test (hereafter referred to as T1) simulated only re-
quests where users were no more points by accident,
previously registered by Crowdsensing service. In the
second test (hereafter referred to as T2) in all requests,
users were in danger route, according to Crowdsens-
ing service, and were in collision zone with another
user. Section 6 will describe the result of each test.
We considered the nature of real-time data
transferred by the platform and the need to keep
up the geographic location of users. In the con-
figuration of virtual users in JMeter the following
parameters defined: Threads = 1000, Ramp-up =
2 and LoopCount = forever. So every 2 seconds
1000 virtual users send requests to the platform. In
each test in JMeter measure platform performance
receiving simultaneous requests from the 1000
virtual users for 15 minutes. The performance
monitored for the following metrics: Times Over
Time, Transactions per Second, Response Times
Percentiles, Time Graph. Requests of virtual users
were GET type and configured with the following pa-
rameters: Connect Timeout = 10000 (ms), Response
Timeout = 10000 (ms). The connection Path for
submission of requests follows the following format:
/project/rest/trace/[queue id]/[latitude]/[longitude]/,
for example: /project/rest/trace/[queue
id]/[latitude]/[longitude]/, for example:
/project/rest/trace/54321/-8.0552967
3777147/-34.951613545417786/.
Moreover, in M.SERVER a setting has been made
to deal with the large number of requests from virtual
users and reduce the cost for opening connections.
Through the library C3PO of Hibernate was set up a
pool of 1000 connections.
6 TEST RESULTS
In this section the results of the two tests are consoli-
dated. As presented before, the T1 test has simulated
a total of 1000 users sending their status to the server
and waiting for an answer on the status of the current
route. In this test, 100% of the users were in a secure
route, i.e., they did not have the Crowd-Sensing ser-
vice notifications. Therefore, no event was triggered
by the CEP service, and no message was added to the
userâ
˘
A
´
Zs message queue in RabbitMQ. On the other
hand, the T2 test 100% of users were on a route that
had any notification by CrowdSensing service. Thus,
each request, a CEP event was triggered, and a mes-
sage was added to the userâ
˘
A
´
Zs message queue with
the description of the accident just ahead.
Thus, the T1 test has synchronous feature exclu-
sively. In this test through a RESTful web service pro-
vided by the platform the user sends your geographic
coordinates and only expects a JSON document with
the distance and characteristics of your nearest ac-
cident. In fact, no users in this test were in danger
route. The T2 test, in turn, has synchronous and asyn-
chronous features. In the synchronous connection test
T1, T2 test calculates the distance of the rider about
the closest vehicle. In the case both are below a toler-
able distance the event service fired alerts in the mes-
sages queues of the cyclist and automobile. Thus,
both kept an asynchronous connection to the platform
to be notified of the proximity of another user.
6.1 Response Time
The aim of this metric was to check the average time
to respond to a request delay to get to the virtual
user. That is the time that starts when the request
is sent to the server and ended when the response is
completely received by the client. In JMeter is rep-
resented by the metric Times Over Time and Time
Graph. As expected, the overall response time T2
is greater than time T1. As illustrated in Figure 4,
the average response time for T1 was 3708,58 ms and
4660,02 ms for T2. Indeed, having 30 random sam-
ples of size 100, with the replacement of the mea-
sured response times, and considering a level of 95%
confidence level, has an average range of 3604.47ms
the 3840.0ms response to the T1 test and 4509.861ms
4627.493ms for the T2 test.
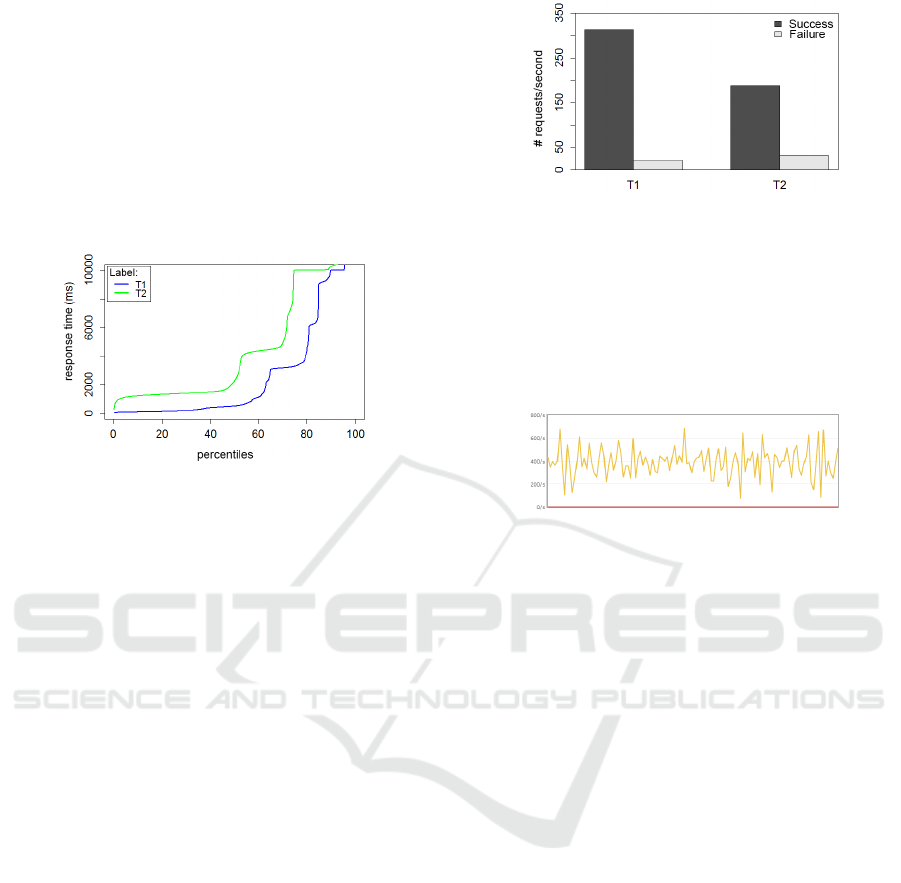
Figure 4: Distribution of response times. Given the varia-
tion presented in measurements of time, their representation
was better detailed in a chart in the box. The black line, by
default, represents the median and the black square repre-
sents the average.
In contrast to T1, in T2 for the time dedicated the
execution of complex event processing module and
notifications in asynchronous connections with Rab-
bitMQ. Through the medium listed above, we can
calculate the time spent on these tasks is an average
of 951,44 ms. That is, this is the average time the
platform takes to receive a stream of geographic co-
ordinates, to calculate the distance from that for the
ICEIS 2016 - 18th International Conference on Enterprise Information Systems
604
points of accidents, to verify whether this point is in a
danger zone, and finally trigger notifications in mes-
saging queue of RabbitMQ. To better understand the
response time, Figure 5 shows the percentile of re-
sponse times of each test. It can be seen that the aver-
age response time T1 is in the 79,0% percentile. That
is, 79,0% of the requests have a time less than or equal
to the average. Likewise, the average response time
T2 is on the 68,8% percentile (Figure 5), given by the
metric Response Times Percentiles.
Figure 5: Percentile response time. The percentile values
increasingly ordering the sample in 100 parties. Thus, the
n-th percentile is the first n% of the sample values.
6.2 Success and Fail Rate
The aim of this metric was to demonstrate the success
of behavior and failure in requests in T1 and T2 test.
As mentioned in Section 5, the JMeter requests were
configured with parameters Connect Timeout = 10000
(ms) e Response Timeout = 10000 (ms).That is, if a
connection delay more than ten seconds to open or
if the delayed request more than ten seconds to be an-
swered, this request was considered failure. In JMeter
is represented by the metric Transactions per Second.
Looking at Figure 6, it can be noted that T1 for
the test there was an average of 313,31 requests per
second successfully processed and 21.02 requests per
second failure. As for the T2 test, there was an av-
erage of 189.14 requests per second completed suc-
cessfully and 32.53 requests per second failure. In-
deed, as in Section 6, having 30 samples of size 100 of
the measured response times and considering a 95%
confidence level, has an average range of 306,78 to
317,32 successful requests per second in the T1 test
and 186,93 to 191,29 to test T2. As for the failures,
the confidence intervals are 19.77 to 21:34 failures re-
quests at test T1 and 31.22 to 33.28 for T2’s failures.
In the T2 test, for each request successfully an-
swered, two messages were sent to RabbitMQ, one
for the message queue of the cyclist and the other
on automobile message queue the RabbitMQ control
panel and monitor in real-time the activities of the
Message Queue service was accessesd through the
Figure 6: Success rate and failure in requests. The dark bars
represent the successful conclusion requests. The light bars
represent the failures requests.
server address localhost:15672/#/, you can find.
In all they sent 350,307 messages to the RabbitMQ,
corresponding to an average of 389.23 messages per
second (see Figure 7). In fact, this rate is almost dou-
ble the amount of completed requests in T2.
Figure 7: Rate messages published in RabbitMQ queue per
second. The period illustrated corresponds to the last ten
minutes of test.
7 RESULTS AND DISCUSSIONS
As illustrated in Section 6, considering a total of 1000
simultaneous requests the platform had an average
time of 3708,58 ms response for the safe route (test
T1) and an average of 4660,02 ms for proximity no-
tification with other users (test T2). Since, for T1,
79% of the requests have a time less than or equal to
T2 and the average, 68,9%. An average of 334.33 re-
quests per second to T1, only 6,28% of them were not
completed, and for an average of 221.67 requests per
second in T2, 14,67% were failures requests.
On a comparison of results obtained with real de-
mand requests, the BikePE project (BikePE, 2015),
from Recife, Brazil, was used as a parameter. In this
bike sharing initiative, 800 bikes are available for rent
at 80 stations around the metropolitan area of Recife.
According to that source, from Monday through Fri-
day there is an average demand of 1100 trips. That is,
although different contexts of applicability, and con-
sidering the performance data provided by the plat-
form, it can be seen that using only a computer with
domestic settings would be enough to meet such de-
mand using the solution proposed in this paper. More-
over, in case there are a greater demand requests, the
platform may be instantiated on different machines,
then offering the possibility of horizontal scale. So,
A Reference Architecture for Mobile Crowdsensing Platforms
605

to meet an ever increasing demand, it is not necessary
to improve the machineâ
˘
A
´
Zs hardware hosting plat-
form. Indeed, platform instances can be replicated on
multiple machines with traditional settings and thus
obtain a higher scale at a lower cost.
As threats to validity, a 3G data network for com-
munication between virtual users and the platform has
been the fact of not having been used. However, as the
tests had the purpose of proving the possibility of de-
velopment platform, it was not necessary to network
latency test, for example. Thus, he preferred to opt
for simulation in a local wireless network.
8 RELATED WORK
This section presents a non-exhaustive list of plat-
forms employing similar approaches to ours and a
brief comparison with our proposal.
SOFIA (Filipponi et al., 2010) is a semantic inter-
operability platform between a selected set of appli-
cations and an ecosystem of interactive objects such
as sensors, actuators, and other embedded systems.
Their goal is to provide features for the building of
intelligent environments. The project addresses three
application areas representing different types of space
in terms of scale, applications and services: intelli-
gent personal spaces (e.g, cars), smart indoor spaces
(e.g, home and office), and intelligent city spaces (e.g,
expanded infrastructure and facilities such as a sub-
way station, shopping and the like).
Traffic Info (Farkas et al., 2014) is an application
based on crowdsensing that views public transport in-
formation of the city in a map in real-time. It is built
using publish/subscribe model to communicate pas-
senger who subscribed in the Traffic Info, according
to their interest, for the traffic information channels
dedicated to different public transport lines or stops.
They are informed live about the situation of public
transport, such as the actual position of the vehicles.
When passengers gather the real-time data, informa-
tion is updated in a map to reflect the traffic situation.
CrowdOut (Aubry et al., 2014) is also a mobile
crowd sensing service for smart cities, which allows
users to report road safety problems that they expe-
rience in their urban environment (speeding, illegally
parked cars, traffic signs and symbols, quality roads
and traffic levels) and share this information with your
community. A user can specify the type of crime, take
a picture with your smartphone and add it to the re-
port to present it; it can also add a short comment to
describe the infraction more precisely. The service
also registers the GPS coordinates of the users, to in-
dicate the precise location of the offense occurred on
the road so they can be shown on a map in real-time.
Choi & Kang (Choi and Kang, 2014) propose a
platform on top of a mobile application developed in
HTML5, with location-based services (LBS) making
use of GPS, to find points of interest. As a result,
we present a case of a mobile tool to aid foreigners
and Koreans in a complicated process of registration
purchase and alienation of real estate in South Korea.
By analyzing these solutions, our solution dif-
fers from SOFIA platform because it has a narrower
scope, aiming to offer the crowdsensing services. In
contrast, SOFIA addresses presented by the various
areas of applications. Nevertheless, we propose the
domain configuration, contrasting this aspect with
TrackInfo platforms and the proposal presented by
Choi & Kang. The CrowdOut platform contrasts to
ours not having information resource alerts triggered
by complex event processing.
9 CONCLUSION
This paper presents the proposal and validation of a
architecture for a mobile crowdsensing platform that
takes advantage of free software and off-the-shelves
components. It meets and implements an effective
and simplified way a middleware platform for Smart
Cities solution. Among its features include: config-
urable for multiple domains, Complex Event Process-
ing use for analysis of real-time data streams, integra-
tion of data using RESTful services, message queue
and the utilization of human sensors (crowd sensors).
From the analysis results, we can conclude that
the platform behaved satisfactorily in the tests since
supported a load of similar requests the real demands,
considering the machine that hosted the platform had
the typical configuration a home computer. Finally,
this study proves the concept that you can build a
middleware platform for smart cities, based on lo-
cation, using complex event processing, configurable
for multiple domains and capable of processing rules
developed by the users.
Currently, a similar architecture to the one that
is described in this paper is being developed, using
Storm as the main component, which is a distributed
computing system in real-time. We intend to make
experiments using the same conditions already car-
ried out in this paper so that in future work we can
make comparisons between the results obtained with
the two architectural approaches.
ICEIS 2016 - 18th International Conference on Enterprise Information Systems
606

ACKNOWLEDGEMENTS
This work was partially funded by the National
Counsel of Technological and Scientific Development
(CNPq Universal grant #485420/2013), the National
Institute of Science and Technology for Software En-
gineering (INES - CNPq grant #573964/2008-4) and
the Foundation for Science and Technology of Per-
nambuco (FACEPE).
REFERENCES
Al-Hader, M., Rodzi, A., Sharif, A. R., and Ahmad, N.
(2009). Smart city components architecture. In
Computational Intelligence, Modelling and Simula-
tion, 2009. CSSim’09. International Conference on,
pages 93–97. IEEE.
Aubry, E., Silverston, T., Lahmadi, A., and Festor, O.
(2014). Crowdout: A mobile crowdsourcing service
for road safety in digital cities. In Pervasive Com-
puting and Communications Workshops (PERCOM
Workshops), 2014 IEEE International Conference on,
pages 86–91. IEEE.
BikePE (2015). Bikepe. http://www.bikepe.com/. Accessed
in 2015-10-01.
Buchmann, A. and Koldehofe, B. (2009). Complex event
processing. it-Information Technology Methoden und
innovative Anwendungen der Informatik und Informa-
tionstechnik, 51(5):241–242.
Caragliu, A., Del Bo, C., and Nijkamp, P. (2011). Smart
cities in europe. Journal of urban technology,
18(2):65–82.
Cardone, G., Cirri, A., Corradi, A., and Foschini, L.
(2014a). The participact mobile crowd sensing liv-
ing lab: The testbed for smart cities. Communications
Magazine, IEEE, 52(10):78–85.
Cardone, G., Cirri, A., Corradi, A., Foschini, L., Ianniello,
R., and Montanari, R. (2014b). Crowdsensing in ur-
ban areas for city-scale mass gathering management:
Geofencing and activity recognition. Sensors Journal,
IEEE, 14(12):4185–4195.
Choi, M. and Kang, B.-T. (2014). Html5 platform indepen-
dent mobile application using location-based service.
Life Science Journal, 11(7).
Chourabi, H., Nam, T., Walker, S., Gil-Garcia, J. R., Mel-
louli, S., Nahon, K., Pardo, T., Scholl, H. J., et al.
(2012). Understanding smart cities: An integrative
framework. In System Science (HICSS), 2012 45th
Hawaii International Conference on, pages 2289–
2297. IEEE.
da Silva, W. M., Alvaro, A., Tomas, G. H., Afonso, R. A.,
Dias, K. L., and Garcia, V. C. (2013). Smart cities
software architectures: a survey. In Proceedings of the
28th Annual ACM Symposium on Applied Computing,
pages 1722–1727. ACM.
Erickson, T. (2010). Geocentric crowdsourcing and smarter
cities: Enabling urban intelligence in cities and re-
gions. In 1st Ubiquitous Crowdsourcing Workshop at
UbiComp.
Etzion, O. and Niblett, P. (2010). Event Processing in
Action. Manning Publications Co., Greenwich, CT,
USA, 1st edition.
Farkas, K., Nagy, A. Z., Tomás, T., and Szabo, R. (2014).
Participatory sensing based real-time public transport
information service. In Pervasive Computing and
Communications Workshops (PERCOM Workshops),
2014 IEEE International Conference on, pages 141–
144. IEEE.
Filipponi, L., Vitaletti, A., Landi, G., Memeo, V., Laura,
G., and Pucci, P. (2010). Smart city: An event driven
architecture for monitoring public spaces with hetero-
geneous sensors. In Sensor Technologies and Appli-
cations (SENSORCOMM), 2010 Fourth International
Conference on, pages 281–286. IEEE.
Ganti, R. K., Ye, F., and Lei, H. (2011). Mobile crowdsens-
ing: current state and future challenges. Communica-
tions Magazine, IEEE, 49(11):32–39.
Gasperoni, F. (2006). Floss, cots, and safety: A business
perspective. 3rd European Congress ERTS – Embed-
ded Real Time Software.
Gavin, M., Ghosh, B., Pakrashi, V., Barton, J., O’Flynn,
B., and Lawson, A. (2011). A cycle route planner
mobile-app for dublin city. In Irish Transportation
Research Network Conference (ITRN2011), 31 Aug-
1 Sep 2011, University College Cork, Cork, Ireland.
Irish Transportation Research Network.
Guo, B., Yu, Z., Zhou, X., and Zhang, D. (2014). From
participatory sensing to mobile crowd sensing. In
Pervasive Computing and Communications Work-
shops (PERCOM Workshops), 2014 IEEE Interna-
tional Conference on, pages 593–598. IEEE.
Nagel, T., Maitan, M., Duval, E., Moere, A. V., Klerkx, J.,
Kloeckl, K., and Ratti, C. (2014). Touching transport-
a case study on visualizing metropolitan public transit
on interactive tabletops. In Proceedings of the 2014
International Working Conference on Advanced Vi-
sual Interfaces, pages 281–288. ACM.
Naphade, M., Banavar, G., Harrison, C., Paraszczak, J., and
Morris, R. (2011). Smarter cities and their innovation
challenges. Computer, 44(6):32–39.
Odendaal, N. (2003). Information and communication
technology and local governance: understanding the
difference between cities in developed and emerging
economies. Computers, Environment and Urban Sys-
tems, 27(6):585–607.
Pucher, J., Dill, J., and Handy, S. (2010). Infrastructure,
programs, and policies to increase bicycling: an inter-
national review. Preventive medicine, 50:S106–S125.
Sherchan, W., Jayaraman, P. P., Krishnaswamy, S., Za-
slavsky, A., Loke, S., and Sinha, A. (2012). Using
on-the-move mining for mobile crowdsensing. In Mo-
bile Data Management (MDM), 2012 IEEE 13th In-
ternational Conference on, pages 115–124. IEEE.
A Reference Architecture for Mobile Crowdsensing Platforms
607
