
DISTL: Distributed In-Memory Spatio-Temporal Event-based Storyline
Categorization Platform in Social Media
Manu Shukla
1
, Ray Dos Santos
2
, Andrew Fong
1
and Chang-Tien Lu
3
1
Omniscience Corporation, Palo Alto, California, U.S.A.
2
U.S. Army Corps of Engineers - ERDC - GRL, Alexandria, Virginia, U.S.A.
3
Computer Science Department, Virginia Tech, Falls Church, Virginia, U.S.A.
Keywords:
Event Categorization, In-Memory Distribution, Big Data.
Abstract:
Event analysis in social media is challenging due to endless amount of information generated daily. While
current research has put a strong focus on detecting events, there is no clear guidance on how those storylines
should be processed such that they would make sense to a human analyst. In this paper, we present DISTL,
an event processing platform which takes as input a set of storylines (a sequence of entities and their relation-
ships) and processes them as follows: (1) uses different algorithms (LDA, SVM, information gain, rule sets)
to identify events with different themes and allocates storylines to them; and (2) combines the events with
location and time to narrow down to the ones that are meaningful in a specific scenario. The output comprises
sets of events in different categories. DISTL uses in-memory distributed processing that scales to high data
volumes and categorizes generated storylines in near real-time. It uses Big Data tools, such as Hadoop and
Spark, which have shown to be highly efficient in handling millions of tweets concurrently.
1 INTRODUCTION
In social media channels like Twitter, emerging events
propagate at a much faster pace than in traditional
news. Putting relevant facts together (while discard-
ing unimportant ones) can be very challenging be-
cause the amount of available data is often much
larger than the amount of processing power. This im-
plies that many systems are unable to keep up with
increasingly large volumes of data, which may cause
important information to be missed. Event process-
ing, therefore, is at a minimum dependent on two
tasks: (1) collecting all the facts, entities, and their
relationships; (2) grouping them by their themes of
discussion, space, and timeframes. These two tasks
should be performed in a distributed paradigm for
maximum coverage. In the real world, not every piece
of information can be thoroughly investigated in a
timely manner. The goal, therefore, is to maximize
the two previous tasks so that an event can be de-
scribed with the most number of pertinent facts that
yields the most complete picture. Figure 1 provides
a visual representation of the idea. The figure shows
seven tweets with a connection to the Boston area: t2,
t3, and t7 are related to the Boston Marathon Bomb-
ings of April 2013, while t1 and t5 are about base-
ball, and t4 and t6 are about finance. First, these mes-
sages are certain to come hidden among millions of
other tweets of different natures. Further, they re-
late to different topics, which indicates they should
be presented separately. As seen in Figure 1, all
of the tweets are first transformed into simple sto-
rylines, and then grouped into three different themes
(”Boston Marathon Bombings”, ”Wall Street News”
and ”Boston Red Sox”), which may be better suited
to present to different audiences.
The goal of this paper is to perform the above
tasks using DISTL, Distributed In-memory Spatio-
Temporal storyLine categorization platform (also
shown in Figure 1), a system that ingests storylines
derived from tweets, and allocates them to appropri-
ate events. The criteria used for the allocation pro-
cess is that storylines have common themes, are lo-
cated in nearby areas, and take place during close
timeframes. DISTL uses as input the storylines gen-
erated by DISCRN(Shukla et al., 2015), and is an
in-memory spatio-temporal event processing platform
that can scale to massive amounts of storylines using
Big Data techniques. The platform helps analysts find
faint, yet crucial events by separating storylines into
groups, which allow analysts to sift through them in
subsets under specific contexts.
Shukla, M., Santos, R., Fong, A. and Lu, C-T.
DISTL: Distributed In-Memory Spatio-Temporal Event-based Storyline Categorization Platform in Social Media.
In Proceedings of the 2nd International Conference on Geographical Information Systems Theory, Applications and Management (GISTAM 2016), pages 39-50
ISBN: 978-989-758-188-5
Copyright
c
2016 by SCITEPRESS – Science and Technology Publications, Lda. All rights reserved
39
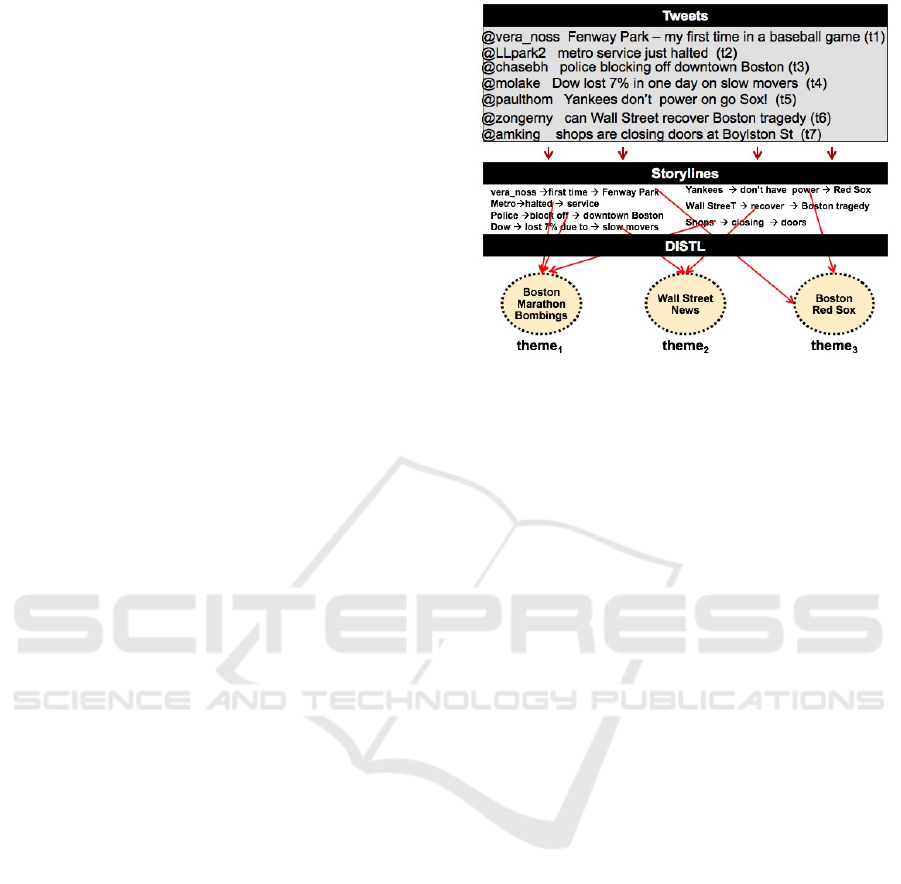
A storyline is simply a time-ordered connection of
facts that take place in a geographical area. In Fig-
ure 1, for example, ”police→block off→downtown
Boston” represents a simple storyline related to a big-
ger event (the Boston Marathon Bombings). Story-
lines may be variable in length, and made as elastic
as desired. In this paper, we do not show how these
storylines are generated. Rather, we refer the reader
to our previous work, DISCRN (Shukla et al., 2015),
which is a distributed platform specifically dedicated
to generating storylines.
In order for a storyline ”to be told”, the user must
first select a starting entity, such as a person or orga-
nization, from where the story can investigated. By
checking the connections from that starting entity to
other entities, one can then put the facts together into
a bigger event. For example, one may select a ”person
carrying a back pack” from one tweet to be the start-
ing entity, and obtain other facts from other tweets,
such as ”entering subway”, and ”making a phone
call”, which would paint a more complete picture of a
possible crime. DISCRN is a distributed system that
mines storylines, as described above, at scale. It is
effective in extracting storylines from both short un-
structured tweet snippets and structured events such
as in GDELT (Leetaru and Schrodt, 2013). DIS-
CRN uses MapReduce(Dean and Ghemawat, 2008) to
generate all storylines from a specified starting entity
from a large set of tweets. Since MapReduce is disk-
based, it becomes less than ideal for highly-iterative
event processing algorithms used in DISTL. For that
reason, it is imperative to explore memory-based so-
lutions explained later.
The key contributions of the platform are:
• Identify Complex Spatio-temporal Events
from Independent Storylines. Multiple algo-
rithms (LDA, Information gain, classification)
are applied to determine textual themes that
incorporate location and time elements.
• Distribute In-Memory Event Processing and
Categorizing of Storylines. Highly iterative
theme generation can better scale when executed
in memory. An in-memory distributed architec-
ture for it is presented in proposed system.
• Categorize Storylines Into Events based on
Rules. Rules allow user fine-grained control of
how to incorporate storylines into events. This
provides user maximum flexibility in categorizing
storylines under events.
The rest of the paper is organized as follows. Sec-
tion 1 provides an overview of storylines and event
creation with them. Section 2 describes the related
works on event creation from social media data. Sec-
Figure 1: Events used to categorize storylines.
tion 3 describes the techniques in DISTL in detail and
Section 4 describes the architecture of components
used to perform it. Section 5 presents experiments
performed with datasets on different storyline sub-
jects and themes on which meaningful and interest-
ing events were generated. Section 6 presents perfor-
mance evaluation results and Section 7 provides con-
clusions of the study.
2 RELATED WORKS
Event creation in social media is a widely researched
field. Event creation consists of identifying the
event and characterizing it. Previous work pri-
marily focuses on detecting events instead of cat-
egorizing elements under them. A useful survey
of detecting events in social media has been pre-
formed(Keskis
¨
arkk
¨
a and Blomqvist, 2013). Inferen-
tial models are explored for detecting events from
news articles(Radinsky and Horvitz, 2013). Graph-
ical models are used to detect events from multi-
ple user posts over social media streams(Zhou and
Chen, 2014). Non-parametric based scan statistic
based event creation as anomalous subgraphs is per-
formed(Chen and Neill, 2014). Dynamic query ex-
pansion and anomaly creation are combined to de-
tect events(Zhao et al., 2014). Clustering tech-
niques along with signature of known events based
supervised event creation is proposed(Agarwal and
Subbian, 2012). Wavelets on frequency based raw
signals and modularity based graph partitioning on
transformed space has been shown to be effec-
tive(Jingshu Weng, 2011). Clustering based sub-
event identification is investigated(Pohl et al., 2012).
Tweets as replacement of news is explored in (Petro-
GISTAM 2016 - 2nd International Conference on Geographical Information Systems Theory, Applications and Management
40

vic et al., 2013). Segment based event detection in
tweets is proposed in (Li et al., 2012a).
Spatio-temporal event creation has also attracted
attention as events tend to be localized phenomenon.
Jointly modeling structural contexts and spatio-
temporal burstiness is used in event forecasting(Zhao
et al., 2015). Burstiness and spatio-temporal combi-
natorial patterns for localizing events spatially is ex-
plored(Lappas et al., 2012). Classifier based event
creation along with spatio-temporal model to deter-
mine event trajectory(Sakaki et al., 2010). A vi-
sual analytics way to detect spatio-temporal events
using LDA based topics and outlier creation is ex-
plored(Chae et al., 2012). A sequential spatio-
temporal event detection system from tweets is pro-
posed(Li et al., 2012b).
NoSQL database based event detection techniques
using clustering is explored(Walther and Kaisser,
2013). Scalability in event creation is usually
achieved through transforming the problem to effi-
cient domains. Scalability in event creation from so-
cial media streams with event based clustering by re-
ducing problem to a record linkage problem is inves-
tigated(Reuter et al., 2011). A scalable non-negative
matrix factorization based technique to detect events
in social media is presented(Saha and Sindhwani,
2012). However in case of storytelling, events have
to be generated such that all storylines are attributed
under the event making it imperative that none are
dropped. That requires scaling through distribution
rather than problem transformation.
There are no known techniques for distributed
event creation. DISTL applies highly iterative tech-
niques to event theme generation that can not be
scaled efficiently with disk based distribution such
as MapReduce. Use of Apache Spark to perform
topic modeling, entity selection and classification in
memory allows for much more efficient scaling. It
distributes the entire sequence of steps starting from
composite event generation and subsequent storyline
categorization into those events in-memory. This al-
lows to scale the process completely and maximize
impact of distribution.
3 EVENT GENERATION
TECHNIQUES
In this section the techniques used to generate events
from storylines and categorize storylines under those
events is described. Subsection 3.1 provides brief
overview of distribution techniques in Spark. Sub-
section 3.2 presents theme generation technique fol-
lowed by subsection 3.3 that explains how events are
generated from themes and storylines assigned to the
events.
3.1 In-Memory Distribution in Spark
Apache Spark is an in-memory distribution frame-
work that allows computations to be distributed in
memory over a large number of nodes in a clus-
ter(Zaharia et al., 2012). The programming con-
structs available in Spark are transformation of data
on disk into RDDs (Resilient Distributed Datasets) in-
memory and then applying operations on the RDDs
to generate values that can be returned to the appli-
cation. RDDs provide fault tolerance in case one or
more nodes of the cluster fail. The algorithms typi-
cally useful for Spark are the ML and statistical func-
tions that are highly iterative in nature. Performing
highly distributed operation in any other distributed
construct such as MapReduce is expensive computa-
tionally due to data written to disk in each iteration.
Spark allows for highly efficient iterative operations
as they are all performed in memory.
The main operations Spark provides on data in
memory that allows it process large volumes in paral-
lels can be broadly categorized into actions and trans-
forms(Apache and Spark, 2015c). The transform op-
erations commonly used include map, filter, flatMap,
join, reduceByKey and sort. The action operations
commonly used are reduce, collect and count. The
map operation returns a distributed dataset by apply-
ing a user specified function to each element of a dis-
tributed dataset. A flatMap does the same except one
input term can be mapped to multiple output items.
reduceByKey operation aggregates the values of each
key in key-value pairs <K,V>according to provided
reduce function. filter returns datasets from source
for which given function evaluates true. Spark also
allows to keep a read-only value of variables in cache
on each node instead of shipping them with each task
through broadcast variables.
3.2 Theme Creation
Several major theme recognition techniques are made
available to the analyst. The event creation technique
uses top weighted keywords as themes and dictionary
based assigning of storylines into event buckets. Rule
based storylines categorization is performed. We can
generate events based on theme, location and time.
The dictionary is generated for themes by analyzing
the terms of the storylines and discovering key ones.
The recognized themes are then used to categorize the
storylines.
The key aspect of event generation is identifying
DISTL: Distributed In-Memory Spatio-Temporal Event-based Storyline Categorization Platform in Social Media
41
the entities that are closest to significant events. The
sequence of steps in events generation and assign-
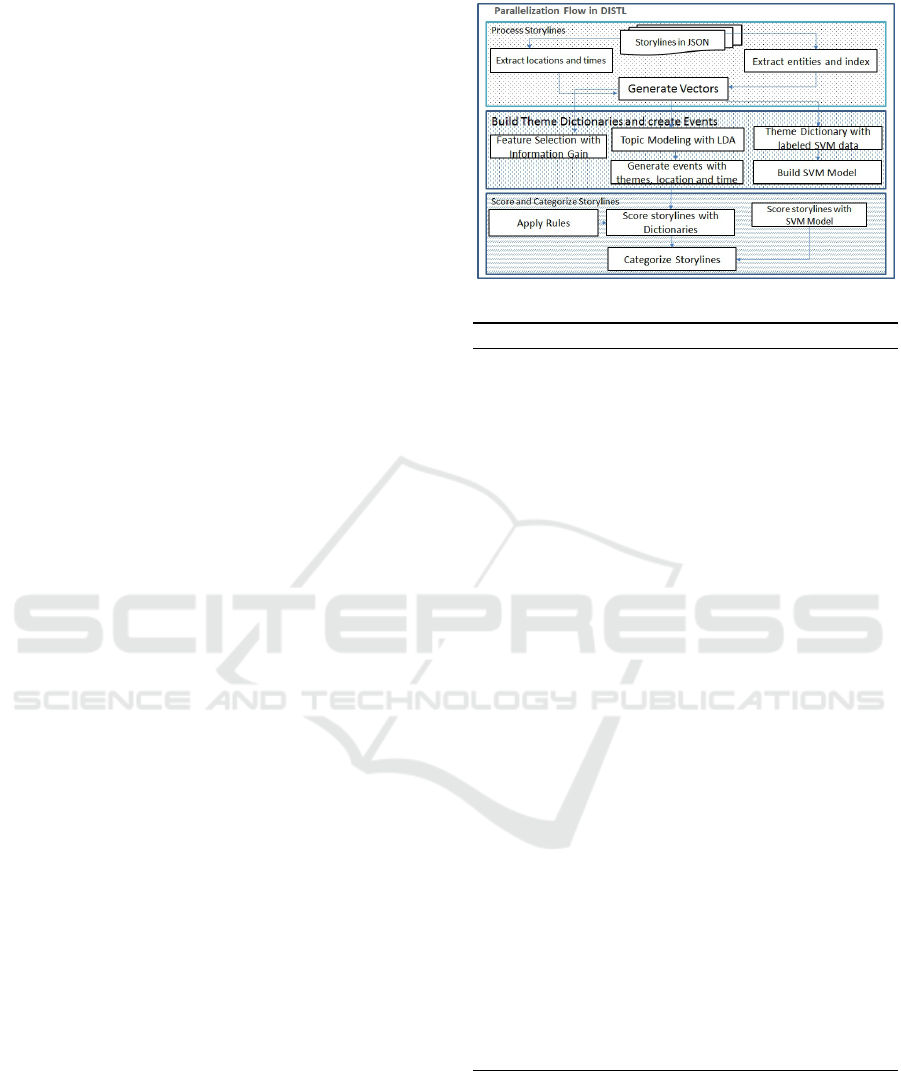
ing storylines to events is shown in Figure 2. The
flow consists of 3 main steps; process storylines, build
themes and create events and score and categorize sto-
rylines. First step processes storylines and identifies
spatial and temporal entities in them. The supervised
and unsupervised techniques are used to identify the
most critical entities in following step. A combination
of theme, spatial and temporal entities are combined
to generate events. The storylines are then catego-
rized under the events in the last step of flow. The 3
algorithms used in second step of flow are as follows.
• Topic Modeling based event creation: Topic mod-
eling method is based on Latent Dirichlet Alloca-
tion. The list of storylines is provided with each
storyline as a document. This technique provides
a list of keywords under topics whose number is
specified by the user.
• Feature Selection through Information Gain based
event creation: This technique extracts top n key-
words by information gain from storylines. Each
storyline is treated as a document. Each of the
highest n information gain value keywords is
treated as belonging to the subject for which la-
beled data was generated.
• Classifier based event creation: This technique
uses a classifier trained with user generated train-
ing set of storylines for a particular subject. This
model is then used to classify storylines into ones
belonging to that subject or not. An example
would be if analyst wants to separate all story-
lines that are related to earnings of a company
from ones that are not. A classifier based tech-
nique works best in case of known subjects being
analyzed in storylines. Events under which sto-
rylines are categorized are generated using most
frequent theme, location and time entities in posi-
tively labeled training data.
Topic modeling falls under unsupervised learning
while other two are supervised. They require training
data in order to generate the themes. All these tech-
niques are highly iterative and under large datasets
computationally expensive especially in terms of
building model.
Algorithm 1 shows the application of 3 techniques
to categorize events. Step 1 performs the extraction of
entities from storylines and generating RDDs of sto-
rylines from JSON output produced by DISCRN. One
RDD is created for training data and one from scoring
data. A combined index of entities is generated. Step
2 then generates RDDs of theme entities and other en-
tities identified as location and time. It then performs
Figure 2: DISTL System Flow.
Algorithm 1: Generate themes.
Input: {storyline
i
},{labeled
j
} {unlabeled storylines and labeled storylines
for supervised learning}
Output: {event
k
,storyline
i
under each event
k
}
{each event definition and storylines under each event}
1: {step 1: parse storylines and extract entities to generate labeled and
unlabeled RDDs}
2: Create trainingDataRDD from labeled storylines file on distributed file
system using map transform
3: Create entityIndexRDD as index of entities to integers using flatMap and
filter transforms
4: Create testingDataRDD from unlabeled storylines file on distributed file
system using map transform
5: Create labeledVectorsRDD and unlabeledVectorsRDD with vectors for
storylines using zipwithindex and distinct transforms
6: {step1: Identify location and time entities }
7: Extract location and time entities from all entities and build location-
TimeRDD using flatMapToPair transform
8: as JavaPairRDD as map of entities and their type location or time
9: {step2: run LDA model and get topics or SVM Modeling or Info
Gain Feature Selection}
10: if technique is topic modeling then
11: ldaModel = new LDA().setK(noOfTopics).run( storylineEntityVec-
torsRDD);
12: else if technique is feature selection based on information gain then
13: Create FeatureSelection featureSelection object
14: Perform MRMR feature selection by featureSelection minimumRe
dundancyMaximumRelevancy(storylineEntityVectorsRDD, number
OfFeatures);
15: extract information gain values by featureSelection. relevancyRe-
dundacyValues();
16: else if technique is classifier based then
17: {call svm classification routine}
18: Build SVMModel by invoking SVMWithSGD.train (label-
PointsRDD, numIterations)
19: Extract themes from positively labeled training data
20: end if
LDA based topic modeling, feature selection based on
information gain or SVM model generation and most
frequent entities from positively labeled training data
to extract themes from entities. All operations are im-
plemented such that they are performed in memory.
GISTAM 2016 - 2nd International Conference on Geographical Information Systems Theory, Applications and Management
42

3.3 Event Generation and Storylines
Assignment
Events are generated by combining themes with the
spatial and temporal entities identified in storylines.
Algorithm 2: Generate Events.
Input: {storyline
i
},{labeled
j
} {storylines and labeled storylines for super-
vised learning}
Output: {event
k
}
{each event definition and storylines under each event}
1: {step 1: Use themes and dictionaries generated in previous algo-
rithm}
2: Get locTimeRDD from previous step
3: Get labeledVectorsRDD from previous step
4: {step 2: Use output from applied algorithm from previous step}
5: if technique used is topic modeling then
6: {Applying top LDA weighted themes, locations and times}
7: for all topic ∈ Topics do
8: Extract top location, time and theme term along with their
weights
9: Combine top weighted theme, time and location entity into event
10: end for
11: Get k events where k were number of topics extracted
12: else if technique is feature selection based on information gain then
13: {Generate events with top info gain entities}
14: Generate event as combination of top information gain theme, loca-
tion and time
15: else if technique is classifier based then
16: {Generate events with top positively labeled storylines location,
time and theme entities by frequency}
17: Calculate frequency of entities in positively labeled documents
18: Combine top location, time and theme entities into events
19: end if
Algorithm 2 shows how generating events based
on themes, location and time entities is performed in-
memory with the location, time and theme entities
extracted from entities RDD and then combined to-
gether to create events. The task of finding the com-
binations of location, time and entities based on one
or more subject depends on the the technique used
for subject creation or labeled data based entity ex-
traction. These are crucial to identifying events and
associating entities with events. Step 2 categorizes
storylines into events. This approach tests keywords
in a storyline against the spatial, temporal and theme
entities and assigns it to the theme based events using
rules specified by user.
The rules provided by user to categorize storylines
into events with theme, location and time elements are
described in Subsection 3.3.1 and their application on
storylines is explained in Subsection 3.3.2.
3.3.1 Categorization Rules format
The rules are of following format:
theme ([and|or] location [ and|or] time)
Hence the rules can take any of the following forms:
1. theme or (location and time)
2. theme or location
3. location
4. time
The rules specify which entities in a storyline need to
match with rule entity of particular type in order to as-
sociate a storyline to the event. Hence Rule 1 specifies
that only if storyline entities match either theme or
location and time then categorize the storyline to the
event. Rule 2 can categorize a storyline to the event if
any of its entities matches either theme or location of
the event while Rule 4 associates any storyline whose
entities match the temporal entity of the event.
3.3.2 Rules Application
As each of these rules are applied to a storyline for
each event, if any rule is satisfied for a storyline
against an event, the storyline is categorized under
that event.
Algorithm 3: Categorize storylines under Events.
Input: {storyline
i
},{event
j
},svmModel {storylines and labeled storylines
for supervised learning}
Output: {event
k
,storyline
i
under each event
k
}
{each event definition and storylines under each event}
1: {step 1: parse rules}
2: Broadcast rules to all worker nodes
3: Read rules in broadcast var
4: {step 2: Apply rules to generate events depending on algorithm pre-
viously applied}
5: if technique used is topic modeling then
6: {Categorize storylines under topic events}
7: for all topic ∈ Topics do
8: PairRDD<Integer, Storyline>topicToStoryLinesRDD using
mapToPair transform by applying rules and dictionaries by topic
to storylines
9: end for
10: else if technique used is feature selection then
11: {Categorize storylines under feature selection events}
12: Build RDD fsStoryLinesRDD using map transform by applying
rules and events to storylines
13: else if technique is svm then
14: {Categorize storylines under svm events}
15: Build RDD classifierStoryLinesRDD using map and filter trans-
forms by applying rules and scored storylineVectorRDD against
model
16: if score ≥ threshold and match rules then
17: assign storyline to event
18: end if
19: end if
Algorithm 3 categorizes storylines under events
applying the rules. Rules are broadcast to all the
nodes and the storylines RDD then has each story-
line in it run through the rules and associated with an
DISTL: Distributed In-Memory Spatio-Temporal Event-based Storyline Categorization Platform in Social Media
43

event if any rule matches the storyline to the event.
As soon as a storyline is associated with an event the
rules application ends. Based on number of entities in
a storyline that match rule’s theme, location or time, a
weight is assigned to storylines. For classifier events
the weights are normalized with the storylines classi-
fier score.
4 SYSTEM ARCHITECTURE
The system architecture of the platform to generate
events in storylines is shown in Figure 3. Due to large
number of storylines generated from tweets collected
on topics, the amount of data to be processed to gen-
erate events on the entities can be large. Event cre-
ation is performed as an extension to the DISCRN
platform. In-memory distribution is essential to com-
puting topics and perform feature selection based on
information gain as these techniques tend to be highly
iterative and do not scale well on disk based distribu-
tion paradigms such as MapReduce as disk I/O will
be highly detrimental to performance. The subsec-
tion 4.1 describes theme and dictionary creation com-
ponent while subsection 4.2 describes the component
that categorizes storylines into events.
4.1 Theme and Dictionary Creation
These modules generate themes from storylines, iden-
tify location and time entities and combine them to
create composite events.
• Process Storylines: This job in Spark reads the
storylines in parallel and extracts entities from
them. Vectors are built with indices of entities in
storylines.
• Determine Spatial and Temporal terms: This
module determines the spatial and temporal terms
using the GATE API. Each storyline is broken
down into entities in parallel and in each process
GATE APIs (Cunningham et al., 2014) are initi-
ated and used to label entities in the storyline doc-
ument. The entities identified in processing step
are used to create an index of entity strings to in-
tegers that is then used on storyline vectors in sub-
sequent step.
• Build Themes and theme dictionary terms: The
vectors built in processing step for each storyline
are passed to one of the three theme generation
routines.
1. When theme building process specified is topic
modeling the vectors are passed to the MLLib
LDA based topic modeling technique(Apache
and Spark, 2015a). This technique returns the
entities for the topics and their corresponding
weights for the topic. These are then saved as
dictionary for the theme.
2. If the specified theme building process is entity
selection based on information gain, the vectors
are passed into the information gain based en-
tity selection routine based on Maximum Rel-
evancy Minimum Redundancy(Apache et al.,
2015). This technique performs information
gain in parallel to generate a list of top k entities
for the labeled training set. This list is saved as
the dictionary for the theme event on which the
labels in training data are based.
3. For chosen theme building process classifica-
tion, the labeled data for storylines is used to
build an SVM model using the MLLib SVM
Spark routine(Apache and Spark, 2015b) that
build the model in parallel. This model is then
used to score the storylines and top k positively
labeled storylines entities are chosen and added
to the dictionary.
4.2 Events Creation and Storyline
Categorization
These modules assign storylines to generate events in
a scalable way. Storylines event assignment module
scores each storyline and determines which event they
will be assigned to based on user specified rules.
• Generate Events: This module generates events as
a combination of themes and spatiotemporal enti-
ties .
1. In case of topic modeling an event is gener-
ated for each topic with the top theme entity of
the topic, top location entity and top time en-
tity by weight combined to generate the spatio-
temporal event.
2. In case of feature selection top weighing theme,
location and time entity with highest informa-
tion gain value are combined to generate the
event that corresponds to class of labeled data.
3. In case of classifier, the most frequent theme,
location and time in positively labeled training
data is combined to generate event.
• Test storylines: This job loads theme, location
and time dictionaries in cache and is used to test
storylines in parallel to identify storylines that
fall within the event. Rules provided by end
user are broadcast to all nodes and processed and
information in the rules is used to determine how
to assign storyline to event
GISTAM 2016 - 2nd International Conference on Geographical Information Systems Theory, Applications and Management
44
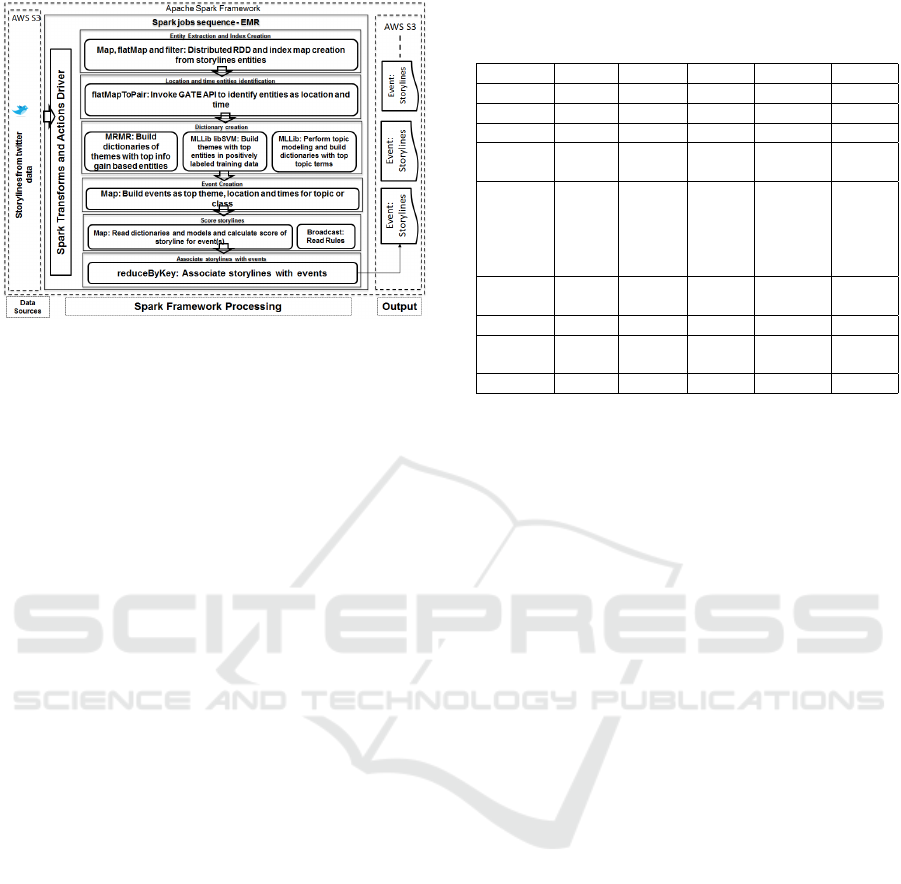
Figure 3: DISTL Architecture.
• Categorize storylines into events: This job catego-
rizes and lists in parallel events and the storylines
within them. Events are a combination of theme,
location and time in format theme:location:time.
5 USE CASES
This section describes the experiments performed to
validate event creation and storylines categorization
as scalable and useful to analysts. Three sets of story-
lines built on Twitter data extracted using keywords
filtering using Twitter streaming API in June 2015
were used. Subsection 5.1 describes events generated
for commodity oil, subsection 5.2 describes events
generated for company Avago and subsection 5.3 de-
scribes events on currency Euro.
The topic modeling technique uses LDA and pro-
duces topics with top keywords and weights added to
topic’s dictionary. After experiment with several topic
numbers, the subject expert decided on 3 as optimal
number of topics from which to generate events. That
number was within the constraints of not subdividing
an event into subevents and yet generate meaningful
results. Feature Selection based on Information gain
generates a dictionary of themes with highest infor-
mation gain. The features selection routine is given a
set of labeled observations based on a specified class.
The training data set is generated by a subject mat-
ter expert. For oil dataset a training set was built for
storylines related to oil prices, for Avago storylines
the training set was built for tech acquisition and for
euro dataset the training data was for Greek exit from
Euro. The classifier based themes dictionary creation
uses labeled data provided by subject matter expert. It
uses the training set to build a classifier. The most fre-
quent features are used as dictionary and top theme,
location and time terms are used to create the event.
Storylines with score higher than a threshold as clas-
Table 1: Oil topic modeling, Info Gain based Feature Selec-
tion and classifier labeled data based top entity weights.
topic1 weight topic2 weight topic3 weight
amp 0.033 amp 0.32 amp 0.0334
petroleum 0.023 petroleum 0.0266 petroleum 0.023
24 0.0150 gas 0.0129 canvas 0.011
feature info
gain
feature info
gain
feature info
gain
us $61.53 0.0335 weather
fueling
oil price
discov-
ery
0.0267 global
crude oil
price
0.0294
singapore 0.006 oil
prices
0.0288 17-Jun 0.0091
feature weight feature weight feature weight
petroleum 333 us
$61.53
58 oil price 77
london 44 reuters 61 17-Jun 15
sified by model and entities satisfying the categoriza-
tion rules are associated with the event. Storylines in
each event are assigned by testing the entities against
event’s location, time and theme entities. The rule
used to categorize storylines into events in our exper-
iments is ”location or time or theme”.
5.1 Oil Events
This subject is regarding tweets related to the com-
modity oil. The filtering keywords for tweets ex-
tracted are oil, wti, brent, crude, frack, fracking, oil
price, petroleum, petro, west texas intermediate, oil
inventory, oil production, oil refinery, #crudeoil and
nymex. The entry points for storylines are ’oil’ and
’petroleum’.
Applying topic modeling produces the topics
shown in Table 1.
The top entities for each topic are similar, two
’amp’ and ’petroleum’ being top entities in each of
the 3 topics and the third ranked entities being num-
ber 24, gas and canvas indicating one of the topics is
more related to painting oil.
Applying information gain based feature selection
generates the top terms shown in Table 1. These
weights more accurately reflect oil related storylines
as expected of a supervised technique as the top in-
formation gain weight terms are not only related to
oil but also to the price of oil which was the basis of
labeled data. Top features by classifier are in Table
1. These features accurately reflect the key entities in
training dataset specifically the ones most frequent in
positively labeled elements.
Top storylines based on events from top feature
selection entities are in Table 2. Top storylines by
weight for each topic from topic modeling as gener-
DISTL: Distributed In-Memory Spatio-Temporal Event-based Storyline Categorization Platform in Social Media
45

Table 2: Oil top storylines by LDA, Info Gain and classifier
weight.
topic event storyline LDA
weight
amp:north america:1988 oil:london #jobs:amp:sales man-
ager
0.0422
amp:north america:1988 oil:amp:deals:funnel 0.0400
petroleum:london:17-Jun oil:london #jobs:amp:sales man-
ager
0.0422
petroleum:london:17-Jun amp:seed oil unrefined
100:deals
0.0401
gas:greece:today oil:amp:engine oil:gas 0.0480
gas:greece:today oil:grease:paper 10 sets face
care:amp
0.0470
topic event storyline info
gain
weight
us $61.53:singapore:17-
Jun
oil:petroleum:us $61.53:global
crude oil price
0.0629
us $61.53:singapore:17-
Jun
oil:petroleum:us $61.53:weather
fueling oil price discovery
0.0602
us $61.53:singapore:17-
Jun
oil:reuters:oil prices:production 0.0513
topic event storyline classifier
weight
petroleum:london:17-Jun oil:long:iran:petroleum 1.2209
petroleum:london:17-Jun oil:petroleum:oil price:our 2015
global #oil
1.1375
petroleum:london:17-Jun oil:brent oil forecast. current
price:petroleum:global crude oil
price
1.1114
ated by application of rules are in Table 2. Top story-
lines based on events from classifier based top themes,
locations and time entities are in Table 2. These cat-
egorizations clearly show that storylines in same set
get categorized differently under different events sim-
ply due to application of different entity ranking tech-
niques.
5.2 Avago Events
For this subject tweets regarding the company Av-
ago with aggressive acquisition strategy with key-
words Avago, AVGO, $AVGO, Broadcom, BRCM,
#BRCM, #AVGO, Emulex, ELX, Xilinx, Renesas,
$MXIM, Maxim Integrated Products, MXIM, Altera,
ALTR, $ALTR and semiconductor are extracted. The
entry point for storylines generation is ’avago’.
Applying topic modeling generates the topics
shown in Table 3. These features like in oil study are
similar for all topics with difference terms indicating
differences in 3 topics emerging only in third high-
est weight entity in each topic indicating differences
between internet or chip designer Altera based topics.
Applying information gain based feature selection the
top terms obtained are in Table 3. These entities are
different from the ones generated from topic model-
ing and being based on labeled data clearly show fo-
Table 3: Avago top entities by topic weight, info gain
weight and labeled data frequency.
topic1 weight topic2 weight topic3 weight
intel 0.0535 intel 0.0535 intel 0.0527
$16.7
billion
0.0335 $16.7 bil-
lion
0.0336 $16.7 bil-
lion
0.0337
the internet 0.0109 chip de-
signer
altera
0.0085 the inter-
net
0.1103
feature info
gain
feature info
gain
feature info
gain
los angeles
times
0.1626 7shjqsse99 0.0515 altera
$15b deal
talk
0.0450
programmable
gate array
chips
0.0384 intel 0.0460 shareholders 0.0391
$17b cash
deal
376 $54 a
share
66 intel 144
feature weight feature weight feature weight
$17b cash
deal
376 intel 144 $54 a
share
66
1-Jun 16 altera
$15b deal
talk
128 seattle 1
cus on Avago’s acquisition with Altera and Intel in
the mix and its coverage in newspapers. The top fea-
tures obtained by classifier are in Table 3 and are also
oriented towards training data provided. Top story-
lines based on events from top feature selection enti-
ties are shown in Table 4. Top storylines by weight for
each topic as generated by application of rules are in
Table 4. Top storylines based on events from classi-
fier based top themes, locations and time entities are
in Table 4. These storylines clearly show that from
top entities generated from both supervised and unsu-
pervised techniques the storylines categorized under
them are extremely focused on the deal with few unre-
lated events being generated unlike in case of oil. This
was also partly due to the subject Avago being less
ambiguous and conflicting with unrelated subjects.
5.3 Euro Events
This subject involves tweets regarding the change in
value and status of the currency euro. Filtering key-
words Euro, Euro exchange rate, euro rates, euro-
dollar, dollar euro, euro crisis, euro conversion, euro
rate, eur and eur usd are specified for tweet collection.
The entry point for storylines is ’euro’.
On euro related storylines we applied event gen-
eration techniques. Applying topic modeling gener-
ates the topics shown in Table 5. Three topics were
provided to the LDA method. The top entities were
similar for the three topics with the difference be-
ing in third highest weighted entity indicating topics
being related to emergency summit over Greek cri-
GISTAM 2016 - 2nd International Conference on Geographical Information Systems Theory, Applications and Management
46

Table 4: Avago top storylines by topic modeling, Info Gain
based Entity Selection and Classifier based events.
topic event storyline LDA
weight
intel:1-Jun:chicago avago:intel:$16.7 bil-
lion:shareholders
0.0908
intel:1-Jun:chicago avago:intel:$17b cash deal:$16.7
billion
0.0929
$16.7 bil-
lion:bristol:today
avago:intel:$16.7 billion:santa
clara
0.0929
$16.7 bil-
lion:bristol:today
avago:intel:$16.7 billion:boost
data center business
0.9340
the inter-
net:pakistan:2015
avago:$16.7 billion:usatoday:intel 0.0924
the inter-
net:pakistan:2015
avago:intel:$16.7 billion:$54 a
share
0.0909
topic event storyline info
gain
weight
los angeles times:2015 avago:intel:ap news:los angeles
times
0.0210
los angeles times:2015 avago:shareholders:los angeles
times:asics und programmierbare
schaltungen
0.2137
los angeles times:2015 avago:chipmaker al-
tera:7shjqsse99:los angeles
times
0.2142
topic event storyline classifier
weight
$17b cash
deal:seattle:1-Jun
avago:$17b cash
deal:techpreneur:$54 a share
1.8772
$17b cash
deal:seattle:1-Jun
avago:$54 a share:biz:altera $15b
deal talk
1.7493
$17b cash
deal:seattle:1-Jun
avago:an all:brcm bid:$54 a share 1.7197
sis. The top features by classifier are shown in Ta-
ble 5. These features are more accurately related to
the Greek exit due to the application of training data
on the subject provided. Applying information gain
based feature selection produces the top terms shown
in Table 5. These entities are also highly relevant due
to use of training data. Top storylines by weight for
each topic as generated by application of rules are in
Table 6. Top storylines based on events from from
top feature selection entities are given in Table 6. Top
storylines based on events from classifier based top
themes, locations and time entities are provided in Ta-
ble 6. These storylines clearly show the preponder-
ance of storylines on Greek exit crisis from the Euro
at the time and the Federal Open Market Committee
meeting on June 18, 2015.
5.4 Analysis
The analysis of oil brought mixed results, which is po-
tentially explained by the broad range of topics cov-
ered by the term oil. For example, oil is associated
with petroleum, body oil, oil paintings and other cate-
Table 5: Euro top entities by info gain feature selection,
topic modeling and classifier weights.
feature weight feature weight feature weight
the euro 0.0136 the euro 0.0137 the euro 0.0139
eur 0.012 eur 0.0123 eur 0.0121
luxemborg 0.0055 emergency
summit
0.0064 2015 0.008
feature info
gain
feature info
gain
feature info
gain
greek exit 0.0621 0.049 0.0302 0.03 0.0461
18 june
#football
#soccer
#sports
0.0282 0.08 0.0473 syriza
hardliners
back
0.0228
feature weight feature weight feature weight
greek exit 194 yesterday’s
fomc
meeting
91 72.43 108
2015 24 1199.9 97 greece 83
gories unrelated to the area of focus. Thus, the topics
and associated storylines identified by topic modeling
shown in Table 1 and Table 2 hold limited relevance
and add little to the understanding of oil prices. The
results from topic modeling were also clouded by the
entity ’amp’ which actually refers to the character ’&’
and was erroneously picked up as an entity. However,
the information gain and classification models did re-
veal interesting topics and storylines. First, the inter-
national crude oil price of Indian Basket as computed
by the Ministry of Petroleum and Natural Gas of the
Republic of India was $61.53 per barrel on June 16,
2015, an informative metric given India is one of the
largest importers of petroleum in the world and the
Indian government heavily subsidizes those imports.
Second, the entity ’weather fueling oil price discov-
ery’ alluded to the foul weather moving through Texas
at that time which was expected to impact oil produc-
tion and thus prices.
For the Avago analysis, topic modeling produced
better results versus for oil, as Intel’s $16.7 billion
acquisition of Altera for $54 per share was correctly
highlighted. This event and associated storylines were
highlighted throughout the results of topic modeling,
information gain, and classification algorithms. Fi-
nally, on the analysis of the Euro dataset, topic mod-
eling, information gain, and classification all high-
lighted the crisis occurring in Greece’s economy and
the potential of a Greek Exit from the Euro. Topic
modeling even highlighted the emergency summit
taking place in Luxembourg to discuss the situation.
In this case, the information gain based feature selec-
tion analysis generated the most noise as the highest
weighted features included indiscernible numbers and
entities related to sports even though two of the fea-
tures were ’greek exit’ and ’syriza hard-liners back’.
DISTL: Distributed In-Memory Spatio-Temporal Event-based Storyline Categorization Platform in Social Media
47
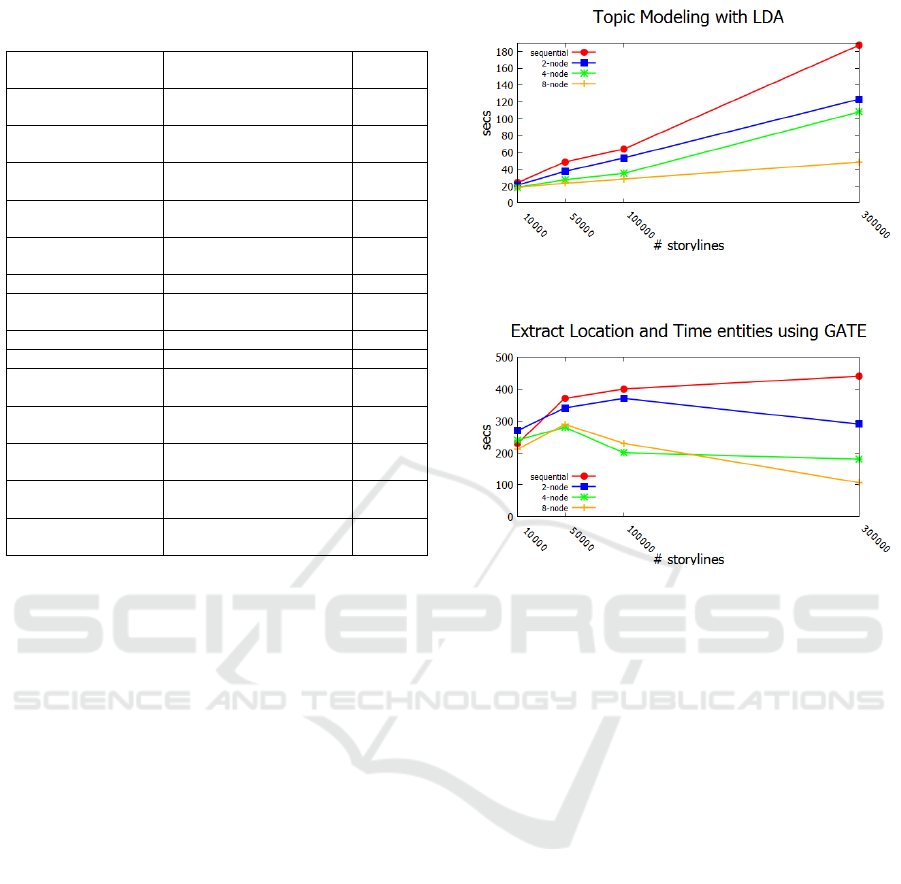
Table 6: Euro top storylines by event and topic modeling,
info gain and classifier weights.
topic event storyline LDA
weight
the euro:2015:luxemborg euro:zone ecofin meetings:the
euro:eur
0.03106
the euro:2015:luxemborg euro:dibebani yunani:eur:the
euro
0.02900
eur:19-Jun:greece euro:zone ecofin meetings:the
euro:eur
0.0309
eur:19-Jun:greece euro:dibebani yunani:eur:the
euro
0.0288
amp:this day:edinburg euro:zone ecofin meetings:the
euro:1.7:0
0.0207
amp:this day:edinburg euro:lows:6:eur 0.0215
topic event storyline info gain
weight
greek exit:greece:18 June euro:2:0.08:#dollar 0.0068
greek exit:greece:18 June euro:gold:0.13:0.08 0.029
greek exit:greece:18 June oil:gas temp:marks sattin:#cash
#applications accountant
0.29
topic event storyline classifier
weight
greek exit:greece:2015 euro:yesterday’s fomc meet-
ing:greek exit:support
1.3681
greek exit:greece:2015 euro:yesterday’s fomc meet-
ing:greek exit:greece #euro
1.3410
greek exit:greece:2015 euro:central bank:greeks them-
selves:greece
1.2701
The number of storylines an analyst has to review is
greatly reduced for events, for SVM the number of
storylines is reduced to 933 from over 300000 when
threshold of 1.0 is set for the SVM scores.
6 PERFORMANCE
The performance of the techniques used in event cre-
ation at different levels of distribution is evaluated in
this subsection. The results for running the techniques
on various sized clusters are presented. The exper-
iments were run on AWS using Elastic MapReduce
clusters running Spark. This allows for clusters to
be configured on demand on the cloud so that scal-
ability of the techniques on different sized datasets
and clusters can be tested. Cluster nodes are of type
m3.2xlarge with 8 vCPU processors and 30GB of
RAM.
Figure 4 shows the performance of topic model-
ing on various sized clusters. The same code run on
a single node is an approximation of how similarly
written single node sequential version will perform.
The results show clearly that with increasing number
of storylines, the time taken to perform topic model-
ing on the storylines does not increase significantly on
an 8 node cluster but continues to increase for sequen-
tial runs. Beyond a dataset of certain size the single
node execution generates out of memory errors. Topic
Figure 4: Performance of topic modeling on various cluster
and storyline data sizes.
Figure 5: Performance of spatio-temporal entity creation on
various cluster and storyline data sizes.
modeling is highly iterative hence its distribution is
critical to its being able to scale to larger datasets. Re-
sults are similar for Information gain based features
selection and SVM modeling executions on multiple
sized training datasets.
Figure 5 shows the performance of spatio-
temporal entity identification. The results clearly
show that the process of identifying spatial and tem-
poral entities is highly parallelizable with testing each
storyline against GATE API independent of others.
Figure 7 shows storylines categorization performance
using feature selection generated information gain
weights. These results show that once feature selec-
tion has generated top info gain entities, categorizing
storylines under those events is highly parallelizable
and scalable with running times staying stable with
increasing data and cluster sizes.
Figure 6 shows results for categorizing storylines
into events using topic modeling weights. This was
done for 3 topics and each storyline was tested against
multiple events, yet the process is highly scalable and
parallelizable.
Figure 8 shows the performance of scoring story-
lines using SVM classifier. This is also highly par-
allielizable as once a model is built, it can score sto-
rylines independent of each other. The performance
over increasing larger test datasets and clusters shows
GISTAM 2016 - 2nd International Conference on Geographical Information Systems Theory, Applications and Management
48
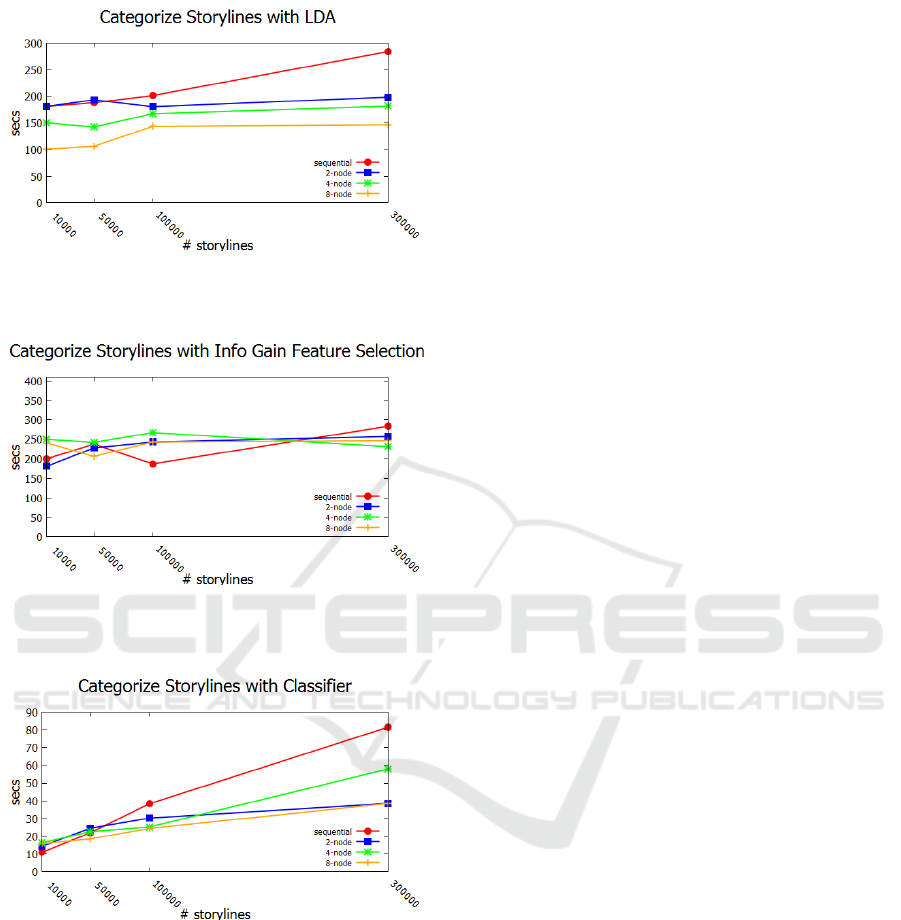
Figure 6: Performance of storylines categorization into
events generated from topic modeling on various cluster and
storyline data sizes.
Figure 7: Performance of storylines categorization into
events generated from feature selection on various cluster
and storyline data sizes.
Figure 8: Performance of storylines categorization based
on svm model scoring on various cluster and storyline data
sizes.
that this is highly scalable.
The results clearly show the scaling of events gen-
eration for storylines for large datasets. Increasing
the size of cluster allows full horizontal scaling in
DISTL. Increased overhead of Spark in some cases
results in deterioration in performance on small clus-
ters as compared to serial execution on small datasets
but with larger sets of storylines the performance im-
proves vastly.
7 CONCLUSIONS
Our work shows the effectiveness of our technique
in identifying events at a large scale. The use of
DISCRN platform is extended to event creation in
DISTL. The supervised and unsupervised event cre-
ation incorporates domain expert knowledge and then
provides summarized dictionaries relevant to the set
of storylines. The resulting events incorporate loca-
tion and time and are useful in allowing analyst to
comb through storylines categorized by events and
find proverbial needles in haystacks of storylines. Ex-
periments show that in-memory processing allows
scaling to happen by simply increasing the distribu-
tion platform cluster sizes as needed.
REFERENCES
Agarwal, C. and Subbian, K. (2012). Event detection in
social streams. SDM, pages 624–635.
Apache and Spark (2015a). https://spark.apache.org/docs
/latest/mllib-clustering.html#latent-dirichlet-
allocation-lda.
Apache and Spark (2015b). https://spark.apache.org/
docs/latest/mllib-linear-methods.html#linear-support-
vector-machines-svms.
Apache and Spark (2015c). Spark programming guide.
http://spark.apache.org/docs/latest/programming-
guide.html.
Apache, Spark, and Packages (2015). https://github.com/
wxhc3sc6opm8m1hxbomy/spark-mrmr-feature-
selection.
Chae, J., Thom, D., Bosch, H., Jang, Y., Maciejewski, R.,
Ebert, D., and Ertl, T. (2012). Spatiotemporal social
media analytics for abnormal event detection and ex-
amination using seasonal-trend decomposition. In Vi-
sual Analytics Science and Technology (VAST), 2012
IEEE Conference on, pages 143–152.
Chen, F. and Neill, D. B. (2014). Non-parametric scan
statistics for event detection and forecasting in hetero-
geneous social media graph. In ACM SIGKDD, pages
1166–1175.
Cunningham, H., Maynard, D., Bontcheva, K., and Tablan,
V. (2014). Developing language processing compo-
nents with gate version 8. University of Sheffield De-
partment of Computer Science.
Dean, J. and Ghemawat, S. (2008). Mapreduce: Simpli-
fied data processing on large clusters. Commun. ACM,
51(1):107–113.
Jingshu Weng, B.-S. L. (2011). Event detection in twitter.
AAAI, pages 401–408.
Keskis
¨
arkk
¨
a, R. and Blomqvist, E. (2013). Semantic com-
plex event processing for social media monitoring-a
survey. In Proceedings of Social Media and Linked
Data for Emergency Response (SMILE) Co-located
with the 10th Extended Semantic Web Conference,
DISTL: Distributed In-Memory Spatio-Temporal Event-based Storyline Categorization Platform in Social Media
49

Montpellier, France. CEUR workshop proceedings
(May 2013).
Lappas, T., Vieira, M. R., Gunopulos, D., and Tsotras, V. J.
(2012). On the spatiotemporal burstiness of terms.
Proceedings of the VLDB Endowment, 5(9):836–847.
Leetaru, K. and Schrodt, P. A. (2013). GDELT: Global
Database of Events, Language, and Tone. In ISA An-
nual Convention.
Li, C., Sun, A., and Datta, A. (2012a). Twevent: Segment-
based event detection from tweets. In (Conference on
Information and knowledge Management, pages 155–
164.
Li, R., Lei, K. H., Khadiwala, R., and Chang, K. (2012b).
Tedas: A twitter-based event detection and analysis
system. In Proc. 28th IEEE Conference on Data En-
gineering (ICDE), pages 1273–1276.
Petrovic, S., Osborne, M., McCreadie, R., Macdonald, C.,
Ounis, I., and Shrimpton, L. (2013). Can twitter re-
place newswire for breaking news? In 7th Interna-
tional AAAI Conference On Weblogs And Social Me-
dia (ICWSM).
Pohl, D., Bouchachia, A., and Hellwagner, H. (2012). Auto-
matic sub-event detection in emergency management
using social media. In Proceedings of the 21st Inter-
national Conference Companion on World Wide Web,
WWW ’12 Companion, pages 683–686, New York,
NY, USA. ACM.
Radinsky, K. and Horvitz, E. (2013). Mining the web to
predict future events. WSDM, pages 255–264.
Reuter, T., Buza, L. D. K., and Schmidt-thieme, L. (2011).
Scalable event-based clustering of social media via
record linkage techniques. In ICWSM.
Saha, A. and Sindhwani, V. (2012). Learning evolving and
emerging topics in social media: A dynamic nmf ap-
proach with temporal regularization. In Proceedings
of the Fifth ACM International Conference on Web
Search and Data Mining, WSDM ’12, pages 693–702,
New York, NY, USA. ACM.
Sakaki, T., Okazaki, M., and Matsuo, Y. (2010). Earthquake
shakes twitter users: Real-time event detection by so-
cial sensors. WWW, pages 851–860.
Shukla, M., Santos, R. D., Chen, F., and Lu, C.-T. (2015).
Discrn: A distributed storytelling framework for in-
telligence analysis. Virginia Tech Computer Science
Technical Report http://hdl.handle.net/10919/53944.
Walther, M. and Kaisser, M. (2013). Geo-spatial event de-
tection in the twitter stream. In Advances in Informa-
tion Retrieval, volume 7814 of Lecture Notes in Com-
puter Science, pages 356–367. Springer Berlin Hei-
delberg.
Zaharia, M., Chowdhury, M., Das, T., Dave, A., Ma, J., Mc-
Cauly, M., Franklin, M. J., Shenker, S., and Stoica, I.
(2012). Resilient distributed datasets: A fault-tolerant
abstraction for in-memory cluster computing. In Pre-
sented as part of the 9th USENIX Symposium on Net-
worked Systems Design and Implementation (NSDI
12), pages 15–28, San Jose, CA. USENIX.
Zhao, L., Chen, F., Dai, J., Lu, C.-T., and Ramakrishnan, N.
(2014). Unsupervised spatial events detection in tar-
geted domains with applications to civil unrest mod-
eling. PLOS One, page e110206.
Zhao, L., Chen, F., Lu, C.-T., and Ramakishnan, N. (2015).
Spatiotemporal event forecasting in social media. In
SDM, pages 963–971.
Zhou, X. and Chen, L. (2014). Event detection over twitter
social media streams. The VLDB Journal, 23(3):381–
400.
GISTAM 2016 - 2nd International Conference on Geographical Information Systems Theory, Applications and Management
50
