
Directional Cellular Dynamics for Tissue Morphogenesis and Tumour
Characterization by Aggressive Cancer Cells Identification
Abdoulaye Sarr
1
, Petra Miglierini
2
, Alexandra Fronville
1
and Vincent Rodin
1
1
Computer Science Department, Universit
´
e de Brest, UMR CNRS 6285, Lab-STICC, CID, IHSEV,
20 avenue Le Gorgeu, Brest, France
2
Department of Radiotherapy, University Hospital Morvan, Institute of Oncology and Haematology,
2 avenue Foch, Brest, France
Keywords:
Morphogenesis, Tissue Prediction, Tumour Classification, Viability Algorithms.
Abstract:
Due to the availability of large amount of medical data and the improvements of computers’ capacities, an
increase of tools for medical applications has been noted. In the case of cancer, this results in some application
and treatment successes in radiotherapy. However, on the one hand, high therapeutic results are yet to be seen,
and on the other hand, unpleasant side effects are still widely observed. In the first case, it may arise from the
avoidance of any damage to healthy structures implying ineffective treatment, and in the second case it may
be, due to lethal doses deposited in the tumour, leading to an unacceptable damage to one or more healthy
structures. Thus, it would be useful to simulate the effects of any treatment prior to its application. Thereby,
we are focusing on the proposition of computational methods serving to give insights for decisions aid tools in
radiotherapy. In this paper, we provide algorithms for tissue growth prediction where cells are elements of a 2D
cellular automaton oriented multi-agent system. Then, we propose a novel method to predict and characterize
the evolution of a pathological tissue under cells irradiation. We show that the more cells destroyed during the
radiotherapy are linked to aggressive cancer cells, the more the treatment lead to an impaired result in terms
of growth. By contrast, we highlight that there exists cells less linked to these aggressive cancer cells that are
more suitable to target for an effective and efficient radiotherapy. Based on the dominant cells (linked or not
linked to aggressive cancer cells), we introduce a novel method to classify tumours.
1 INTRODUCTION
Cancer is one of the most serious worldwide health
issues with respect to its incidence and mortality. The
main treatment besides surgery and chemotherapy is
radiotherapy. Tumour growth and response to radio-
therapy have become subject to many studies by com-
puter scientists. This results in techniques which are
able, for instance, to give a prediction of the tumour
growth, from which it can be possible to decide if it is
required or not to invoke immediately a therapy.
Indeed, given the pace of technological advances,
software solutions for medical supports are more and
more developed despite the considerable challenges.
In cancer field, several planning strategies have been
developed. For example, early radiotherapy treatment
used forward treatment planning which consists of
specifying values for all parameters, then the dose cal-
culation software computes the dose distribution. If
this latter is judged not acceptable by the oncologist,
the initial values of the parameters are then adapted
by trial-and-error until the dose distribution is sat-
isfactory. This is used in (Henzen et al., 2014) for
modulated electron radiotherapy. An electron beam
model is used to calculate dose distributions of elec-
tron beams shaped by a photon multi leaf collimator.
Conversely, inverse planning is to specify the desired
outcome (such as dose distribution) and to compute
beam intensities that produce this outcome without
any trial-and-error process (Ehrgott and Winz, 2008).
In any case, planning strategies are expected to be
enough efficient and reliable to help achieving highly
accurate therapies.
In section 2, we present our morphogenesis model
that underlies the growth of tumours and allows to
predict their evolution for a desired number of cells
to reach. It is in terms of instructions for cells (divi-
sion by choosing a specific geometric direction, qui-
escence, differentiation) that have governed the evolu-
tion of the tissue from a previous state (which can be
290
Sarr, A., Miglierini, P., Fronville, A. and Rodin, V.
Directional Cellular Dynamics for Tissue Morphogenesis and Tumour Characterization by Aggressive Cancer Cells Identification.
DOI: 10.5220/0005830702900295
In Proceedings of the 9th International Joint Conference on Biomedical Engineering Systems and Technologies (BIOSTEC 2016) - Volume 3: BIOINFORMATICS, pages 290-295
ISBN: 978-989-758-170-0
Copyright
c
2016 by SCITEPRESS – Science and Technology Publications, Lda. All rights reserved

its first cell) until its current state (made by a few pair
of cells). Thus, assuming that the tissue is only sub-
ject to these instructions in a well-guided morphogen-
esis process, we deduce its evolution for latter times
(section 3). Thereby, according to the predicted evo-
lution, one can conclude if a therapy is required and
which one is more convenient. In the case where this
is radiotherapy, we propose to simulate the effects of
cells irradiation on the tumour’s growth so as to de-
termine if the destroyed cells are linked or not to the
aggressive cancer cells (section 4). In this paper, we
consider that beams’ modality, geometry and inten-
sity are given, while we are focusing on the target of
the beams, i.e cells. We are interested in knowing the
cells which are relevant to irradiate and those which
are not. Besides, since we have an individual-based
model whose morphological dynamic relies mainly
on spatial constraints of cells, we have been much
more concerned to know which cells have to be ap-
propriately chosen for irradiation rather than how the
radiation parameters have to be set. Hence, we focus
on the impacts of the destruction of certain cells on
tumour’s growth. In other words, the death of which
cells of the tumour will make it grow:
• slower ?
• faster ?
• or normally ?
Each cell of the tumour can be classified according
to the effect it involves among these three. The largest
cell type determines the category of the tumour. The
categorization we propose in section 5 allows us to
know in advance the expected results of potential ra-
diotherapy of tumours. We present in section 6 some
future works that aim to acknowledge some limiting
factors of studying cancer in vivo and even more so
through in silico experiments.
2 VIABILITY CONCEPTS FOR
MORPHOGENESIS
Rely on the viability theory to tackle issues in mor-
phogenesis requires first to properly define some con-
cepts of this theory in the case of multicellular sys-
tem. In previous work, we described mathematically
the state, controls and both local and global morpho-
logical dynamics of tissues. Some points of that for-
malization are highlighted in this section.
K ⊂ P (X) denotes the morphological environ-
ment (X = R
2
denotes the set of containment cells,
contained in the complement of vitellus
1
).
1
In biology, the vitellus is the energy reserve used by the
Cells x ∈ X ∪
/
0 are either characterized by their
position (living cells) or by their death made of tis-
sues L which are subsets of cells (L ∈ P (X)).
The subset of eight genetic actions d of cells is:
A := {(1, 0, 0), (−1, 0, 0), (0, 1, 0), (0, −1, 0), (0, 0, 1),
(0, 0, −1), (0, 0, 0),
/
0}
A is made of the six geometric directions, the ori-
gin and the empty set. Here, we restrict morphogene-
sis in the plan:
A := {(0, 1), (0, −1), (1, 0), (−1, 0), (0, 0),
/
0}
For convenience, we replace
(0, 1), (0, −1), (1, 0), (−1, 0), (0, 0) and
/
0 re-
spectively by 1, 2, 3, 4, 5 and 6.
A := {1, 2, 3, 4, 5, 6}
These genetic actions allow to describe cells’ be-
haviours:
1. Transitions x 7→ x + d, where d ∈ {1, 2, 3, 4} (ac-
tion)
2. Quiescence x 7→ x + 5 = x (no action)
3. Apoptosis x 7→ x + 6 = 6 (programmed cell death)
A genetic process g is a possible combination of
genetic actions g := {d
1
, ..., d
i
} ∈ A
i
. Operating a ge-
netic process under a given criterion, either for mi-
gration or for division, means that the process scans
successively x + d
1
, ..., x + d
i
until the first time when
the criterion is satisfied. For every tissue (phenotype),
there is a set of specific genetic processes (genotype)
that allows to achieve it starting from a single cell.
We had generated the all phenotypes that can be ob-
tained after any number of division (1, 2, 3 or 4) of a
single cell (Sarr et al., 2014). Indeed, starting with a
single cell, at each step, we compute from the previ-
ous tissues all the possible configurations of tissue we
can reach by cell division. This issue is a particular
case of polyominoes computing while we have added
some biological constraints. The configurations are
saved in the edges of a graph. Besides, we save in
vertices all the events that have been involved : divi-
sion, quiescence, differentiation. Thereby, from any
edge in the graph, we can reconstruct the way back
to the single cell. This characterization results in the
determination of the lineage of any phenotype and us-
ing that lineage we construct the underlying genotype
with respect to our model (see example in figure 1).
A genetic process is identified by its colour. All cells
whose last division is achieved with that genetic pro-
cess carry its colour and thus define a pattern. For
prediction, these genetic processes will be the con-
trols that allow cells to behave in their environment
according to some rules that will be described in the
following section.
embryo during its development.
Directional Cellular Dynamics for Tissue Morphogenesis and Tumour Characterization by Aggressive Cancer Cells Identification
291
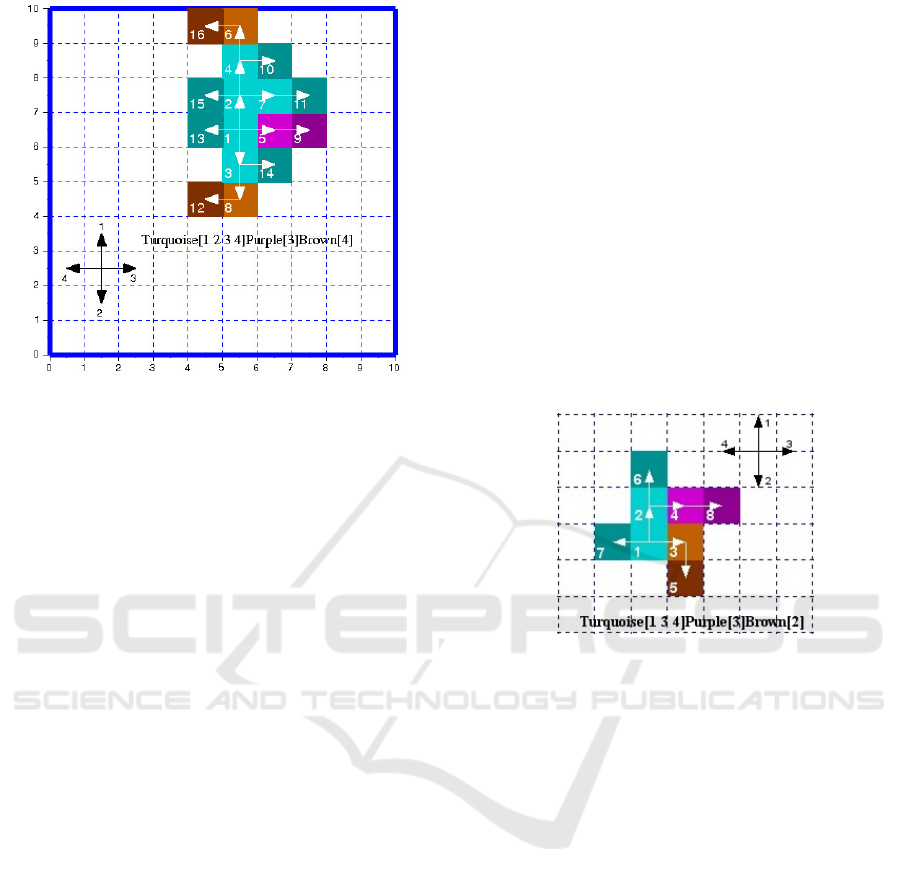
Figure 1: One of the 1029 possible phenotypes and its geno-
type obtained after 4 division of a single cell. The tissue
shows three colours representing three genetic processes :
turquoise, purple and brown. Each is an ordered se-
quence of the four genetic actions (1:north, 2:south, 3:east
and 4:west). These genetic processes are the minimum re-
quired ones to design this tissue. The colour level distin-
guishes cell status during the division cycle. Light coloured
cells are the ones already divided and the dark ones are
those newly created in the cycle, they are both quiescent.
The third category does not appear in this figure, they are the
proliferating cells which are awaiting to division (medium
coloured). Besides, the three colours show that two differ-
entiations occur while generating this tissue. Indeed, if a
cell has to change a genetic process to be able to divide, its
colour and that of its daughter are set to the colour of the
new genetic process. A tissue appearing with one colour
would mean that it is made of just one genetic process and
no differentiation occurs, i.e all cells were able to divide
using the same ordered sequence of genetic actions. The
arrows distinguish cell lineage as the creation of the tissue
goes on.
3 TISSUE’S SHAPE PREDICTION
The prediction determines the state of a tissue in any
latter times, given a number of cells or a number of
division cycles. The genetic processes are applied to
make the tissue grow for latter times through the cel-
lular mechanisms of mitosis, quiescence and differ-
entiation. The action of one cell x involves a local
morphological dynamic which locally transforms the
tissue L at a local process time. The global morpho-
logical dynamic transforms the morphological envi-
ronment K at the end of every cell division cycle af-
ter the processing of all cells. The only constraints
this growth can face are spatial ones, arising from the
morphological environment and cells themselves.
Our 2D model consists of a grid of automaton ele-
ments which represent our biological cells. The state
of each element is defined by a state vector including
three components that correspond to the features of
interest in this case study: (i) occupation, i.e. an ele-
ment is either occupied by a cell or is an empty space,
(ii) cell status, i.e. the cell is either in a proliferative
state (allowed to divide), quiescent (to prevent cells
newly created or already processed in the current di-
vision cycle to divide) or locked due to a lack of space
for division in the four possible directions (by setting
to “on” the evolution lock factor of the cell : ELF) and
(iii) cell colour that identifies the genetic process it is
associated with (dark level meaning that ELF is “on”
and light level meaning that ELF is “off”).
An example is presented below. Figure 2 repre-
sents the current state of the tissue and figure 3 the
results of the prediction.
Figure 2: This is one of the 61 phenotypes reached after 3
division cycles of a single cell. We can notice also the three
genetic processes that are put into play.
After having predicted the evolution of the tu-
mour, it may appear that a radiotherapy is required
to give some survival benefits to the patient. In the
following section, we propose a decision support to
assess the impacts of cells irradiation on a tumour’s
growth. By the way, this simulation allows us to make
a classification of the tumour’s cells with respect to
the impact of their removal from the tumour. We
assume that the cells whose removal causes a high
growth of the tumour are strongly linked to the ag-
gressive cancer cells.
4 TUMOUR’S CELLS
IRRADIATION
To the point that surgeons cannot remove the tumour,
radiotherapy can be an interesting alternative since it
can shrink or at least slow down the growth of the
tumour over time. This would significantly improve
patients’ quality of life.
Radiotherapy is one of the many therapies to
treat cancer. It consists of using high energy doses
BIOINFORMATICS 2016 - 7th International Conference on Bioinformatics Models, Methods and Algorithms
292
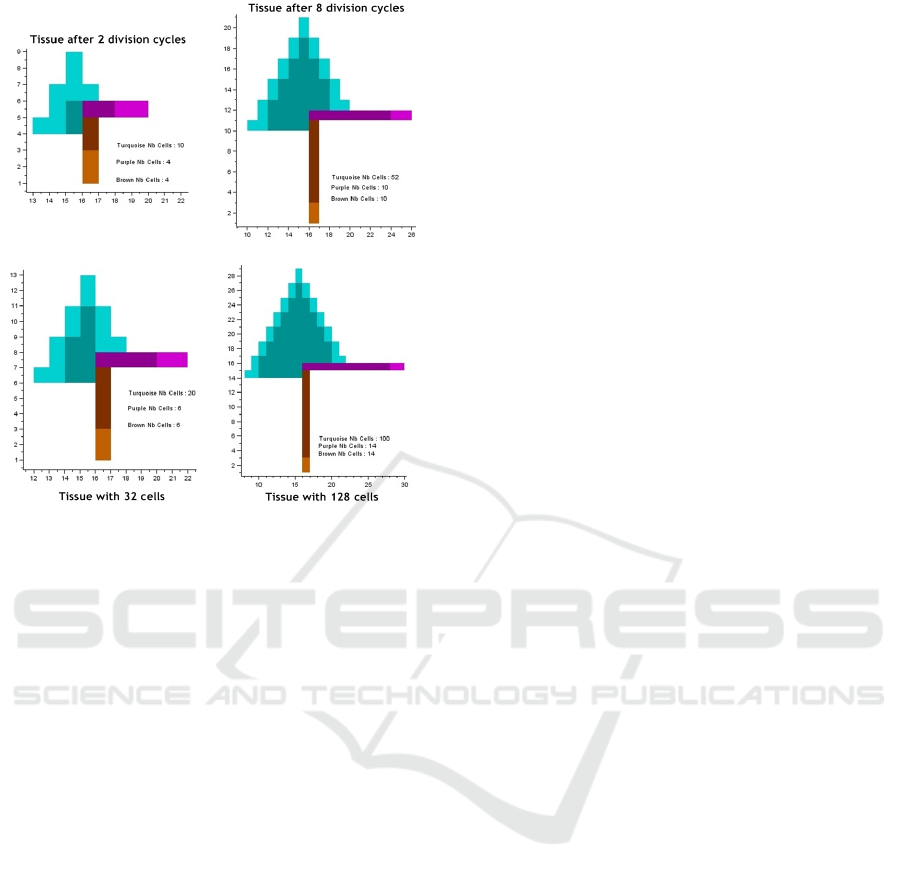
Figure 3: We show two prediction cases: after some given
number of division cycles (top) and with a certain number
of cells (down).
of radiation to destroy cancer cells while sparing
the surrounding healthy tissues. Radiotherapy is di-
rected towards a particular location of the body unlike
chemotherapy, for instance, which is a systemic treat-
ment that spreads throughout the whole body.
Even though the prediction method we present
above can provide a future view of the tumour, for
probable comparison, classification and even for pre-
scribing suitable therapeutic scenarios, it gives no
proposal towards the therapy itself. For the sake of
effective and efficient radiotherapy, it would be inter-
esting to know the role of the cells which are intended
to be destroyed in the fate of the tumour. In fact, ac-
cording to the phenotype of a tumour and its morpho-
logical dynamic governed by its genotype, there ex-
ists among all cancer cells, some which are strongly
linked to the aggressive ones. Knowing that destroy
those cells will result in a high growth, we would bet-
ter identify them and avoid them while irradiating the
tumour. Some studies reported that sublethal radi-
ation could promote expansion of cancer stem cells
which are a subpopulation of the tumour resistant to
the conventional cancer therapies including radiother-
apy (Suh and Lee, 2015). The aggressive cancer cells
can be identified by the most proliferative cells after
the tumour radiation. Indeed, the removal of a cell
can either flow to the degeneration of the tumour or
lead to its regeneration with a higher growth.
In our proposition, to assess if a cell is linked or
not to the aggressive cancer cells, we simulate its re-
moval and then let the tumour grows during a given
number of division cycles. Finally we compare the
growth rate with the one if there is no irradiation. If
we notice that the growth is faster than the normal, we
consider that the irradiation of that cell will be “dan-
gerous”, because linked to the aggressive cancer cells.
If it is similar to that, we consider that the irradiation
will have neither a benefit, nor a harmful effects, it is
just “unproductive”. And if it is slower than that, the
irradiation will be an “effective” one, because the cell
is independent from the aggressive cancer cells.
We have implemented algorithms relying on these
principles to identify each cell in any given tumour
with respect to the aggressive cancer cells. When the
technique is applied to the tissue depicted in figure 2,
the results are as follows (assessment of the growths
are done after 20 division cycles):
• Removal of cell number 6 is the most effective,
it leads to the slowest growth (4% smaller than the
normal).
• Removal of cell number 3 is the most danger-
ous, it leads to the fastest growth (5% bigger than
the normal)
• Removal of cells number 1, 7, 4 and 2 are
all unproductive. The growth of the tumour will
remain the same as the normal
Thereby, we are able to put light on the role that
the death of each cell would have on the fate of the
tumour. This allows to identify three types of cells
within a tumour. Afterwards, we will rely on these
results to characterize any tumour with respect to the
type of cells that mainly composes it.
5 TUMOUR
CHARACTERIZATION
Main tumours classification techniques are based on
shape factors of tumours’ regions and texture mea-
sures. For instance, (Ng and Bischof, 1992) proposed
a method for the mammographic detection and clas-
sification of two types of breast tumours. The method
identified them as follows: circular, bright masses
with a fuzzy boundary and stellate lesions surrounded
by a radiating structure of sharp. In (Rangayyan et al.,
1997), it is highlighted the importance of combining
lesion edge definition with shape information for tu-
mours classification. The potential of acutance is used
to quantify the sharpness of tumours’ boundaries. An
application of this technique is proposed to discrim-
inate between benign and malignant mammographic
Directional Cellular Dynamics for Tissue Morphogenesis and Tumour Characterization by Aggressive Cancer Cells Identification
293
tumours. Our approach of virtual tumour classifica-
tion places more emphasis to the cells of the tumour
rather than its shape and texture. In the previous sec-
tion, we highlighted the influence of the removal of
certain cells in the tumour growth. We have shown
that the choice of cells to be irradiated had utmost im-
portance for effective and efficient radiotherapy.
Fair classification should give an insight of the na-
ture of any tumour without repeating every time the
same identification processes, so well that it may al-
low to determine more quickly therapies to apply. To
classify a tumour, we simulate successively the irradi-
ation of each of its cells and observe its evolution. De-
pending on the results of these simulations, we know
what are the dominant cell types in the tumour, which
allows us to classify it in one of the six categories we
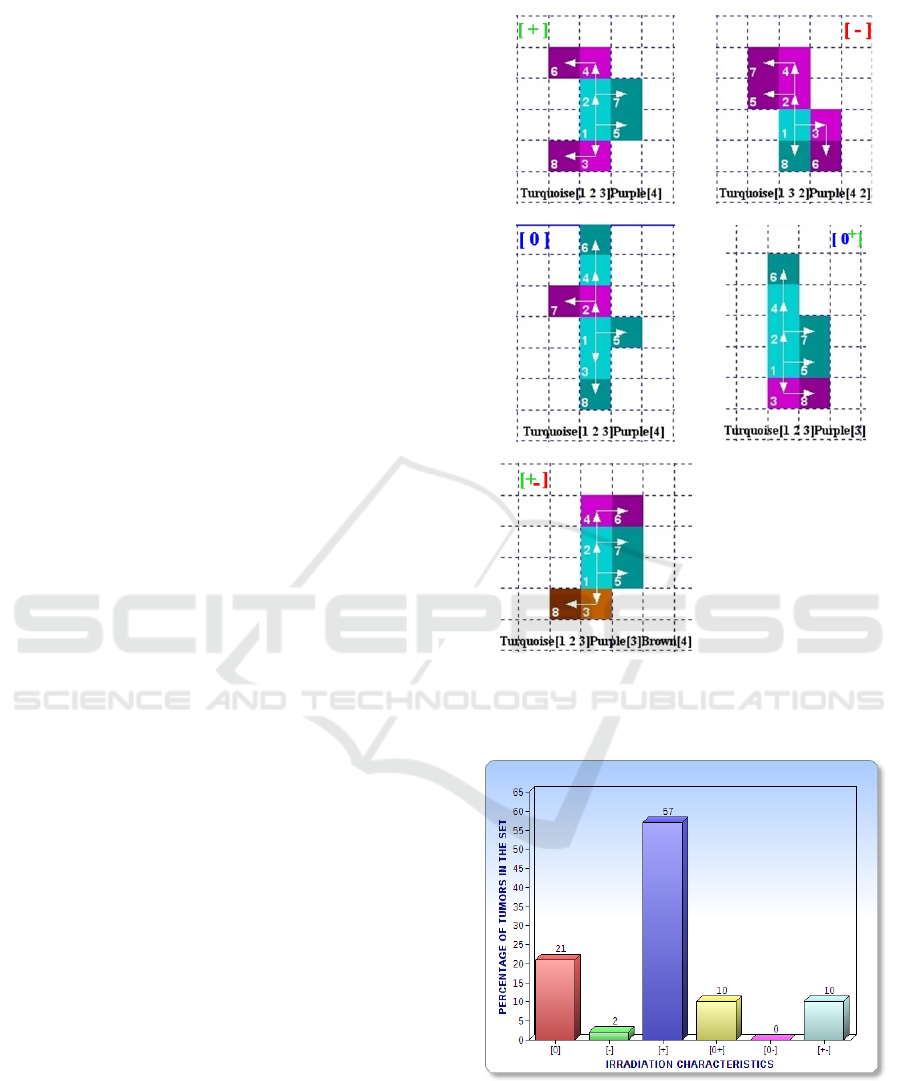
define in table 1.
The category of the tumour depends on the main
response we can expect from its irradiation which :
1. does not influence, neither in good, nor in bad way
the growth of the tumour
2. accelerates tumour growth
3. stunts the growth of the tumour
4. stunts the growth of the tumour or at least main-
tains it to its normal pace
5. accelerates tumour growth or at best maintains it
to its normal pace
6. can either accelerate or stunt the growth of the tu-
mour
We have in figure 4 an example of classification.
We also implement an algorithm such as for a
given set of tumours, it classifies each tumour in a
category and then gives the resulting statistical dis-
tribution. Assuming that the set to process is the all
possible phenotypes after 3 division cycles of a single
cell, the distribution is depicted in figure 5.
6 DISCUSSIONS AND
CONCLUSIONS
We formalize in a mathematical model some generic
features of cell division. Then using a cellular au-
tomaton whose rules capture the principles of that
model, we propose a prediction method for tissue evo-
lution. The interesting shapes predicted contribute to
establish the reliability of our approach of morpho-
genesis. We applied this prediction method to deduce
the latter states of a pathological tissue, given one of
its previous states. Then, we highlight the importance
of selecting suitable beams and energy intensities to
Figure 4: Example of 5 tissues classified each in a different
tumour category. In figure 5, we show the entire distribution
of the set of 8-cells tumours in the six categories.
Figure 5: Distribution of the 61 8-cells tissues per tumour
category. The cell division cycle for assessing the growth
of the tissue after irradiation is set to 10. We can notice that
there is no [0-] tumour in the studied set.
fit properly the tumour size and shape in radiother-
apy. However, we claim that it would be more inter-
esting to find the most cost-effective scheme in terms
BIOINFORMATICS 2016 - 7th International Conference on Bioinformatics Models, Methods and Algorithms
294

Table 1: The different categories of tumours and their description.
Category Notation
Unproductive
1
Zero : [0]
Dangerous
2
Negative [-]
Effective
3
Positive [+]
At Worst Unproductive
4
Zero/Positive : [0+]
At Best Unproductive
5
Zero/Negative : [0-]
Effective at Best and Dangerous at Worst
6
Positive/Negative : [+-]
of cells to irradiate so as to ensure a slow growth of the
tumour after shrinkage. If such method is taken into
account by decision support tools for cancer therapy,
it would more safeguard the healthy cells because the
whole tumour will not be blindly irradiated. Indeed,
it ensures that radiation is directed on specific cells
within the tumour, relevant to be destroyed due to the
fact that they are not or weakly linked to the aggres-
sive cancer cells. For this purpose, the algorithm we
implement does not randomly remove multiple cells
in one fell swoop, as it could be simple to do, but it
chooses each cell and determine its role in the growth
of the tumour. Then, we found that it was more rel-
evant to classify tumours according to their potential
response to radiotherapy rather than to their shape and
texture. Thereby, based on the growth we expected
after radiotherapy, we were able to classify a tumour
among six defined categories. We acknowledge that
in silico experiments remain far from clinical applica-
tions but they allow to test and produce new assump-
tions in order to better understand the livings and con-
trol the disturbances they face. Hence, although the
computational experiments we conducted in this pa-
per remain up to now theoretical, they provide new
avenues of research in the field of cancer therapy to
be more effective. If such decision making methods
and tools are validated and implemented, we are con-
vinced that inadvertent use of imagery prior to treat-
ment and some therapy drawbacks could be avoided.
In future works, we aim to take into account the cel-
lular neighbouring exchange in addition to the direc-
tions of division instructions. Indeed, due to what is
called the tumour microenvironment, results obtained
in vitro on the isolated cancer cells may dramatically
differ from the observed behaviours of the tumour un-
der in vivo radiation (Thompson and Maity, 2014).
These discrepancies are induced by a complex con-
stellation of extracellular and intracellular factors on
the tumour. They are yet to be understood for fair in
vitro experiments and even more so to be taken into
account in in silico simulations. Besides the role and
clinical implications of tumour microenvironment, it
is also hard to predict in an accurate way, for a same
cancer shape or type, the responsiveness of the radia-
tion from a patient to another one. Depending on the
degree of the individual susceptibility variation, the
predicted results may be more or less far from the ob-
served results, except predictive tests related to some
clinical researches on blood lymphocyte.
REFERENCES
Ehrgott, M. and Winz, I. (2008). Interactive decision sup-
port in radiation therapy treatment planning. OR Spec-
trum, 30(2):311–329.
Henzen, D. et al. (2014). Forward treatment planning
for modulated electron radiotherapy (mert) employing
monte carlo methods. Medical Physics, 41(3):–.
Ng, S. L. and Bischof, W. F. (1992). Automated detection
and classification of breast tumors. Computers and
Biomedical Research, 25(3):218 – 237.
Rangayyan, R. et al. (1997). Measures of acutance and
shape for classification of breast tumors. Medical
Imaging, IEEE Transactions on, 16(6):799–810.
Sarr, A., Fronville, A., and Rodin, V. (2014). Morpho-
genesis model for systematic simulation of forms co-
evolution with constraints : application to mitosis. In
TPNC 2014, 3rd International Conference on the The-
ory and Practice of Natural Computing, volume 8890,
pages 230–241. Springer.
Suh, Y. and Lee, S.-J. (2015). Radiation treatment and
cancer stem cells. Archives of Pharmacal Research,
38(3):408–413.
Thompson, R. and Maity, A. (2014). Radiotherapy and
the tumor microenvironment: Mutual influence and
clinical implications. In Koumenis, C., Hammond,
E., and Giaccia, A., editors, Tumor Microenviron-
ment and Cellular Stress, volume 772 of Advances in
Experimental Medicine and Biology, pages 147–165.
Springer New York.
Directional Cellular Dynamics for Tissue Morphogenesis and Tumour Characterization by Aggressive Cancer Cells Identification
295
