
Prediction for Disease Risk and Medical Cost using Time Series
Healthcare Data
Masatoshi Nagata, Kazunori Matsumoto and Masayuki Hashimoto
KDDI R&D Labs, Saitama, Japan
Keywords: Sequential Latent Dirichlet Allocation, LDA, Sequential LDA, Lifestyle-related Disease, Medical Cost.
Abstract: Foreseeing the medical expenditure is beneficial for both insurance companies and individuals. In this paper
we propose a new methodology to predict disease risk and medical cost. Based on sequential latent dirichlet
allocation (SeqLDA), which classifies hierarchical sequential data into segments of topics, we tried to
predict the number of people with diseases and the one-year cost of lifestyle-related diseases. Using the
health checkup information and medical claims of 6500 people for three years, we achieved that prediction
error was less than conventional LDA, and for accuracy rate, AUC was more than 0.71. The results suggest
that the SeqLDA method serve to predict the number of people with diseases and the related medical costs
using time series healthcare data.
1 INTRODUCTION
The increasing incidence of lifestyle-related diseases
and non-communicable diseases has become a major
issue in many regions (WHO, 2009; Lim et al.,
2012). In Japan, medical expenditures are increasing
dramatically, and exceeded 4 trillion yen in 2013.
Moreover, lifestyle-related diseases now account for
one-third of all medical expenditures (Ministry of
Health, Labour and Welfare, 2011). Predictiion for
such diseases and the related medical costs would
provide valuable information for healthcare
enterprises and administration policymakers.
Several studies have attempted to predict medical
costs based on medical claims (receipts). Many of
the studies achieved accurate results by means of
general regression and cox regression calculations
based on an analysis of billing claims (Brandle et al.,
2003; Zhao et al., 2005; Bertsimas et al., 2008).
However most research was focused on people with
a disease and did not includ healthy people.
Practically, health insurance association or
municipalities incur medical expenditures for
patients who sought medical care even the person
had been healthy in previous years. For this reason,
it would be more desirable predicting medical
expenditure from a certain population including
healthy people.
When and how much medical cost occurs will be
depend on patients’ health status. So if it were
possible to estimate and classify patients’ health
state, we could predict disease risks and medical
costs. A previous study using latent dirichlet
allocation (LDA), which is a topic model where
machine-learning techniques are used for natural
language processing, showed that it is possible to
predict disease risk with data on medical checkups
and claims (Kashima et al., 2013; Ogawa et al.,
2014). However, the data was not processed as time
series data, and it could be refined for the purpose of
practical use.
In this paper we aimed to evaluate whether
adding information of time series of healthcare data
to LDA improve prediction performance for disease
risk and medical cost. Therefore we applied
sequential LDA, which has been developed for
handling sequential data as segments of topics to
healthcare data (Teh et al., 2006; Lan Du et al.,
2010; Lan Du et al., 2012). SeqLDA gives a
sequential topic distribution for a particular period.
For healthcare data, the current health status of a
person may relate to past data, so SeqLDA would be
a better method for predicting the risk of diseases.
We present the preliminary results of predicting the
risks and medical costs of lifestyle-related diseases
using health checkups and claims for three years.
Nagata, M., Matsumoto, K. and Hashimoto, M.
Prediction for Disease Risk and Medical Cost using Time Series Healthcare Data.
DOI: 10.5220/0005827405170522
In Proceedings of the 9th International Joint Conference on Biomedical Engineering Systems and Technologies (BIOSTEC 2016) - Volume 5: HEALTHINF, pages 517-522
ISBN: 978-989-758-170-0
Copyright
c
2016 by SCITEPRESS – Science and Technology Publications, Lda. All rights reserved
517
2 BACKGROUND AND METHOD
2.1 Medical Claims and Health
Checkup Data
Medical claims are invoices for medical
compensation that claim costs from the insurer
(municipalities and health insurance associations).
Such claims include the disease name, administered
drug name and medical expenses in one month. Each
person’s annual cost is calculated from the billing
number when the disease name is related to lifestyle-
related diseases. The types of lifestyle-related
diseases were taken from a list defined by the
Ministry of Health, Labour and Welfare of Japan
(Mizushima Research Team of the Ministry of
Health, Labour and Welfare, 2007) and include
diabetes mellitus, hypertension, and dyslipidaemia.
For the prevention of lifestyle-related diseases in
Japan, the target is for everyone over 40 years old to
receive a medical examination once a year. We
analyzed health checkup data from 6518 people
from 40 to 59 years of age over a period of 4 years.
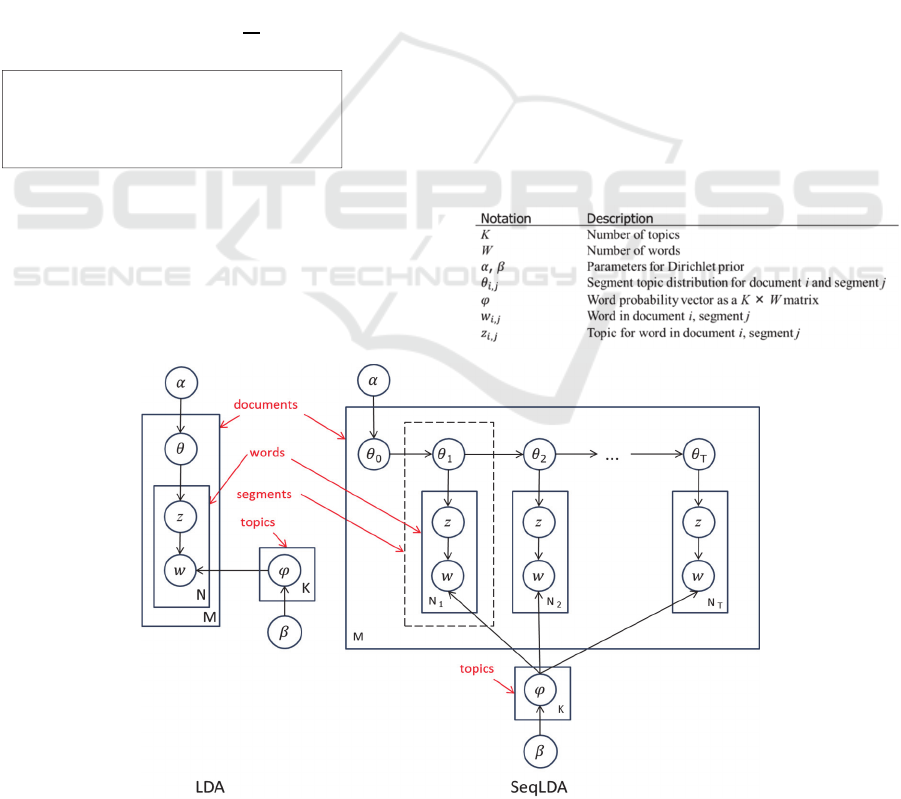
2.2 LDA
LDA is a probabilistic topic model for natural
language processing. In the topic models, one
document is represented as a mixture of a several
topics (Blei et al., 2003; Griffiths et al., 2004). The
model offers the possibility of classifying a
document with high accuracy compared to the mixed
multinomial distribution with a document
represented by a single topic. Figure 1 shows a
graphical representation of LDA and SeqLDA. LDA
is applied to a wide variety of data mining fields
such as information retrieval, voice recognition,
visibility, and image recognition and has been
suggested as effective in the analysis of health care
data.
2.3 Sequential LDA
In the topic models, a document is regarded as a
mixture of latent topics, and each latent topic is a
distribution over words in vocabulary. So far, many
extensions of topic models have been developed.
SeqLDA models document structures, and gives
mixtures of topics to both documents and segments.
Table 1: List of Notations.
Figure 1: Representation of an LDA model and a SeqLDA model.
Foreachbilling:
•
:Life‐stylerelateddiseasecount
•
:Alldiseasecount
•
:Costofthebill
HEALTHINF 2016 - 9th International Conference on Health Informatics
518
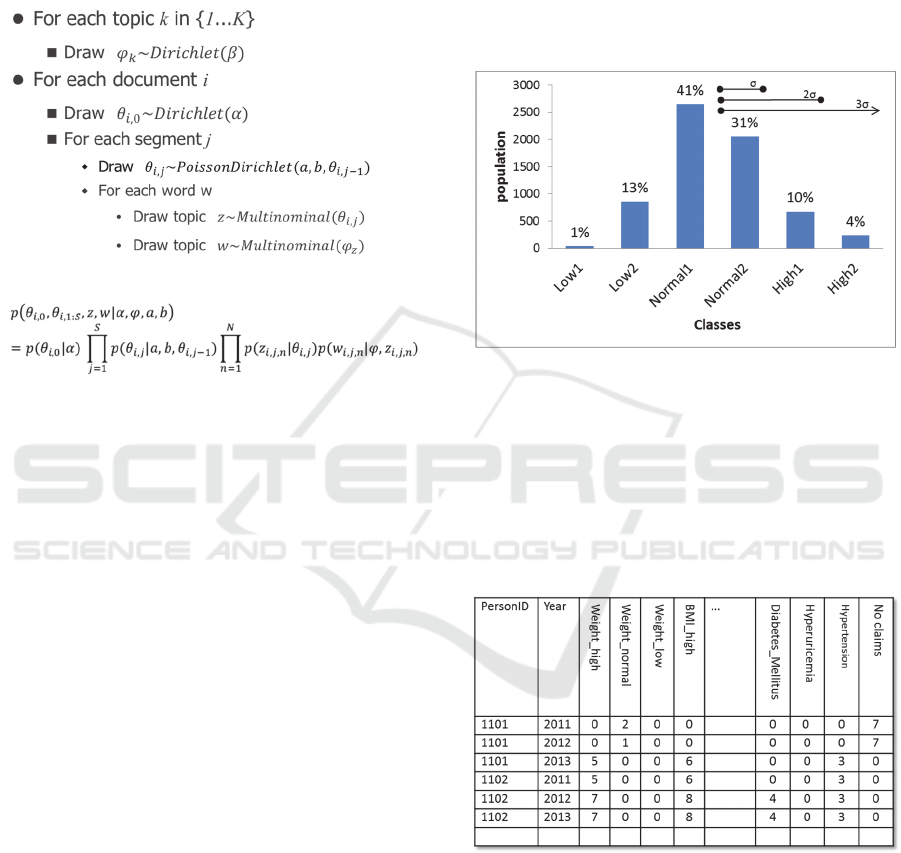
According to Lan Du et al., (2012), the joint
distribution of all observed and latent variables can
be constructed directly from Figure 1 using the
distribution given in the generative process as
below:
■Generativeprocess
■Jointdistribution
where
,
,,
,
isgivenbyPoisson
Dirichletprocess,,
,
.
The model is suitable for understanding the
sequence of the subject structure because it can
represent a chapter, section, and paragraphs in the
document. We assumed a topic distribution of a year
determined by checkup data that depended on the
previous year’s topic distribution, and then
calculated the topic distribution for a year based on
both the word distribution for the current year and
the topic distribution for previous years.
2.4 Feature Extraction
In the experiment, the model used a data set of
medical checkups from 2011 to 2013, and checkup
and medical cost data of 2014 were used to evaluate
the model. Health checkup data were summarized
for persons in each year. To transform the
measurement data into a mixture of frequency of
words, we used the entropy of information theory.
This classification was performed by
standardizing each value and dividing the checkup
data into three kinds of six classes based on the
standard deviation (σ). The entropy was calculated
from stochastic distributions (Figure 2). For
example, if class Low 2 has a 13% stochastic
distribution for BMI, it gives 3 bits according to
information theory, and thus assigning 3 words for
low BMI. Claim data were also transformed into
entropy based on probability of each person with a
disease out of the sum of all persons with the disease
for one year. Each person as a document, data for a
person in one year as a segment, and information on
individuals are considered words. We considered
“No claims” if a person has no record of claims.
Table 2 shows that the numbers in these columns
show how many times these words appear in each
segment.
Figure 2: Representation of assigning words by
transforming checkup data.
We used data on 6518 people as documents, 4
segments for each document, and 2 to 50 topics for
calculation. The parameters were a=020, b=10,
=0.10, and =0.01.
Table 2: Example of datasets describes information of one
person in one year.
2.5 Regression and Prediction
The topic distribution was obtained by SeqLDA. We
used data from 2011 to 2013 as training and test data
divided into 4:1. As dependent variables, the number
of times and the medical costs of people with
lifestyle-related diseases in 2014 by counting bills
were calculated for a multiple regression analysis.
For these two variables, we used two models as
Prediction for Disease Risk and Medical Cost using Time Series Healthcare Data
519
number of times and medical costs. We used R
software for analysis.
To determine the optimum topic number, we
calculated the R-squared coefficient, AIC, and BIC
using all topics by increasing the topic numbers
from 2 to 50. Next, we evaluated the models by
calculating the effect of each topic for objective
variable in each type model. In this process, we
removed some topics that contributed little to the
models based on AIC.
A threshold t was determined to evaluate models
for predicting the risk and medical cost of lifestyle-
related diseases. We used this threshold to judge the
disease risk when the predicted risk value >= t. For
evaluation to prediction, we used AUC of positive-
rate (sensitivity) and negative rate (1-specificity),
which is the area under the ROC curve (DeLong et
al., 1988).
3 RESULTS AND DISCUSSION
3.1 Analysis and Prediction
To determine the optimum topic number by using
outputs of both SeqLDA and LDA, we calculated
the R-squared coefficient and AIC. As a result, we
found the optimum topic numbers from 20 to 30 and
did regression experiments.
Multiple regressions analysis was done with data set
of 5214 people. Topic distributions for 3 years of
data (2011 to 2013) were calculated by both
SeqLDA and LDA. The topic distribution for the last
year (2013) was used as independent variables, and
two kinds of dependent variables were used: the
number of times that people acquired lifestyle-
related diseases in 2014 by counting bills, and
medical costs for lifestyle-related disease treatments.
As a result of multiple regression analysis, the R-
squared coefficients by SeqLDA and LDA were
0.50 and 0.46 at the best of topic number,
respectively, for the number of diseases model, 0.30
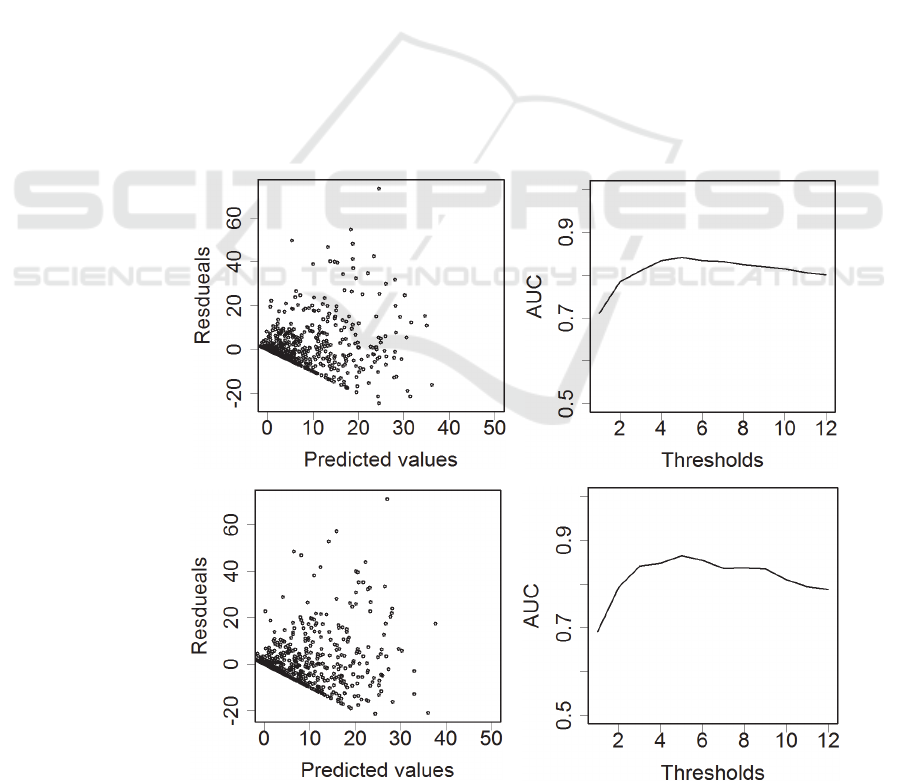
and 0.29 for the medical cost model. The residuals
between actual data and predicted values for the
number of diseases model are shown in Figure 3.
The mean squared error of residuals vs predicted
values by SeqLDA and LDA are 7.31 and 7.58.
However these differences were not statistically
significant when changing topic numbers from 20 to
30.
Figure 3: Residuals vs predicted values (left) and AUC when a threshold is set (right). SeqLDA, upper, LDA, lower.
SeqLDA
LDA
HEALTHINF 2016 - 9th International Conference on Health Informatics
520
Next, we tried to predict the risk of lifestyle-
related diseases by classification evaluation using
risk value threshold t. The AUC of the receiver-
operator characteristic curve by SeqLDA and LDA
were 0.84 and 0.85 by the model of diseases when t
= 4(Figure 3, right). AUC of using SeqLDA was
more stable than that of LDA. The results of using
the medical cost model were similar.
These results suggest that SeqLDA was a
relatively good predictor of the risk of lifestyle-
related diseases as well as conventional LDA.
According to the theory of the SeqLDA, the
accuracy of prediction should be better than LDA.
Accuracy may be improved by using more periods
of data sets because SeqLDA has more parameters
for calculating θ than LDA. The model showed that
predicting the number of times was more predictable
than medical cost, which is because billing costs
varied widely among the patients. Furthermore, our
method for calculating the annual cost for patients
was not exactly correct because it was difficult to
estimate it from a claim which has several diseases
names.
3.2 Feature Analysis of Topics
To confirm whether topics had the capability of
classifying lifestyle-related diseases in people, we
performed PCA analysis. The phi matrix of topic
number 21 in SeqLDA and 22 in LDA was used for
analysis.
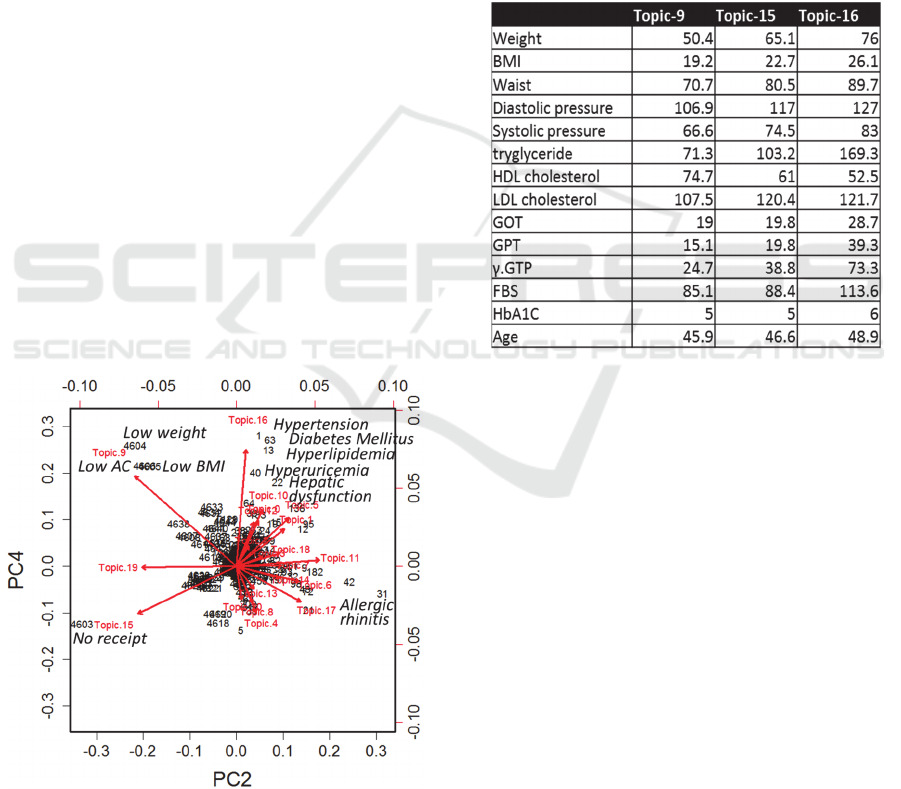
Figure 4: Biplot of PCA analysis.
Figure 4 shows biplot of the PCA analysis of
SeqLDA. The axis is the second principal
component (PC2) and the fourth principal
component (PC4), and the proportion of variance is
0.098 and 0.072, respectively. These components
seem to describe lifestyle-related diseases, and topic
16 may have such words. We then analyzed the
topic-word distribution with the φ matrix. Indeed,
Topic 16 had words for lifestyle-related diseases and
people with the high probability for this topic had
abnormal values for checkup data (Table 3). A
similar result was seen in the case of LDA. These
results support our classification and prediction for
lifestyle-related diseases.
Table 3: Averaged medical checkup data for persons in
each topic.
4 CONCLUSIONS
We proposed a new method using SeqLDA for
predicting the risk of lifestyle-related diseases.
Using SeqLDA with health checkup and medical
cost data for one year as a segment of documents,
we made models for predicting lifestyle-related
diseases. The model showed that predicting the
number of times was more predictable than medical
cost. And it was possible to predict risk. We also
compared the conventional LDA method using the
same dataset, and the model with SeqLDA is as
good as the one with LDA. Thus, SeqLDA with
healthcare data has a strong potential to predict the
risk of diseases.
REFERENCES
Bertsimas D, Bjarnadottir MV, Kane MA, Kryder JC,
Pandey R, Vempala S, and Wang G, (2008).
Prediction for Disease Risk and Medical Cost using Time Series Healthcare Data
521

Algorithmic prediction of health-care costs. Oper.
Res., vol. 56, 1382 -1392.
Blei DM, Ng AY and Jordan MI, (2003). Latent Dirichlet
Allocation. Journal of Machine Learning Research,
3:993-1022.
Brandle M, Zhou H, Smith BR, Marriott D, Burke R,
Tabaei BP, Brown MB, Herman WH, (2003). The
Direct Medical Cost of Type 2 Diabetes. Diabetes
Care. 26(8):2300-4.
DeLong ER, DeLong DM, Clarke-Pearson DL, (1988).
Comparing the Areas under Two or More Correlated
Receiver Operating Characteristic Curves: A
Nonparametric Approach, Biometrics. 44(3):837-45.
Griffiths TL and Steyvers M, (2004). Finding scientific
topics, pnas, 101:5228-5235.
Kashima S, Inoue K, Matsumoto M, Akimoto K, (2013).
Do Non-Glycaemic Markers Add Value to Plasma
Glucose and Hemoglobin A1c in Predicting Diabetes?
Yuport Health Checkup Center Study. PLoS One.
20;8(6).
Mizushima Research Team of the Ministry of Health,
Labour and Welfare, (2007). Report of Lifestyle-
Related Disease Administration Using Medical
Checkup and Billing Data.
Lan Du, Wray Buntine, and Huidong Jin, (2010).
Sequential Latent Dirichlet Allocation: Discover
Underlying Topic Structures within a Document. IEEE
Computer Society, 148-157.
Lan Du, Wray Buntine, Huidong Jin, Changyou Chen,
(2012). Sequential latent Dirichlet allocation.
Knowledge and Information Systems. vol. 31, 3, 475-
503.
Lim SS, Vos T, Flaxman AD, Danaei G, Shibuya K,
Adair-Rohani H, et al. (2012). A comparative risk
assessment of burden of disease and injury attributable
to 67 risk factors and risk factor clusters in 21 regions,
1990–2010: a systematic analysis for the Global
Burden of Disease Study 2010. Lancet.
380(9859):2224–2260.
Ogawa K, Matsumoto K, Hashimoto M, and Nagatomi R,
(2015). Method of Screening the Health of Persons
with High Risk for Potential Lifestyle-related Diseases
using LDA - Toward a Better Screening Method for
Persons with High Health Risks. SciTePress, 502-507.
Teh YW, Jordan MI, and Beal MJ, (2006). Hierarchical
Dirichlet Processes, Journal of the American
Statistical Association, vol.01 476, 1566-1581.
WHO. (2009). Global health risks: morality and burden of
disease attributable to selected major risks. World
Health Organization, Geneva.
Zhao Y, Ash AS, Ellis RP, Ayanian JZ, Pope GC, Bowen
B, Weyuker L, (2005). Predicting Pharmacy Costs and
Other Medical Costs Using Diagnoses and Drug
Claims, Med Care. 43(1):34-43.
HEALTHINF 2016 - 9th International Conference on Health Informatics
522
