
Urban Crime Mitigation
A Model to Derive Criminal Patterns and Determine Defender Placement to
Reduce Opportunistic Crime
Solomon Y. Sonya, Luke Brantley and Meagan Whitaker
Departments of Computer Science and Operations Research, U.S.A. Air Force Academy, 2534 Fairchild Drive, U.S.A.F
Academy, Colorado, 80840, U.S.A.
Keywords: Opportunistic Crime, Statistical Analysis, Frequency Distribution, Pattern Recognition.
Abstract: Urban opportunistic crime is a problem throughout the world causing financial, physical, and emotional
damages to innocent citizens and organizations. Opportunistic crimes require minimal reconnaissance and
preparation in order to conduct an attack (e.g., burglary, robbery, vandalism, and assault). Opportunistic
criminals are more spontaneous in nature making their actions difficult to anticipate and create an approach
to reduce these crimes. Statistical analysis of crimes may reveal distinct patterns from which a strategy can
be created to better mitigate future crimes. This paper describes analysis performed on real-world campus
crime data in which distinct correlations were discovered to determine the significant factors that motivate
opportunistic crime. This research concludes by developing a dynamic defender placement strategy that
adapts over time to reduce the utility of opportunistic crimes. The research contribution allows for the
determination of significant factors motivating opportunistic crime and releases a program that maps crime
occurrences over time, determines the minimum defender allocation for a given area, and dynamically
specifies defender placement strategy to mitigate future crime. The novelty of this approach allows for
application to other campuses, shopping complexes, and living districts to form conclusions about
opportunistic criminal activity and formulate an approach to abate such crimes.
1 INTRODUCTION
Opportunistic crime is a serious problem affecting
urban areas. As opposed to well-planned and
coordinated attacks (e.g. terrorist attacks or gang
influenced violence), opportunistic crimes are rather
spontaneous in nature and involve very little
premeditation enabling the criminal to execute an
attack based on the opportunities present at a given
time. For instance, you may have heard of stories
where a person momentarily leaves their phone,
wallet, or purse unattended, walks away to
accomplish a task only to return and discover that
their personal items have been stolen within minutes
of stepping away from the area. This would be an
example of an opportunistic crime in which a
criminal carries out an attack based on maximizing
their utility over the defender’s protection strategy.
A defender is a police officer or crime abatement
personnel whose presence and action is used to
reduce crime. The utility for an opportunistic crime
is defined as the motivation and expected outcome
of a criminal succeeding with the attack without
being apprehended in response to the defender’s
strategy (Chao et al, 2015), (Yildiz, 2002), (Osborne
and Rubinstein, 1994). Other types of opportunistic
crimes include burglary, robbery, grand theft auto,
trespassing, assault, and vandalism. In all, these
crimes are quite costly and produce damaging
effects on the population.
Attractiveness is used to measure the influences
of opportunistic crime around a specified area. A
region that exhibits more opportunistic crime than
another region is said to be more attractive to
opportunistic criminals. However, it is necessary to
bind several research questions around this concept
in order to better scope how to determine the at-
tractiveness of area. For instance, how is a
criminal’s utility impacted by the attractiveness of
an area and does this attractiveness remain static or
change over time? How can external influences
(e.g., holidays, special events, football, basketball,
soccer games, and campus parties) influence the
attractiveness of an area? Finally, if we can
218
Sonya, S., Brantley, L. and Whitaker, M.
Urban Crime Mitigation - A Model to Derive Criminal Patterns and Determine Defender Placement to Reduce Opportunistic Crime.
DOI: 10.5220/0005827302180224
In Proceedings of 5th the International Conference on Operations Research and Enterprise Systems (ICORES 2016), pages 218-224
ISBN: 978-989-758-171-7
Copyright
c
2016 by SCITEPRESS – Science and Technology Publications, Lda. All rights reserved

determine the significant factors that affect
attractiveness of opportunistic crime, is it possible to
deploy a better defender allocation strategy to
mitigate these crimes and if so, how and when
should we update this strategy? The goals of this
research are to study this concept in further detail.
Currently, University XYZ manually assigns the
defender placement and patrol strategy to cover the
campus in hopes of deterring crime. This approach
has proven to be quite time consuming and
ineffective at mitigating crime (Chao, Sinha, Tambe
2015). NOTE: the true name of the university is
masked to protect the identity of the school. In this
research, we devised an approach to analyze the
university crime data to create an appropriate model
that learns the significant factors affecting
opportunistic crime over time. This allows us the
ability to describe the underlying data and formulate
a dynamic assignment strategy to better reduce
crime.
The end result of this analysis reveals the
motivating factors that contributed to the
attractiveness for a criminal to commit an
opportunistic crime. Based on these factors, we are
able to calculate the placement of a visible defender
to deter future crime. This same approach can be
adapted to additional areas exhibiting opportunistic
crime such that motivating factors can be discovered
and a better patrol strategy devised to reduce crime.
2 BACKGROUND AND RELATED
WORK
The idea to examine opportunistic crime originated
from the Department of Homeland Security funded
CREATE (Center for Risk and Economic Analysis
of Terrorism Events) group, based at the University
of Southern California (USC). A new framework to
create a patrol allocation schedule around adaptive
opportunistic criminals was introduced in “Keeping
pace with criminals: Designing patrol allocation
against adaptive opportunistic criminal” by Chao
Zhang et al. In this research, Chao Zhang et al
applied game theoretic approaches on real-world
campus crime data to map the interaction between
patrol officers in moving vehicles and criminal
activity. This behavior was mapped as parameters in
the Dynamic Bayesian Network (DBN) in order to
learn the appropriate model and account for hidden
states which included the true number of criminals
and patrol officers present in the area and the impact
their presence may have on each other.
In addition to mobile police patrols around the
campus, University XYZ also employs visible, well-
identified campus security guards who remain
relatively stationary to an assigned grid location.
This research applies pattern recognition and
statistical analysis for the assignment of these
visible, pedestrious defenders whose presence at the
appropriate location is used to deter crime via
classical conditioning.
Classical conditioning is a model of learning that
deals with the automatic, instinctual response of a
person in response to apparent stimuli (Hall, 1998).
Classical conditioning is applied to this research to
hypothesize appropriate response of a criminal’s
actions as a result of a visible defender present
within an area.
The Cheater Model further helps to refine the
hypothesized relationship between defenders and
crimes. According to this economic theory, many
people may allow themselves to cheat or conduct
some form of unscrupulous activity when the
marginal utility to do so is greater than the marginal
costs and consequence of the activity (Nagin, 2002).
An experiment was held with varying levels of
monitoring over employees known to inflate the
truth about their self-reported performance. The
study showed that as perceived monitoring
decreased, cheating increased.
Additional research determined that criminals
react inversely to the number of defenders present at
a location. In “Crime and Human Nature: The
Definitive Study of the Causes of Crime,”
researchers Wilson and Herrnstein confirmed that
the defender/criminal relationship is determined by
classical conditioning. We use this knowledge along
with the Rational Cheater Model to assert that an
increase in defender presence should decrease crime
in an area. The locations of these defenders
however, will be crucial in having an impact to the
expected crime level. The following sections state
how analysis of crime data can indicate the location
at which to place a visible defender to mitigate
opportunistic crime.
3 RESEARCH HYPOTHESIS
Attractiveness of opportunistic crime may be
dependent on time, population, and the number of
defenders present during an incident. The
proportionality of crime discovered should reflect
the proportionality of defenders assigned to an area
Studying this interaction helps to predict the
likelihood of future crimes and efficiently assign
Urban Crime Mitigation - A Model to Derive Criminal Patterns and Determine Defender Placement to Reduce Opportunistic Crime
219

defenders to the appropriate areas of highest
attractiveness.
The following research questions help direct the
study of our hypothesis:
1. What effects (if any) do the following factors
have on the attractiveness of opportunistic crime:
Time of Day: i.e., how does the time of day
affect the prevalence of crime?
Day of Week: i.e., which days are more
likely to experience a proportionally higher
number of crime?
Week of Year: i.e., is it possible to determine
which weeks of the year experience a higher
percentage of crime?
Special Events: i.e., is it possible to
determine how special events (e.g.
football/basketball games, holidays, and
campus parties) influence crime?
Physical Location: i.e., is crime uniformly
distributed across the campus area or which
areas have a greater propensity for
opportunistic crime?
2. In an area that exhibits attractiveness for
opportunistic crime, what is the minimum
number of defenders required to cover an area,
and where should we assign these defenders?
3. Given a defender assignment strategy, when
should we update the patrol allocation in order to
maintain the best utility for defenders to deter
crime?
4 METHODOLOGY
The methodology in this research is divided in two
sections: Data Analysis and Patrol Schedule
Assignment. The Data Analysis section determines
the significant factors affecting opportunistic crime
and displays crime patterns learned from the data
set. The Patrol Schedule Assignment section creates
the estimator of when and where crime may occur
and applies significant aspects of crime learned over
time to produce the dynamic assignment of
defenders to the areas exhibiting the highest
likelihood for a repeatable crime.
5 EXPERIMENT SETUP
University XYZ supplied an archive containing
three years of crime data between 2011-2013 and a
map of the university dividing the campus area into
five police patrol zones. Figure 1 depicts a very
short description of crime data received by the
university. Certain attributes regarding the analyzed
data are masked to protect the identities and
locations and individuals involved in the incidents.
Figure 1: Crime Data Subset.
The data set from the university included crimes
classified into 50 different categories of crimes. We
combined these classifications and reduced our
analysis to focus primarily on crimes relating to
Theft, Destruction of Property, and Assault
categories as these are the main types of
opportunistic crimes studied in this research. Figure
2 depicts a breakdown of this chart. Figure 3 depicts
the campus response area protected by the police
patrols. Zone A encompasses the majority of
university classrooms and laboratories. Zone B
encompasses the recreational areas including the
football and sports arenas. Zone D is the primary
location of on-campus housing. Zones C and E are
additional residential areas further away from main
campus.
Figure 2: Crime Description. Figure 3: Area Map.
6 EXPERIMENTATION AND
DATA ANALYSIS
We divide the research questions identified in
Chapter 3 into several experiments to form
appropriate conclusions regarding the underlying
data set.
ICORES 2016 - 5th International Conference on Operations Research and Enterprise Systems
220
6.1 Time of Day Experimentation
This experiment determines if the hour of the day is
significant when categorizing types of crime. We
hypothesize since human activity varies throughout
the day, crime may follow a similar trend. We
performed a frequency analysis across the data set
and graphed the results in Figure 4. This revealed
how time of the day influenced the prevalence of
crime.
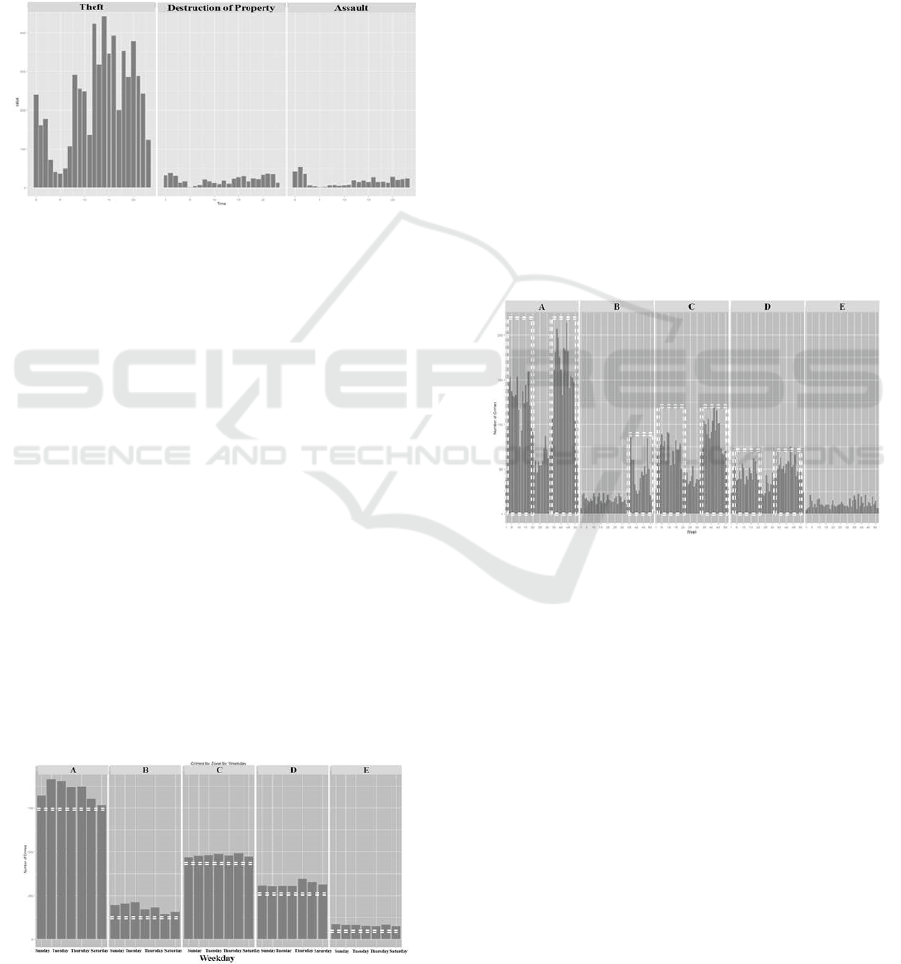
Figure 4: Crime Frequency Distribution by Hour.
Theft accounts for the highest occurrence of
crime within this data set mostly occurring between
1300 and 2000. The majority of destruction crimes
occur between 1900 and 0100. Finally, the majority
of assaults occur between 1900 and 0200. Overall,
we conclude the hour of the day has an effect on
crime and will remain a significant factor in our
analysis for determining the optimal defender
assignment strategy.
6.2 Time of Day Experimentation
This experiment determines how the day of the week
affects crime in various zones. We hypothesize that
if human activity varies based on the day of the
week (especially on weekends) then crime should
follow a similar trend. We isolated crimes reported
on each day of the week and further separated these
crimes into the respective zones reported for each
crime. Figure 5 depicts the frequency distribution of
crimes reported within each zone.
Figure 5: Frequency Distribution by Day of the Week.
In this experiment, we expected to see weekend
days display a greater statistical significance of
crimes than normal weekdays. However, this was
not the case from our data set. Zone A has the
highest concentration of crime. This is expected
because Zone A covers the majority of the university
area and campus buildings. With respect to each
zone however, crime remained relatively similar
across each day of the week. Since day of the week
was not observed to have a significant impact on the
number of crimes committed, this factor is excluded
from our analysis model.
6.3 Week of the Year Experimentation
Experiment 3 determines how the week of the year
may affect crime. Spring, summer, and winter
semesters are distinct times in which population
varies on a college campus. We hypothesize crime
patterns may follow the population throughout the
year. Figure 6 depicts the frequency distribution
created by separating crime occurrences by week of
the year divided into the five main patrol zones.
Figure 6: Frequency Distribution of Crimes by Week.
Crime trends within Zones A, C and D display
distinct trends pertaining to the spring, summer, and
fall semesters for the university. Considerably less
crime occurs during the summer weeks than during
the semesters for which most of the student body is
present for classes. Zone B exhibits a significant
spike in crime activity between weeks 36 through
48. Zone B contains the football coliseum. Upon
further investigation into the campus activity during
these weeks in Zone B, we discovered week 36 is
when home football games occur for the university.
In addition, many home games occur at the coliseum
during the fall semester. It is evident that crime
follows this trend as well. From this experiment, we
conclude the week of the year is a significant factor
affecting opportunistic crime.
Urban Crime Mitigation - A Model to Derive Criminal Patterns and Determine Defender Placement to Reduce Opportunistic Crime
221

6.4 Special Events Experimentation
In this experiment, we wish to determine the
relationship between crimes around dates of special
events to identify the specific events that account for
a higher percentage of campus crime. We
hypothesize if crime seems to follow population,
then crime should increase during special events,
however, it is unknown if the increase in crime is
uniform for every event or which special events
account for a higher rise in crime. We first analyze
the overall times when crimes occurred to give us an
idea of the average crime distribution by hour. This
is noted as “All Crime” in Figure 7. Next, we
combine the schedule of special events for baseball,
basketball, and football games, fall move-in period,
and homecoming week to produce the frequency
distribution depicted in Figure 7.
Figure 7: Crime Distribution Around Special Events.
When comparing the average number of crimes
on a normal day, we determined baseball games,
basketball games and fall move-in period do not
have a considerable effect on crime. The average
number of crimes for homecoming week and
football games are considerably higher than the
average number of crimes per hour. We conclude
from this experiment that certain special events are a
significant factor affecting opportunistic crime.
6.5 Crime Densities via Clustering I
Experiments 5 through 7 determine the locations
within zones when and where crimes densities peak.
We created a separate address to latitude/longitude
derivation process in order to convert the recorded
addresses into coordinates for plotting and
organization into distinct clusters. The cluster
movements are tracked over time in order to observe
their patterns and distinctions.
Experiment 5 determines the specific areas with
the highest overall densities of crimes. We
hypothesize crime is not uniform, but may be
concentrated around certain areas within the
university patrol area. Discovering the locations with
highest densities of crime helps to reduce the search
space and allow concentration of defender
allocations around areas exhibiting the greatest
clusters of crime. Experiment 5 uses the Partitioning
Around Medoids (PAM) algorithm to provide a
more precise clustering of crime densities. We
represented the lines of longitude across the X-Axis
and plotted the lines of latitude across the Y-Axis.
Figure 8 depicts the result from plotting the clusters
of crime.
Figure 8: PAM Clustering Crime Densities by Location.
Clustering has proven to help identify areas of
highest attractiveness and can reduce the focus area
to locations exhibiting highest densities of crime.
6.6 Crime Densities via Clustering II
The purpose of this experiment is to identify specific
addresses with the highest overall densities of crime.
We hypothesize crime may follow streets, thus,
analyzing occurrences by street should identify
densities of crime as well. The frequencies of crime
by street are measured, a ceiling and floor function
is used to calculate the centroid address around most
crimes on each street, and then the derived
coordinates of the centroid are mapped to produce
the crime densities as shown in Figure 9.
Figure 9: Clustering Crime Densities via Street Address.
We conclude mapping crime occurrences to
streets may be used to determine the areas of highest
ICORES 2016 - 5th International Conference on Operations Research and Enterprise Systems
222

attractiveness as well. We used two separate
approaches to plot the densities of crime. We used
the statistical programming environment, R, to
analyze the data and conduct the PAM clustering in
Experiment 5. We wrote a program to derive this
data and interface with Google Maps to allow the
observer the ability to view areas of highest
attractiveness along with additional parameters we
discovered during this analysis in Experiment 6. The
two separate approaches revealed the same
clustering which validated our methodology to map
criminal activity around clusters of repeated crime.
6.7 Crime Density Movement by Time
This experiment determines specific times and
addresses within each zone where crime densities
peak. We hypothesize mapping crimes to clusters
may determine areas of highest attractiveness such
that observing when crime clusters shift may
identify how to update the patrol strategy to follow
criminal behavior. Figure 10 is an overlay of
opportunistic crime observed using R and our
program to map the hour and location where crime
occurred.
Figure 10: Clustering Crime Densities Over Time.
Analysis of these clusters indicate a procedure to
map crime densities by time along street addresses
and notifies when to update the defender assignment
strategy based on the movement of crime clusters.
6.8 Data Analysis Conclusions
It is possible to determine how certain factors affect
attractiveness of opportunistic crime. The frequency
distributions and cluster analysis allowed us to make
several conclusions on how to learn details regarding
the data set. Time of day, week of year, special
events, and location are significant factors in
determining when and where crime occurs. Mapping
densities of crime as a function of time will help to
identify locations to place a defender and when to
adjust the visible defender assignment strategy.
7 DEFENDER ASSIGNMENT
This chapter incorporates the significant factors
identified in Chapter 6 to create the patrol schedule
to reduce opportunistic crimes. We require the
following information in order to make an efficient
defender assignment:
1. Proportionality of crime per street per hour
2. Acceptable crime threshold (defined by user)
3. Coverage area (CA) required for each street
4. Defender Presence Radius (DPR)
5. Defender Compression Factor (DCF)
The proportionality of crime per street for each
hour is calculated in Chapter 6. Our program
analyzes the number of incidents on every street for
each hour and normalizes this ratio across all
applicable crimes recorded to calculate this
proportionality. The user-defined threshold
represents the minimum percentage to view crimes
across the entire data series. For instance, data
analysis conducted in this research spans a few
square miles with years’ worth of recorded data. A
single crime incident within the entire data series is
statistically insignificant when making
generalizations regarding trends across the entire
population. Multiple crimes across several years
within the same area allow for a more accurate
generalization regarding likelihood of a future crime
within the same area. A larger threshold reveals a
larger prevalence of crime. Based on user specified
threshold (percentage), streets with applicable crime
events meeting the minimum threshold percentage
are populated for consideration in the defender
assignment function detailed below.
Coverage Area (CA) specifies the total length
(defined by crime occurrence clusters) required for
protection by defender(s). We used the haversign
formula to calculate the great-circle distance
between crime clusters on each street. This
identified how much space is required for protection
by a defender.
Defender Presence Radius (DPR) is the
effective distance established by a visible defender
to discourage crime (via classical conditioning). The
Defender Compression Factor (DCF) represents
the multiplicative effect additional defenders
assigned in the same coverage area have on the
DPR. For example, let the coverage area for a
particular street be 8000ft. Further, let the DPR be
800ft. A naïve defender assignment can be specified
as minimum_defender_count = CA / DPR. Thus, we
can ascertain 10 defenders are required to cover this
area. However, applying classical conditioning to
rational criminal behavior patterns, we postulate the
Urban Crime Mitigation - A Model to Derive Criminal Patterns and Determine Defender Placement to Reduce Opportunistic Crime
223

more defenders placed on a street should increase
the individual DPR such that a criminal successively
observing only a few defenders (say 5 or 6 defenders
along the same path) could conclude additional
defenders are likely nearby. The criminal would opt
to move away from this location. This results in
successfully reducing the criminal’s utility to attack
by using a reduced number of defenders.
Opportunistic criminals subconsciously observe
the DCF and DPR to calculate their utility in
succeeding with the attack. Future research will be
required to know how the coverage area expands as
a function of the number of defenders present. In
this research, we assigned the DCF to 1.8 and DPR
to 800ft. Taking the DCF into account, we can
calculate the minimum number of defenders (d)
required with respect to coverage area for each street
(s) meeting the user’s threshold to be:
min
s
(d) = DCA
s
/ (DPR *DCF)
The aggregation of the minimum defender count
per street given a specified threshold parameter
produces the minimum number of defenders
required to protect an area and more importantly,
specifies the location at which the defenders are
assigned. Figure 11 depicts a final output from our
program displaying the assignment of each defender
for each particular hour.
Figure 11: Minimum Defender Allocation.
8 CONCLUSIONS
Opportunistic crimes require minimal
reconnaissance and preparation in order to conduct
an attack. The damages of such attacks can be
extremely costly to the population. This research
presented a new approach to apply frequency
analysis coupled with density distributions to
determine the significant factors that affect the
attractiveness of opportunistic crime and produce a
methodology to mitigate these crimes. Based on the
data set analyzed in this research, time of day, week
of year, special events, and location are significant
factors in determining when and where crime
occurs. Placement of a visible defender can be
determined by the significant factors uncovered in
this research, proportionality of crime, crime
coverage area, defender presence radius, and the
defender compression factor. This research
introduced the methodology of using these factors to
allow for the generation of a defender placement
strategy aimed at maximizing a visible defender’s
utility to reduce opportunistic crime. The novelty of
this approach allows for application to other large
campuses and living districts to form conclusions
about opportunistic criminal behavior patterns and
formulate an approach to abate such crimes.
ACKNOWLEDGEMENTS
We sincerely thank Dr. Milind Tambe, Dr. Arunesh
Sinha, Chao Zhang, and Dr. Gisele Ragusa for your
very generous support and guidance during this
research project. Your help made this collaboration
successful.
All opinions expressed in this paper are the
authors’ and do not reflect the policies and views of
DHS, USC, or the US Government.
REFERENCES
Hall, R. Classical Conditioning, Psychology World, 1998.
https://web.mst.edu/~psyworld/general/cc/.
Nagin, Daniel, et al. Monitoring, motivation and
management: The determinants of opportunistic
behavior in a field experiment. In National Bureau of
Economic Research, No. w8811, 2002.
Osborne, Martin J., and Ariel Rubinstein. A course in
game theory. MIT press, 1994.
Yildiz, Muhamet. 14.12 Game Theory Lecture Notes,
14.12 Economic Applications of Game Theory,
Massachusetts Institute of Technology, 2002.
http://web.mit.edu/14.12/www/02F_lecture3-602.pdf.
Zhang, Chao, Arunesh Sinha, and Milind Tambe.
"Keeping pace with criminals: Designing patrol
allocation against adaptive opportunistic criminals." In
International Conference on Autonomous Agents and
Multiagent Systems. International Foundation for
Autonomous Agents and Multiagent Systems, 2015.
ICORES 2016 - 5th International Conference on Operations Research and Enterprise Systems
224
