
Structure Occupancy Curve Generation using Geospatially Enabled
Social Media Data
Samuel Toepke
Private Engineering Firm, Washington D.C., U.S.A.
Keywords: Population Estimation, Structure Occupancy Curve, Gis, Social Media, Geofencing, Enterprise
Architecture, Volunteered Geographic Data.
Abstract: Human-use statistics of an occupied building are critical for resource consumption planning,
emergency/crisis response, and long-term community design. Without an active access-control policy, it is
difficult to get an accurate measure of the spatiotemporal occupancy of a building during use hours. This
research presents a novel method of estimating building use patterns, based on freely available and
volunteered data from social media. Modern social media services such as Twitter and Instagram give users
the ability to create geospatially enabled posts, submitted using pervasive computing devices. By applying
geofencing to the pertinent social media data, an aggregate estimate of 24-hour use can be generated for a
structure. Using geospatial data from the aforementioned social media services, steps for gaining the
aggregate building occupation estimations are delineated, several high-traffic buildings are selected as use
cases, and results/follow-on work are discussed.
1 INTRODUCTION
Population distribution estimation continues to be a
critical problem, with areas of impact including
emergency response, crisis management, energy use
projection, and urban planning (Kubanek, 2014). A
subset of the population distribution problem
includes discerning the spatiotemporal population
inside of a single building during occupied hours.
This task is currently completed using several
methods, all require high installation/ongoing costs
and maintenance:
• Electronic access-control, which limits the use of
the structure to previously cleared users,
requiring the use of an identification card or
token.
• Staffed access-control, which requires a security
team and all the requisite training, administration
and scheduling.
• Measurement of consumables, such as Internet
IP addresses and/or power use.
• Networked acoustic and/or infrared sensors.
In modern society, smart phones and other Internet
connected devices have become pervasive; iPhones,
Androids and Blackberrys are carried by almost two
thirds of the American adult population (Smith,
2015) and are connected to the Internet through Wi-
Fi and/or wireless carriers. These devices generally
have GPS functionality, allowing the user to make
geospatially enabled posts on social media sites such
as Twitter and Instagram.
Twitter and Instagram expose a public
application programming interface (API) that allows
interested users to access posts using web services
and a compatible programming language. If these
posts have an associated location and the post
density is high enough, this information can be used
for population estimation (Aubrecht, 2011).
Geofencing is the practice of filtering the
geospatially enabled posts to a specified geographic
boundary (Namiot, 2013); if the boundary is the
perimeter of a structure, the resulting posts can
provide a useful basis for occupancy curve
estimation.
This investigation shows a use case of downtown
San Jose, CA. USA. with geospatially enabled
Tweets and Instagram posts feeding into occupancy
estimations. Several buildings of different size are
investigated; implementation notes are discussed,
and results are presented.
32
Toepke, S.
Structure Occupancy Curve Generation using Geospatially Enabled Social Media Data.
In Proceedings of the 2nd International Conference on Geographical Information Systems Theory, Applications and Management (GISTAM 2016), pages 32-38
ISBN: 978-989-758-188-5
Copyright
c
2016 by SCITEPRESS – Science and Technology Publications, Lda. All rights reserved

2 BACKGROUND
Research into population estimation is currently
moving forward in two complementary directions:
with data sourced from traditional methods, and with
information harvested from electronic sources.
The first approach uses a combination of
rigorously collected information to generate
estimations. LandScan USA (Bhaduri, 2007) is a
population estimation product produced by Oak
Ridge National Laboratory, USA. LandScan uses a
fusion of census data, administrative boundaries,
raster/vector data, and high resolution images to
generate a dasymetric map (Mennis, 2006) that has
an approximate resolution of 1 km^2 (Rose, 2014).
Urban Atlas, a similar product from the European
Commission, generates its population estimation
data from census tracts, horizontal soil sealing, land-
use/cover maps, commune boundaries, etc. (Batista e
Silva, 2013) Using data disaggregation and
weighting, polygon maps for specific areas are
created.
The second track occurs through the active
investigation of volunteered geographic information
from social media services such as Twitter,
Instagram, Facebook, Foursquare, Panaramio, etc.
The user generated content from these services
provides a wide variety of data inexpensively, that
can be queried programmatically, while leveraging
the idea of using humans as mobile sensors
(Aubrecht, 2011); (Laituri, 2008).
Recent work into mining of social media data
includes population estimation for the purpose of
emergency response (Toepke, 2015), modelling
population at risk in an active volcanic area (Freire,
2015), tracing the German centennial flood (Fuchs,
2013), and creating high resolution mapping of
special events (Sims, 2014).
On July 28, 2015, Google introduced a feature
named Popular Times (PT) in their search engine.
Instead of using publicly available social media
posts, location data from cooperating Android
devices was used to generate occupancy curves
(Popular Times, 2015). While the source data is not
publicly available for general research, and an end
user cannot currently view all structures, this is a
convenient way to generate/view occupancy curves.
The traditional model is based on broad and well
researched data; though it is slow to deploy, it has a
low spatiotemporal resolution and is expensive to
implement. The social media model has a rapid
turnaround, and can be very dense; but is only
tenable in populated areas that have a high level of
tech adoption, and a user base with a propensity to
generate posts. Ideally, the fusion of both methods
can provide a more flexible and inexpensive
population distribution model. E.g., the
weekday/daytime distribution found in this study
could contribute to more precise workplace zone
data (Martin, 2013).
Modern social media population estimations are
mainly focused in the emergency response and crisis
management arenas; but can also be applied in other
areas. Individual location data throughout a day is
critical to structure occupancy planning, and social
media can be of use. Currently, structure occupancy
curves can be obtained through simulations
(Richardson, 2008), direct sampling of building use
(Dong, 2009), and/or measuring of consumables e.g.
Internet/power/water. The methods are effective, but
can be expensive; requiring sensor suites, on-site
personnel, and access to building statistics. The
convenience of occupancy estimations from public
sources is also pertinent to interested third parties
e.g. an Internet service provider, who would have no
expectation of attaining this data through rote
channels.
3 ARCHITECTURE
The data used is gleaned from a previous
investigation (Toepke, 2015) and consists of
geospatially enabled posts from Twitter and
Instagram occurring from 05.16.2014 00:00:00
(GMT) to 12.31.2014 23:59:59 (GMT). Publicly
available web service APIs were used to download
the data in a JavaScript Object Notation (JSON)
format.
Data purchased from GNIP (GNIP - The World’s
Largest, 2015) was briefly considered for this
investigation. Using the same geographic bounding
box as the publicly available data, a dense amount of
historical results was found, averaging
approximately 13,000 Tweets per month. However,
the cost for the data was out of scope at this stage of
investigation (GNIP Representative, 2015).
The publicly available posts were collected using
a Java Platform Enterprise Edition (J2EE) (Oracle,
2015) application deployed to the cloud. Google
App Engine (GAE) (Google App Engine, 2015) was
the infrastructure selected, and full use was made of
the datastore, user access and job scheduling APIs.
The infrastructure was chosen for convenience, low
cost and high availability; though the Twitter and
Instagram APIs are web service based, any
compatible programming language or enterprise
Structure Occupancy Curve Generation using Geospatially Enabled Social Media Data
33

architecture could have been leveraged.
Once collected, the data was inserted into an
open source PostgreSQL database installed with the
PostGIS extension. The geospatial extension allows
geospatial queries on the data; primarily used to
return records around a geofenced area.
Several buildings of interest were identified, and
geospatial queries were created to obtain the
necessary data. E.g., to query the Tweets from
around the San Jose Convention Center, the
following query was used:
SELECT * FROM twitter_data
WHERE timestamp < '2014-12-31
23:59:59 +00' AND timestamp > '2014-05-
16 00:00:00 +00'
AND
ST_contains(ST_MakePolygon(ST_GeomFromT
ext('LINESTRING(-121.890406 37.329801,
-121.889982 37.329170, -121.890669
37.328850, -121.889794 37.327613, -
121.886822 37.329409, -121.887664
37.330202, -121.888528 37.329865, -
121.888936 37.330428, -121.890406
37.329801)',3857)), "location");
The 'timestamp' portion of the query limits results to
the target dates, and the 'ST_contains' portion creates
a geofence, and returns the posts from the interior.
When creating the geospatial queries, projection
selection is of critical importance. The social media
posts are available in the EPSG:3857 projected
coordinate system (EPSG:3857, 2015). It is essential
that the 'location' field for each record in the
database as well as the previously shown query are
also in the same projection. Ignoring this detail can
return results that appear correct, but are inaccurate.
Choosing points for the geofence is most easily
done using a point selector that is coded in Google
Maps, or any other EPSG:3857 projection. Zooming
in as far as possible, while making sure to obtain as
much of the building as possible will give the best
results.
GPS accuracy also needs to be considered when
selecting the query border. Horizontal GPS precision
is currently claimed to be approximately 4 meters
RMS (Grimes, 2008). Readings can be ameliorated
by having a clear view of the sky, having many
satellites locked to the device, etc. The GPS reading
can also be degraded by electromagnetic
interference, adjacent buildings, quality of
device/antenna, etc. For a standalone structure like
the SJSU Event Center, this is less of an issue. When
attempting to attain occupancy curves of a structure
that has highly trafficked structures on adjacent
walls, estimations can be negatively affected.
The structures for this investigation were picked
based on expectation of a population utilizing social
media services, as well as being non-residential.
Residential buildings offer difficulty, as they are
never officially open/closed, and sleeping residents
will not be posting, thus creating a skewed
population expectation. Also, residential buildings
do not have the population density required to
provide an adequate population estimation.
The structures selected include:
• San Jose Convention Center: the primary
convention center in the city of San Jose, with
over 500,000 sq. ft. of event space and a
convenient downtown location (Convention
Center, 2015).
• San Jose State University (SJSU) Event Center:
capable of holding 7,000 individuals, this space
hosts the FIRST Robotics Competition in Silicon
Valley (Event Center Arena, 2015).
• SJSU Dr. Martin Luther King, Jr. Library: the
main campus library for the university.
• The Tech Museum of Innovation: a museum in
downtown San Jose with an IMAX theater and
exhibits focusing on energy efficiency,
exploration and genetics (The Tech Museum,
2015).
• SJSU Dining Commons: food hall for students at
the University.
Table 1: Total Tweet/Instagram Counts per Structure, 05.16.2014 to 12.31.2014.
Venue Tweets Instagrams Total
Convention Center, no S. Hall 5361 4754 10115
SJSU Event Center 1959 1529 3488
SJSU Library 1597 766 2363
The Tech Museum 595 653 1248
SJSU Dining Commons 1066 79 1145
La Victoria Taqueria 158 90 248
Convention Center, S. Hall 79 95 174
Naglee Park Garage 21 54 75
GISTAM 2016 - 2nd International Conference on Geographical Information Systems Theory, Applications and Management
34
• La Victoria Taqueria: a popular restaurant known
for inexpensive Mexican food (La Victoria
Taqueria, 2015).
• San Jose Convention Center, South Hall: a
standalone 80,000 sq. ft. exhibit space (South
Hall, 2015).
• Naglee Park Garage: a neighborhood bistro
serving new American cuisine with a large
outdoor sitting area.
Once the queries have been created, and the
buildings selected, the occupancy curves were
created with the following pseudocode.
for each structure
for each day of week (SMTWTFS)
get Twitter/Instagram count for
each hour
get number of unique days (e.g.
Mondays) in data sample
average count for each hour of
each day by number of specific
weekdays
display resulting data in a
JavaScript chart
The pseudocode was implemented in Java, and
interacts directly with the PostgreSQL database
using Java Database Connectivity. The results for
each structure are displayed in a website utilizing
Highcharts, an interactive charts plug-in for
JavaScript (Kuan, 2015).
This investigation uses a snapshot of previously
collected data as a standalone prototype. When the
curve generation code is running along with the
Twitter/Instagram collection code, a regularly
updating aggregate estimation for each structure can
be maintained; resulting in an always up-to-date,
pseudo real-time estimation.
4 RESULTS/OBSERVATIONS
The code was run on the eight structures; Table 1
shows the counts of each set of results.
For each structure, a Google Map web page was
made, with each social media post being represented
as a balloon, to verify all posts are within the
expected borders. An example of this map can be
seen in Figure 1.
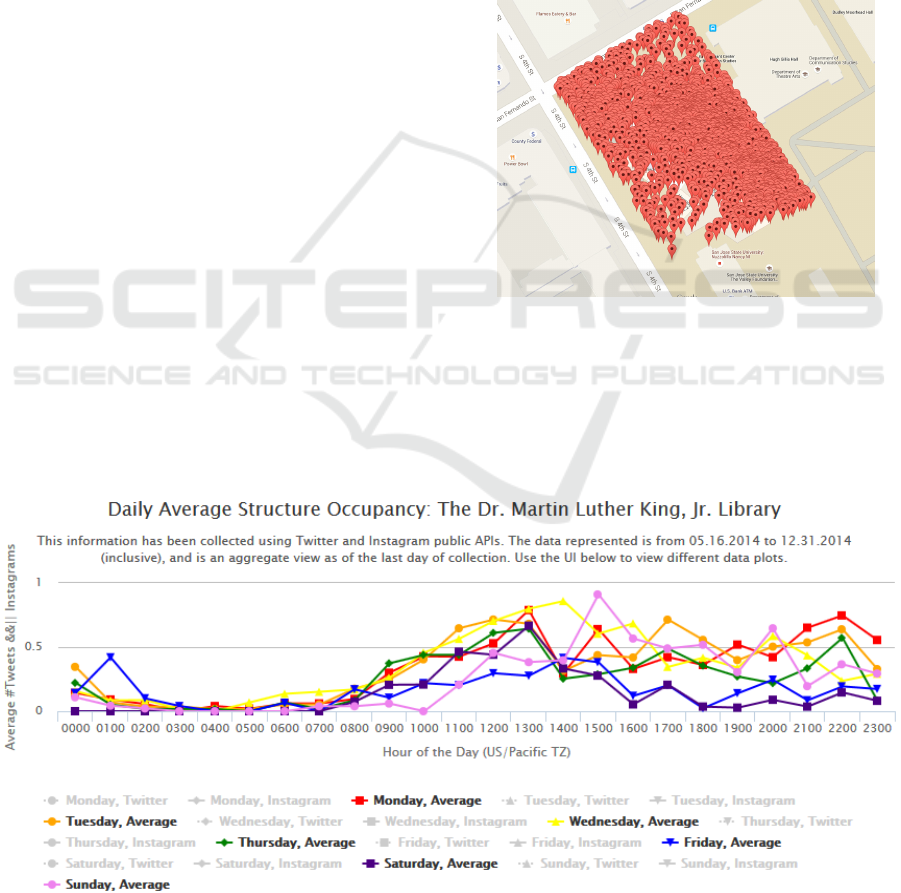
Figure 1: Results of query on SJSU Library.
For each structure, an interactive JavaScript web
page was created that allows the user to view
Twitter/Instagram posts individually, or as an
average, for each day. The average occupancy for
the SJSU library is shown in Figure 2.
Figure 2: Structure Curves, SJSU Library.
Structure Occupancy Curve Generation using Geospatially Enabled Social Media Data
35
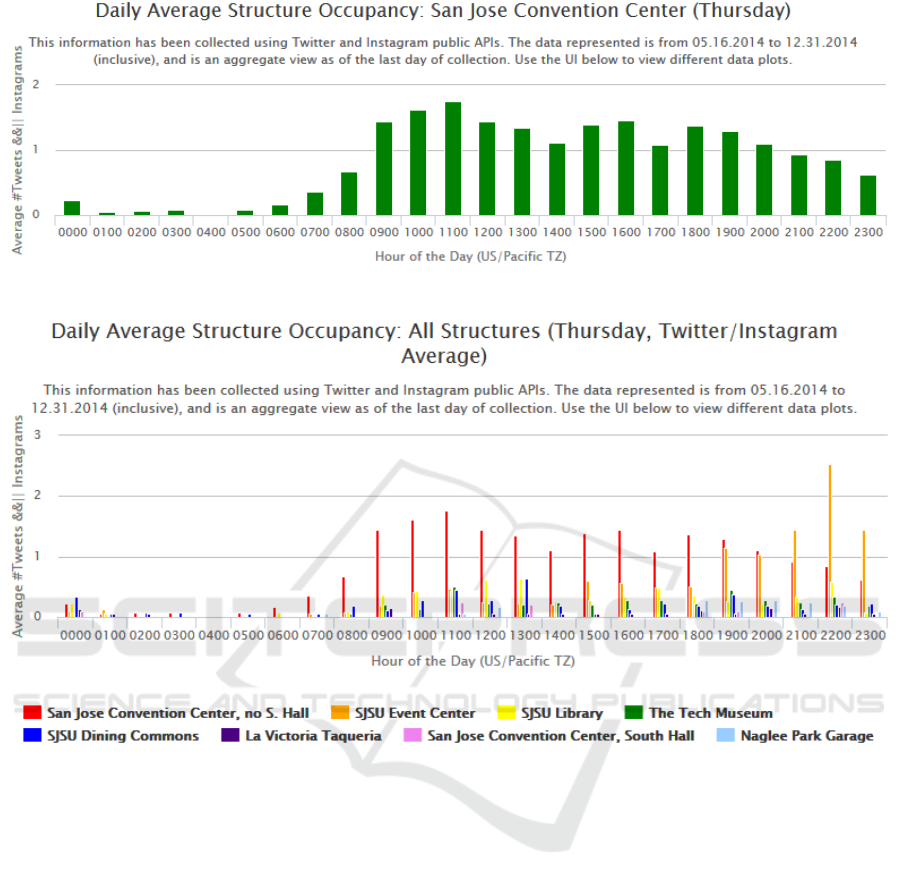
Figure 3: Structure Curve, SJSU Convention Center, Thursday, Average.
Figure 4: Structure Curves, All Structures, Thursday, Average.
Observation of the resulting charts of each
structure shows distinct patterns up until the SJSU
Dining Commons. For the remaining structures, it is
difficult to tell whether the results are noise, or
actual population estimation results. Though even
the Naglee Park Garage, a popular restaurant, which
has the lowest count of social media posts, shows
posts around what would be considered lunch/dinner
time.
Each graph can also be viewed as a bar graph. In
Figure 3, a reading from the San Jose Convention
Center on a Thursday is shown. There is a morning
rush, a lull after lunch, with the rest of the afternoon
becoming slightly stronger before tapering off.
It is of note that results exist outside the regular
building hours, for each structure. This is likely a
result of the aforementioned GPS horizontal error in
the social media posts. While the results could be
from individuals who are inside after hours, they
likely come from people who are walking by, or
standing near the buildings.
Figure 4 shows a full representation of each
structure, for a Thursday. One can see a clear ebb
and flow of posts throughout the day, as well as a
drastic drop when the structures are meant to be
closed.
Comparing these results with known occupancy
curves is the most effective way to validate this
estimation method. Unfortunately, traditional
population density generation methods do not have
the spatiotemporal precision necessary to generate
an adequate comparison. Disaggregation methods
used in NDPop (Freire, 2015), and the Urban Atlas
polygons (Batista e Silva, 2013) make progress
towards combining traditional sources and honing
this precision.
Another method for validation would be
partnering with buildings that currently implement
GISTAM 2016 - 2nd International Conference on Geographical Information Systems Theory, Applications and Management
36

an active access-control scheme. Assuming the
measures are implemented effectively, the data
would provide a compelling comparison against the
curve estimations.
The full results, including Google Map
representations of the data queries, as well as the
JavaScript charts for each structure, with curves for
each day of the week, can be obtained by emailing
the author.
5 FOLLOW-ON WORK
This is a cursory investigation, to show proof of
concept for structure occupancy estimation. The
current algorithm will benefit from the following.
• Denser data and/or a longer collection period.
Full-stream data, purchased from GNIP would
give a more realistic representation of the social
media posts, as only a subset is publicly
available through the official APIs. The longer
collection period will give a more robust
average, resilient to rapid and/or irregular
population swings.
• Integration of method with other novel
population distribution methods e.g. NDPop
(Freire, 2015), and as part of a data source for a
more precise spatiotemporal model (Martin,
2015).
• Social media post processing.
Identifying/removing cross-posts from different
services will allow the curves to more accurately
represent a human population. Limiting the
number of posts per user in a specified time
frame will also prevent skewing of the
estimation.
• Sensor filtering. Integrating basic filtering
approaches to the curve generation algorithm,
such as smoothing and outlier removal, will
result in a more precise estimation.
• Performing comparative studies using objective
building occupancy curves, generated from a
properly implemented, active access-control
policy.
• Investigating a way to represent technology non-
adopters, including estimations from census data
and/or time use surveys.
• The Google PT curves offer an opportunity for
comparison/contrast, for implemented buildings.
The data is sourced from Android users who
have chosen to share their locations (Popular
Times, 2015); depending on Android
pervasiveness as well as user-opt in, this curve
can be beneficial.
Twitter and Instagram were chosen for the services'
consumer acceptance in the geographic area of San
Jose, CA. Integration/weighting of other geospatially
enabled social media products such as Foursquare,
Facebook, Panaramio, etc., as well as data fusion
with the Google PT curves, would result in a more
robust estimation from social media.
6 CONCLUSIONS
This study has shown the feasibility of using social
media posts for the effective estimation of building
occupancy curves. These curves are of interest in
application domains including energy estimation,
emergency response, etc. The results of geofenced
queries are shown and discussed; and follow-on
work is described.
While this method is shown effective for highly
trafficked buildings, geospatially enabled, publicly
available Twitter and Instagram data is not dense
enough as of late 2016, to give an occupation
expectation for a less travelled structure. Using
purchased data, with a greater data density as well as
integration from other services could help to provide
a more precise picture.
REFERENCES
Aubrecht, Christoph, Joachim Ungar, and Sergio Freire,
2011. "Exploring the potential of volunteered
geographic information for modeling spatio-temporal
characteristics of urban population: a case study for
Lisbon Metro using foursquare check-in data."
International Conference Virtual City and Territory
(7è: 2011: Lisboa) (pp. 57-60).
Batista e Silva, Poelman, Martens, Lavalle, 2013.
Population Estimation for the Urban Atlas Polygons.
Rep. no. EUR 26437 EN. Ispra: European
Commission, Joint Research Center, Italy. Print. ISBN
978-92-79-35089-4.
Bhaduri, Budhendra, et al, 2007. "LandScan USA: a high-
resolution geospatial and temporal modeling approach
for population distribution and dynamics." GeoJournal
69.1-2 (pp. 103-117).
Convention Center | San Jose - Innovation Starts Here |
Team San Jose., 2015. Convention Center | San Jose -
Innovation Starts Here | Team San Jose. [ONLINE]
Available at: http://www.sanjose.org/plan-a-meeting-
event/venues/convention-center. [Accessed 19
September 2015].
Dong, B. and Andrews, B., 2009, July. Sensor-based
Structure Occupancy Curve Generation using Geospatially Enabled Social Media Data
37

occupancy behavioral pattern recognition for energy
and comfort management in intelligent buildings. In
Proceedings of building simulation (pp. 1444-1451).
EPSG:3857 - OpenStreetMap Wiki, 2015. EPSG:3857 -
OpenStreetMap Wiki. [ONLINE] Available at:
http://wiki.openstreetmap.org/wiki/EPSG:3857.
[Accessed 19 September 2015].
Event Center Arena - Wikipedia, the free encyclopedia,
2015. Event Center Arena - Wikipedia, the free
encyclopedia. [ONLINE] Available at:
https://en.wikipedia.org/wiki/Event_Center_Arena.
[Accessed 19 September 2015].
Freire, S., Florczyk, A. and Ferri, S., 2015. Modeling day-
and nighttime population exposure at high resolution:
Application to volcanic risk assessment in campi
flegrei. 12th International Conference on Information
Systems for Crisis Response and Management.
Fuchs, G., Andrienko, N., Andrienko, G., Bothe, S. and
Stange, H., 2013, November. Tracing the German
centennial flood in the stream of tweets: first lessons
learned. Proceedings of the second ACM SIGSPATIAL
international workshop on crowdsourced and
volunteered geographic information (pp. 31-38).
GNIP Representative, 23 Jul. 2015. “Re: Twitter Data
Discussion.” Message to the author. E-mail.
GNIP - The World's Largest and Most Trusted Provider of
Social Data, 2015. The Source for Social Data.
[Accessed 17 October 2015].
Google App Engine: Platform as a Service - App Engine
— Google Cloud Platform, 2015. Google App Engine:
Platform as a Service - App Engine — Google Cloud
Platform. [ONLINE] Available at:
https://cloud.google.com/appengine/docs. [Accessed
19 September 2015].
Grimes, John G, 2008. "Global Positioning System
Standard Positioning Service Performance Standard."
GPS Navster, Department of Defense.
Kuan, Joe, 2015. Learning Highcharts 4. Packt Publishing
Ltd. [Accessed 19 September 2015].
Kubanek, J., Nolte, E.M., Taubenböck, H., Wenzel, F. and
Kappas, M., 2014. Capacities of remote sensing for
population estimation in urban areas. In Earthquake
Hazard Impact and Urban Planning (pp. 45-66).
La Victoria Taqueria - 405 Photos - Mexican - Downtown
- San Jose, CA - Reviews - Menu - Yelp, 2015. La
Victoria Taqueria - 405 Photos - Mexican - Downtown
- San Jose, CA - Reviews - Menu - Yelp. [ONLINE]
Available at: http://www.yelp.com/biz/la-victoria-
taqueria-san-jose-2. [Accessed 19 September 2015].
Laituri, Melinda, and Kris Kodrich, 2008. "On line
disaster response community: People as sensors of
high magnitude disasters using internet GIS." Sensors
8.5 (pp. 3037-3055).
Martin, D., Cockings, S. and Harfoot, A., 2013.
“Development of a geographical framework for census
workplace data.” Journal of the Royal Statistical
Society: Series A (Statistics in Society), 176(2) (pp.
585-602).
Martin, D., Cockings, S. and Leung, S., 2015. Developing
a flexible framework for spatiotemporal population
modeling. Annals of the Association of American
Geographers, 105(4) (pp. 754-772).
Mennis, Jeremy, and Torrin Hultgren, 2006. "Intelligent
dasymetric mapping and its application to areal
interpolation." Cartography and Geographic
Information Science 33.3 (pp. 179-194).
Namiot, Dmitry, and Manfred Sneps-Sneppe, 2013.
"Geofence and network proximity." Internet of Things,
Smart Spaces, and Next Generation Networking.
Springer Berlin Heidelberg (pp. 117-127).
Oracle Technology Network for Java Developers | Oracle
Technology Network | Oracle, 2015. Oracle
Technology Network for Java Developers | Oracle
Technology Network | Oracle . [ONLINE] Available
at:
http://www.oracle.com/technetwork/java/index.html.
[Accessed 19 September 2015].
Popular times - Google My Business Help, 2015. Popular
times - Google My Business Help. [ONLINE]
Available at:
https://support.google.com/business/answer/6263531?
hl=en. [Accessed 19 September 2015].
Richardson, Ian, Murray Thomson, and David Infield,
2008. "A high-resolution domestic building occupancy
model for energy demand simulations." Energy and
buildings 40.8 (pp. 1560-1566).
Rose, Amy N., and Eddie A. Bright, 2014. The LandScan
Global Population Distribution Project: Current State
of the Art and Prospective Innovation. Oak Ridge
National Laboratory (ORNL).
Sims, Weber, Bhaduri, Thakur, and Resseguie, 2015.
"Application of Social Media Data to High Resolution
Mapping of a Special Event Population." Proc. 13th
Int. Conf. GeoComp (pp. 159-164).
Smith, Aaron, 2015. US Smartphone Use in 2015. Pew
Research Center.
South Hall | San Jose - Innovation Starts Here | Team San
Jose, 2015. South Hall | San Jose - Innovation Starts
Here | Team San Jose. [ONLINE] Available at:
http://www.sanjose.org/plan-a-meeting-
event/venues/south-hall. [Accessed 19 September
2015].
The Tech Museum of Innovation - Wikipedia, the free
encyclopedia, 2015. The Tech Museum of Innovation -
Wikipedia, the free encyclopedia. [ONLINE]
Available at:
https://en.wikipedia.org/wiki/The_Tech_Museum_of_
Innovation. [Accessed 19 September 2015].
Toepke, Samuel Lee, and R. Scott Starsman, 2015.
"Population Distribution Estimation of an Urban Area
Using Crowd Sourced Data for Disaster Response."
12th International Conference on Information Systems
for Crisis Response and Management.
GISTAM 2016 - 2nd International Conference on Geographical Information Systems Theory, Applications and Management
38
