
Validating Sociotechnical Systems’ Requirements through Immersion
Andreas Gregoriades
1
and Maria Pampaka
2
1
Cyprus University of Technology, Limassol, Cyprus
2
The University of Manchester, Manchester, U.K.
Keywords: Requirements Validation, Simulation, Human Factors, Virtual Reality.
Abstract: One of the most critical phases in complex socio-technical system development is the validation of non-
functional requirements (NFR). During this phase, system designers need to verify that the proposed system’s
NFRs will be satisfied. A special type of NFRs which is often ignored regards the Human Factors (HF) NFRs.
These requirements are of vital importance to socio-technical systems since they affect the safety and
reliability of human agents within such systems. This paper presents a scenario-based approach for validating
HF NFRs using VR CAVE simulation. A case study is used to demonstrate the application of the method in
the validation of the situation awareness NFR of an in-vehicle Smart driver assistive technology (SDAT).
Such systems aim to alleviate accident risks by improving the driver’s situation awareness by drawing their
attention on critical information cues that improve decision making. The assessment of the HF NFR is
achieved through an experiment with users in a virtual environment. This work describes and demonstrates a
method that utilizes a custom-made, modular 3D simulator that uses a number of hazardous scenarios, for the
validation of the HF NFRs of prospective systems.
1 INTRODUCTION
Requirements validation constitutes an important
facet of a successful system development. Unlike
functional requirements, which can be
deterministically validated, non-functional
requirements (NFRs) are considered as soft/latent
variables not directly observed or implemented;
instead, they are satisfied (Zhu et al., 2012) by
functional requirements. Despite their importance,
NFRs are usually addressed at a late stage of system
development, whilst functional requirements are
considered at the early phase of software
development (Marew, 2009). Therefore, the initial
stages of a system’s specification may not address the
NFRs adequately, which could lead to system failure
once the system has been commissioned (Adams et
al., 2015). NFR analysis approaches range from
unstructured and informal, to highly formal and
mathematically-driven. The former include
approaches such as KAOS (Nwokeji et al., 2014), a
goal-oriented software requirements capturing
approach. In the same vein, i* approach (Chung et al.,
2000) uses goals and enables the quantification of
requirements from goal diagrams. The latter category
includes formal methods based on model checking such
as Z, Markov, and queuing models (Matoussi, 2008).
This paper introduces a Human Factors (HF)
requirements validation method that exploits
scenario-based testing through immersion. The
application of the methodology is demonstrated
through a case study on the analysis of the situation
awareness NFR of a future smart driver assistive
technology (SDAT). The uses a custom made virtual
reality (VR) simulator that mimics the environment
and models prototype SDATs using 3D visualizations
that simulate the candidate designs.
The paper next reviews the literature in NFR
assessment, HF and situation awareness (SA). This is
followed by the NFR validation methodology. Next a
case study demonstrates the application of the HF
NFR validation method, followed by analysis of the
data from the experiment and presentation of the
emerging results. The paper concludes with a brief
discussion of methodological and substantial
implications.
2 LITERATURE REVIEW
The majority of NFRs in complex socio-technical
systems address system properties such as
performance, reliability and security. However, there
is an additional dimension that needs to be analysed,
456
Gregoriades, A. and Pampaka, M.
Validating Sociotechnical Systems’ Requirements through Immersion.
In Proceedings of the 18th International Conference on Enterprise Information Systems (ICEIS 2016) - Volume 1, pages 456-463
ISBN: 978-989-758-187-8
Copyright
c
2016 by SCITEPRESS – Science and Technology Publications, Lda. All rights reserved

which is the human dimension. By definition a socio-
technical system exhibits both technical and social
complexity. These systems are composed of human
and machine entities that work together to accomplish
a common goal. Transportation systems belong to this
category of complex systems since they incorporate
vehicles, drivers, road infrastructure and intelligent
systems in vehicles. The technical aspects of these in-
vehicle systems refer to the functional requirements
of machine agents and the human-machine
interaction metaphors. The social facet of the system
relates to human factors and the associated human
performance constraints. Thus, designing such
complex systems requires the investigation of all
facets. The technical dimension is addressed by the
functional requirements and the system NFRs, while
the human dimension is influenced by HF NFRs.
These are defined by human agent limitations
affected by the diverse nature of human
characteristics, such as ability, stress, concentration,
SA etc. However, despite their importance as a
critical cause of systems failure, human factors have
not been adequately considered by practitioners
during the design, development, and testing of
systems (Gregoriades, 2004).
Moreover, even though human factors and
requirements have a lot to share, only a few studies
apply human factors knowledge to requirements
engineering. While NFR such as performance,
security and maintainability are considered for
software functions, NFRs for people, such as SA and
workload, have received less attention. Such
requirements have been proven very significant in
preventing system failure, articulated in the form of
accidents in complex systems such as transportation
(Gregoriades, 2010). Therefore, the systematic
analysis of this type of NFRs prior to any system
implementation is considered vital. The main
problem in validating these requirements is the need
for a detailed specification of the envisioned system
or the implementation of a prototype system. Both of
these activities are time consuming and expensive.
The former requires formal methods which are hard
to comprehend by stakeholders and the latter requires
time effort and cost. Once either of the two is realised
it is possible to perform an analysis of system
behaviour under a number of test scenarios. Formal
methods, though, suffer from being too specific,
hence their application in validating NFRs is
constrained. Prototyping, on the other hand, provides
a more generic model based on which different facets
of the system can be tested such as people, technology
and tasks. This, however, is expensive and risky.
Therefore, the use of a simulated environment for
requirements analysis saves the costs of prototypes,
especially for complex systems (Sutcliffe et al., 2004)
and makes the process safe. This approach, employed
in this study, enables testing technological solutions
and the evaluation of their effect prior to
implementation.
Designing complex systems such as the smart in-
vehicle information systems requires the effective
and efficient management of requirements. The
inappropriate specification of functional and non-
functional requirements increase dramatically the risk
of failing to meet customer needs (Peng, 2012).
Functional requirements have received much
attention in this process, while, NFRs have been more
or less deliberately ignored (Illa, 2000). This led to a
lot of systems failing due to improper management of
NFRs. Past research addressed extensively different
sets of NFRs along with frameworks of NFR such as
Softgoal Interdependency Graphs (SIGs) (Zhu, 2012).
NFR validation has attracted significant attention
in recent years due to the importance of NFRs in
overall system acceptance. Traditional approaches to
NFR validation include prototyping and inspection.
Recent approaches focus on the quantitative analysis
of NFRs. In our previous work we used a Bayesian
Networks (BN) approach to model NFRs using
knowledge elicited from the domain (Gregoriades,
2005). NFRs are assessed based on a scenario
generation and evaluation algorithm that runs the BN
with different input. The output is a quantitative
estimation of the satisfiability of the NFR. Other
groups (Zayaraz et al., 2005; Sadana et al., 2007) also
used a quantitative model to analyze conflicts among
NFRs. This approach, however, is limited to high
level architectural requirements. In the same vein,
Marew and colleagues (Marew et al., 2009) used
Quantified Softgoal Interdependency Graphs
(QSIGs) to assess the degree of softgoal satisfaction.
However, the assessment of QSIGs is based on
subjective estimates of the degree of interdependencies
among softgoals. Similarly, Zhu et al. (2012) apply
fuzzy qualitative and quantitative softgoal
interdependency graphs for NFRs tradeoff analysis.
Based on the above, it is evident that NFRs assessment
is an ongoing research issue. The growing ubiquity of
complex sociotechnical systems led to more NFRs to
be analysed during systems’ design phase. One
example of such NFRs is safety which is addressed in
this study and expressed in terms of accidents.
2.1 Human Factors & Requirements
NFRs such as performance and maintainability are
specified for software or hardware systems. NFRs for
Validating Sociotechnical Systems’ Requirements through Immersion
457

people, such as SA and workload, have received less
attention. These requirements, however, have been
proven very crucial in preventing system failure.
Specifically, in transportation, road accidents are
usually attributed to human error (Fuller, 2002;
Theeuwes et al., 2012) that is induced from low SA
caused by increased workload. Humans, as
information processing systems, have a number of
information flow channels (visual, auditory, tactile)
processing various information sources (e.g. a
navigation system display, the forward view through
the windscreen) of varied bandwidths (e.g. high-
density traffic will require a higher sampling rate than
low-density traffic). Our cognitive capacity is limited,
and consequently there is an upper threshold to the
amount of information we can process per second and
channel (Endlsey, 2000; Fuller, 2002; Holohan et al.,
1978). Therefore, we tend to share our attention
among a few information sources. An overloaded
driver is less likely to deal effectively with an
unexpected event (Konstantopoulos et al., 2010).
Fuller (2012) also expresses accident risk as a
function of the driver’s cognitive resources and task-
demand in the driver-road system.
Therefore, the systematic analysis of these HF
NFRs prior to any system implementation is
considered vital. The main problem in evaluating
these requirements is the need to implement a
prototype design of a hardware-software system,
which is expensive (Stone et al., 2001). Hence, the
use of virtual reality (VR) settings is becoming very
popular. One of the most important applications of
VR technology has been the use of virtual prototypes
for functional requirements analysis (Sutcliffe et al.,
2004). However, the use of VR for HF requirements
analysis has not been addressed. Essentially, HF
requirements can be expressed in terms of a threshold
value that defines their minimum quantification or
satisfaction level. These define the cognitive and
physical capabilities of humans. These capabilities
are put to the test when processing dynamically
changing information during driving. If these
capabilities are reached then this in effect increases
the likelihood of committing an error due to high
workload. Workload, however, is directly related to
SA; the link between the two has been previously
established (Gregoriades et al., 2007). When the
perceived information increases people tend to
prioritise which increases the risk of an incorrect
comprehension. In traffic safety, SA constitutes a
major critical factor, since it provides the driver with
the ability to anticipate events given perceived
driving and environmental conditions.
Validating HF requirements for such systems
makes the use of VR simulators inevitable due to the
complexity, effort and cost associated with the
development of prototypes. In the same vein,
controlling infrastructural parameters in the real
world is unethical. Moreover, ruling out confounding
effects to examine the influence of control measures
on HF is very difficult in field experiments. Driving
simulators provide the researcher with a powerful tool
to test driving behaviour under controlled settings.
Apart from the usually high cost of the simulator,
outsourcing of experiments to analyse driving
behaviour using native users is difficult, if not
impossible in some cases, due to the large number of
subjects needed for reliable results. On the other
hand, low cost driving simulators do not provide a
sufficient level of realism to analyse human factors.
Unrealistic conditions may affect the driving
behaviour which effectively could influence the
validity of the experimental study. The method
proposed herein demonstrates the design of a driving
simulator that exploits 3D modelling tools in a
scenario-based approach to promote realism and
interactive representation of road networks. The
approach simplifies the process of implementing 3D
road infrastructure models through the utilization of
reusable modules that represent different in-vehicle
technologies or infrastructural components. This
simplifies the process of designing/modifying the
simulation model by reusing model constructs in a
plug and play fashion, which enables the analyst to
easily design a range of experimental conditions (i.e.
scenarios), to evaluate assumptions and hypotheses
from different perspectives.
2.2 Situation Awareness
SA constitutes a major critical factor in complex
socio-technical systems. In transportation, it provides
the driver with the ability to anticipate events given
perceived driving and environmental conditions. SA
defines the process of perceiving information from
the environment (level 1), comprehending its
meaning (level 2) and projecting it into the future
(level 3). SDAT have been developed to alleviate
accident risk by either reducing driver workload or
assessing driver attentiveness. Examples include
adaptive cruise control, collision notification, driver
monitoring, traffic signal recognition, night vision,
lane departure warning systems and blind spot
monitoring. Such systems aim to draw drivers’
attention on critical cues that improve their decision
making. However, they only provide limited support
to SA since they address isolated factors and in some
cases with negative effect due to the extra information
ICEIS 2016 - 18th International Conference on Enterprise Information Systems
458

load they incur to the driver. The first step in
improving drivers’ SA is to enhance their capability
of perceiving and interpreting traffic and
environmental conditions (i.e. level 1 and 2 of the
aforementioned SA model). However, such smart
systems facilitate level 3 SA for navigation, which
might decrease drivers’ attention, due to secondary
task execution, that could lead to reduced level 1 SA.
This could undermine attention to operational or
tactical driving activities (e.g. braking, lane changing,
gap acceptance etc.). To that end, three important
issues need to be addressed prior to any SDAT
development: (i) identification of drivers’
information needs that could enhance SA, (ii) the
specification of a SDAT feedback metaphor
(feedback type and appropriate time for issuing
warnings) to support those needs without impairing
driver attention, and (iii) the evaluation of the effect
of a prospective SDAT on traffic safety. This is a
complex process and in most cases is only feasible
once a prototype of the system is available.
Endlsey et al. (2012) warn socio-technical system
designers of the importance of maintaining SA in
complex systems and draw attention on the issues that
could inhibit SA. One of the most important strains of
SA is information overload. Too much information at
any point in time hinders human operators’ adequate
SA. Overloading divides the decision maker’s
attention among numerous stimuli resulting in
increased demand for cognitive resources. This is
known as attentional tunnelling (Endlsey, 2012) and
results in reduced information scanning capability.
3 NFR VALIDATION METHOD
The proposed NFR validation method is based on the
design science (Hevner et al., 2010) paradigm, and in
particular its evaluation phase which investigates the
effectiveness of an artefact and guides its re-design
through changes in specification. Design science
synthesises the sciences of the artificial, engineering
design, information systems development, system
development as a research methodology, and
executive information system design theory for the
building and evaluating of IT artefacts for specific
problems (Hevner et al., 2010). The design and
development of new artefacts such as the SDAT,
described herein, requires a systematic approach
towards artefact design, development and evaluation.
This aims to assure that the artefact contributes
towards resolving a particular problem.
The method is composed of a number of steps that
are executed both in sequence and in parallel at
certain stages. Initially, the problem needs to be
expressed in terms of human factors specification.
This could be articulated in terms of human
performance and human reliability, and in particular,
as the acceptable SA and workload levels of human
agents in a system. These are conditions that could
incur high likelihood of human error (Gregoriades,
2010). Once the problem to be analysed is clearly
stated and the critical HF NFRs are identified, then
the minimum level NFR satisfiability needs to be set.
The refinement of HF NFRs into functional
specifications which when realised will guarantee the
satisfaction of the NFR comes next. This is achieved
using a combination of domain knowledge and input
from subject matter experts. For instance, guidelines
for enhanced SA, as specified by Endlsey (2012), are
expressed in terms of information requirements,
visualisation metaphors and interaction styles which
are functional requirements that the SDAT should
have. The next step in the process is the specification
of the test scenarios, based on which the artefact is
going to be evaluated. Grounded within the problem
to be analysed, the goals of the desired virtual
environment are set. Accordingly, specifications of
the virtual environment to be used for the evaluation
of the artefact are also set. During this stage a generic
VR simulator is customized based on the above goals,
to model the problems in question. The
customization of the simulator is composed of three
steps: 1) the development of the test environment in
terms of buildings, infrastructure and traffic
conditions. 2) The modelling of the scenarios, as
described by the domain experts; these include
atypical events in the simulation that would stress test
the subjects in the experiment. 3) The modelling of
the virtual version of the artefacts under scrutiny.
Prior to its use, the VR simulator needs to be validated
against a number of factors such as realism, to
guarantee the correctness of the NFR assessment.
NFRs quantification is achieved through an
experiment with users in the VR environment. The
specification of the experiment is defined by an HF
expert. The assessment of NFR is then refined into
phenotype behaviours that can be monitored in a
driving simulator. Phenotype driving behaviours are
monitored and logged into the systems database. The
logged observations from the simulation are pre-
processed, analysed and subsequently collated into a
single metric that corresponds to the assessed NFR.
The NFR assessment is compared against the desired
NFR level. If the minimum level of NFR is not
satisfied then the virtual artefact under scrutiny needs
to be redesigned. The process is repeated until the
NFR is satisfied.
Validating Sociotechnical Systems’ Requirements through Immersion
459
4 CASE STUDY
To demonstrate the application of the method, a case
study was conducted for the validation of the SA
NFRs of a future SDAT. The NFR evaluation method
is based on the paradigm of scenario-based testing. In
each scenario, participants were required to drive
through a pre-specified path on a road network.
Throughout the driving task, participants had to
respond to emerging hazardous situations. Situational
cues were visualised through the SDAT in the form
of a virtual augmented reality head-up display (HUD)
interface within the virtual vehicle. The SDAT
interface was designed based on identified driver
information requirements and domain knowledge
(Endlsey, 2012). SDAT designs aimed to address
drivers' information needs for better SA. Specifically,
vehicle's peripheral traffic, road works, road signs
and approaching traffic jam were projected through
the virtual SDAT. The goal was to assess the effect of
each SDAT design on drivers’ SA. Satisfiability of
SA NFR is specified as an improvement in drivers'
SA using SDAT compared to no SDAT use, and is
specified as a threshold value. Two SDAT designs
were developed using Endlsey’s (2012) design
principles for SA support. The functional
requirements of the SDAT systems have been
implemented using the guidelines of: information
prioritization, timeliness and relevance of
information, information filtering, familiarity of the
visual metaphors, and presentation of information in
the right context. These aim to alleviate information
overload, reduce display density, enhance driver’s
ability to comprehend the meaning of information and
finally assist in developing projections of the situation
into the future. The SDATs utilise the above through
fusion of vast amount of information from the
environment into meaningful attentional directives/cues
that describe the driving situation in real-time.
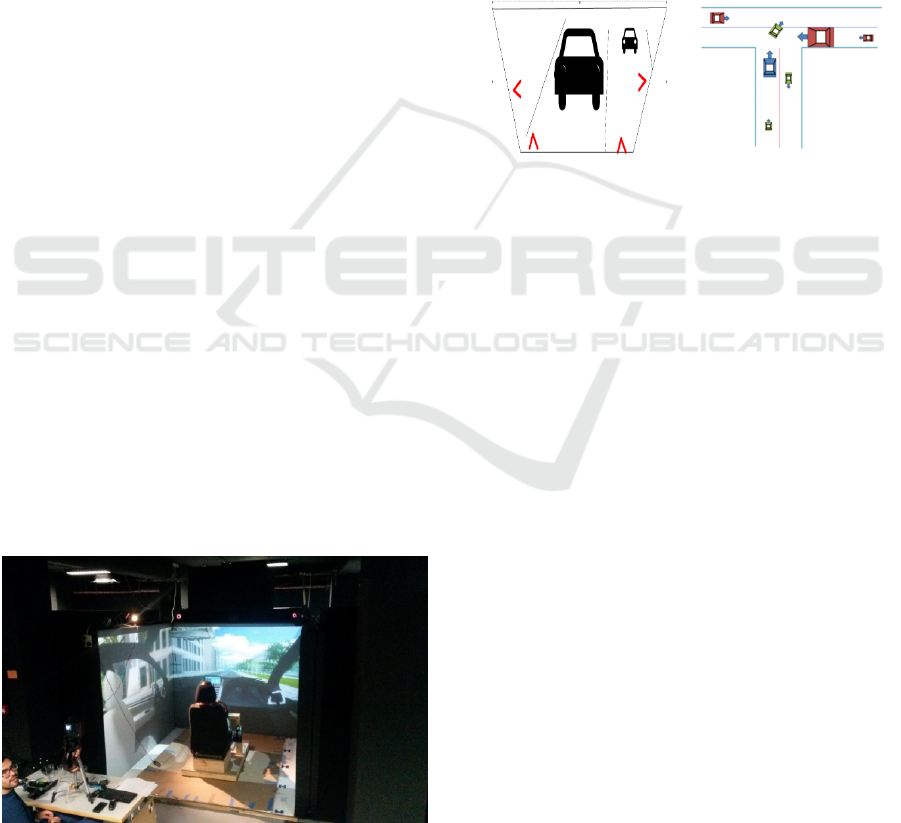
Figure 1: The driving simulator in the VR CAVE. A
participant doing the experiment while being observed by
researchers.
As part of the NFR validation method, the first
step is the design and implementation of the driving
simulator. Figure 1 illustrates the developed simulator
in VR CAVE that enables the stereoscopic interaction
of participants with the experimental conditions.
Participants are immersed with the experimental
scenarios through a combination of augmented reality
and tangible interaction styles, for a more realistic
experience. The second step in the method is the
design of the virtual prototype SDAT systems in the
virtual environment. The development of the virtual
SDATs is realized using a scripting language. The
virtual SDAT had to abide to the functional
requirements specified in previous steps. The third
step is the specification of the hazardous scenarios.
Figure 2: The radar design (right) and information
prioritisation –arrow design (left).
The user interface of SDAT systems is of
paramount importance in improving SA. Hence, it
was designed to provide blind-spot information and
to alert drivers of unseen imminent threats. The
system uses a combination of HUD with augmented
reality capabilities, so that the direction of the threat
is clearly comprehended by drivers. The information
architecture of the UI aimed to provide the driver with
enhanced peripheral vision with a dynamic
assessment of the most critical entities within the
immediate periphery of the vehicle. The blue print
designs of the candidate systems are depicted in
Figure 2. In the first design (radar), the host vehicle is
shown in a circle (in blue) surrounded by red and
green vehicles of different sizes. The size and colour
of surrounding vehicles denotes the level of risk.
Hence, vehicles that are in the driver’s blind spot are
considered high risk and are represented by big red
icons. Low risk cars are depicted with small green
icons. High proximity or hidden vehicles at
intersections are also high risk and hence are shown
as big and red. Surrounding vehicles’ positions and
speeds can be obtained from on-board vehicle
sensors. Vehicles at intersections can be obtained
through vehicle-to-vehicle communication protocol.
The prototype visualization metaphor presented in
Figure 2 is depicted on the vehicles windshield. The
second design (arrows) of the system is based on the
ICEIS 2016 - 18th International Conference on Enterprise Information Systems
460

need to prioritize information based on risk level and
aims to warn drivers of vehicles that are expected to
emerge from side roads and are not yet visible or
vehicles that are in driver’s blind spot. This, as
illustrated in Figure 2, is expressed using arrows, on
the augmented reality windscreen, pointing to the
direction of the imminent threat, and is depicted on
the vehicle’s smart windshield. The most critical
threat is depicted on the screen so as not to split the
attention of the drivers among competing risks. This
gives extra time to drivers to react to critical situations
The assessment of SA is achieved through an
experiment with subjects using the developed driving
simulator and virtual SDAT in a 3D CAVE facility.
During this stage, 17 participants were involved, each
spending on average of 90 min to complete the
experiment in the VR CAVE lab. The analysis of the
data collected from the experiments aimed to assess
the SA NFR for the two candidate SDAT designs.
Data was collected in three phases: before, during
and after the experiment. During the pre-experimental
phase, the Manchester Driving Style questionnaire
(Reason et al., 1990) was used to elicit the driving
style of participants along with their demographic
information. At the post experimental phase, data
collection focused on the evaluation of the two
candidate designs using a series of questions on four
constructs: functionality, information visualization,
usability and usefulness. During the experiment,
participants’ SA was measured while they were
driving in a pre-specified route in the artificial road
network within the 3D driving simulator (Figure 1),
both with and without the SDATs. In particular,
participants were asked to consult the HUD SDAT as
during the driving simulation surrounding vehicles
engaged the host vehicle by either pulling in or
stopping in front of the driver. During the drivers’
engagement with the experimental conditions,
phenotype behavioural data related to driver
workload and SA was recorded. Driver related data
was recorded in a log-file on a simulation time-step
basis. Specifically, manifestations of workload, such
as lateral deviations (Montella et al., 2011), attention
level through an electroencephalography (EEG)
measurement, lane change, headway, speed,
acceleration, deceleration, breaking patterns and
steering wheel angle, were recorded on a time-
location log-file. Collected data was automatically
assigned to road sections that were specified in
advance by the analysts, based on infrastructural
properties. The assessment of the drivers’ SA was
achieved using the SAGAT (Situation awareness
global assessment technique) method, which uses
objective measures of SA gathered during an
interruption in task performance. Hence, during each
scenario with the participant, the simulation was
stopped (freeze) three times, at points on the road
network where the three dangerous scenarios were
unfolding (car pulling in from the left, car stopping in
front, car pulling in from the right). At each
simulation freeze, participants were asked to
complete a questionnaire that inquired their
understanding of the situation. During the freeze, the
simulators screens were blank. The simulator saved
several screenshot of the situation just before the
freeze to enable the comparison between the ‘actual’
event and the subjects’ perceived situation.
5 RESULTS
Data collected from the simulations were pre-
processed and analysed to identify differences
between the actual situation and the participants’
perceptions of the situation under the three conditions
and the three interventions (phases). Analysis was
conducted on both the post-experiment and the
experiment data. Results from the post experiment
data revealed that both SA enhancement systems
were perceived by the users as improvements over the
control condition (i.e. without any enhancement).
Specifically, the post-experiment questionnaire
addressed the following dimensions of each candidate
design: features, user interface, ease of learning,
system capabilities, usefulness, ease of use, and SA.
Each dimension was supported on average by 5
questions, on a 7 point response scale from 1
(negative effect) to 7 (positive effect). To increase the
discrimination in the evaluators’ judgment,
participants’ were asked to report the reasons for their
choices and any interaction problems they had
experienced under the relevant heuristic. Figure 3
shows the percentages of positive responses (i.e. >4, or
<4 for negatively worded statements) for each of the
measured dimension on which the two designs were
evaluated. Based on this analysis, there do not seem to
be noticeable differences in regards to user interface
and ease of use. However, overall the radar design
seems to have been perceived more positively than the
arrows, especially in relation to learning, system
capabilities, and usefulness. This might be attributed to
the small size of the arrows that were popping up on
the smart windshield. Among the two designs the radar
design was also considered more appropriate to
support driver SA. Moreover, based on open responses
from participants, in certain occasions, the number of
arrows that were present on the windshield were more
than two. Hence, the cues were becoming destructing
Validating Sociotechnical Systems’ Requirements through Immersion
461
rather than informative. On the other hand, the Radar
design also had its shortcoming in terms of
visualization of the threats. Specifically, the colouring
and size of threats were considered insufficient.
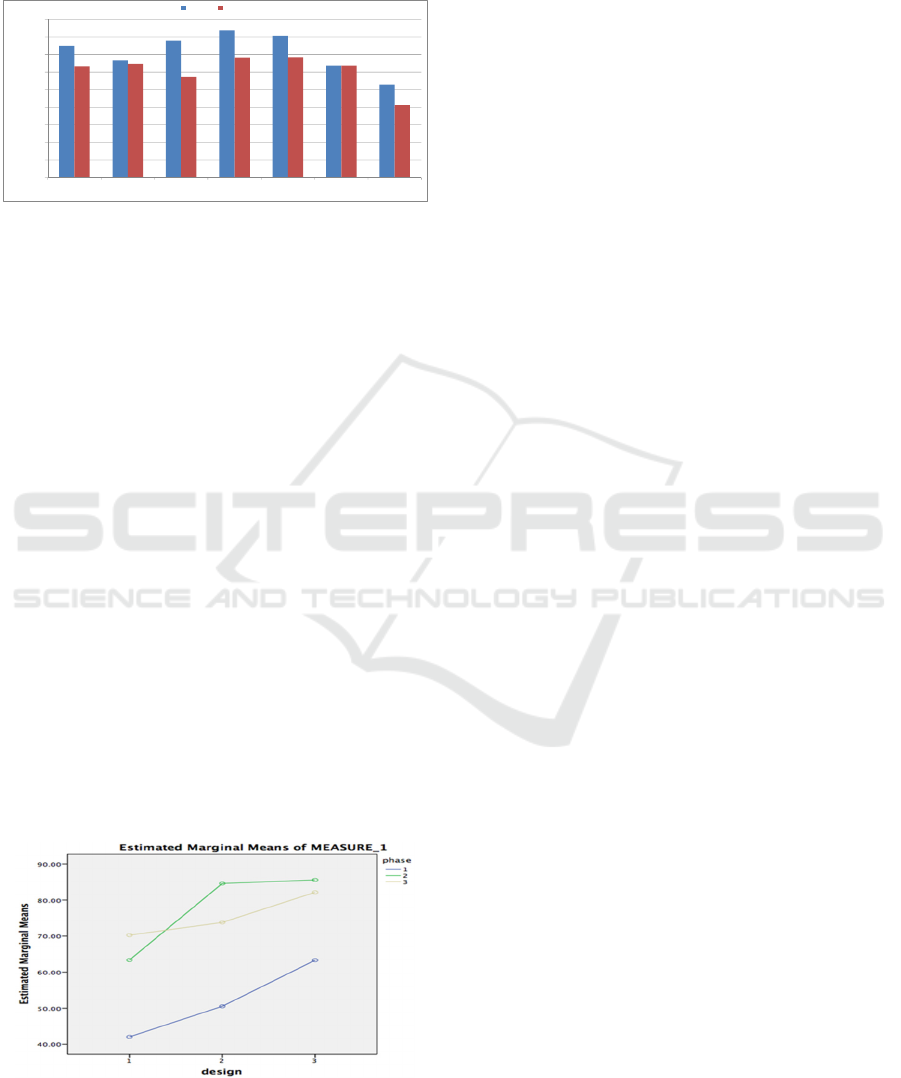
Figure 3: Percentages of positive responses in each of the
measured dimensions, by design.
Results from data during the experiment aimed to
assess the SA NFR using a combination of the
SAGAT data and the driver behaviour data from the
simulation log files. Initially the SAGAT and the
driver behaviour data were integrated into one dataset
for each participant. Subsequently the data that
represented the actual situation was compared with
the data that represented the perceived situation for
each participant at each phase of the experiment. The
similarity assessment between actual and perceived
was estimated using the Euclidian distance metric.
Analysis of the SA data was then performed using
ANOVA in a within-subjects model. Based on the
results, the use of both SDAT designs in an
augmented reality overhead display demonstrated a
superior performance to no-design. Results from the
SAGAT analysis also revealed that design 1 (radar)
was superior to design 2(arrows) and no design. This
was identified as significant based on figure 4. In the
same vein, the phase of the simulation freeze,
denoting the sequence of the freeze, was also
identified as a significant factor with phase 3 in the
radar design having on average a SA metric of 85%
compared to 63% in the control condition (no design).
Figure 4: Estimated marginal mean for the 3 designs (radar
-1, arrows-2, no-design-3) and the three phases of the
simulation (freeze1-3).
6 CONCLUSIONS
The HF NFR validation method presented herein
provides a novel cost effective solution to validating
HF NFRs of prospective complex sociotechnical
systems. It enables the evaluation of NFRs through
experimentation in VR settings under an envelope of
test scenarios. The developed driving simulator is
component-based and hence enables the requirements
engineer to easily customize it to the problem in hand.
Requirements are realised in virtual settings and this
provides designers with the flexibility of customizing
the functionality of the SDAT in an attempt to satisfy
the HF NFR under consideration. Results from the
application of this method in the validation of the SA
NFR of an in-vehicle SDAT revealed the method’s
practicality. The method is based on design science
and encourages the redesign of the artefact until it
satisfies the NFR. Results indicate that what the users
experience during their interaction with the artefact
and what they perceived of this experience as
reported in the post-test questionnaire point to the
same conclusion. Specifically, statistical analysis of
the data collected indicated that the radar design is
superior to arrows and no design. Similarly,
subjective evaluation of the candidate designs also
revealed the same results. Hence, this agreement is a
good indication that the NFR validation method is
producing accurate estimations. Limitations of this
work concentrate on the simulator’s level of realism
and immersion factors that laboratory methods suffer
from. Simulated settings do not currently offer the
resolution of the real world, and so they may affect
driving behavior. Future work will include the
improvement of the realism factor which in turn will
improve observational accuracy. Moreover, the
experimental design for the evaluation of the SA was
very time consuming. This could be optimized though
the use of a cut down version of the SAGAT
questionnaire.
ACKNOWLEDGEMENTS
This work was funded by the Cyprus Research
Promotion Foundation, grand NEKYP/0311/02
REFERENCES
Adams K., et al, 2015, Non-functional Requirements in
Systems Analysis and Design.in Topics in Safety, Risk,
reliability and Quality, Springer.
0%
10%
20%
30%
40%
50%
60%
70%
80%
90%
General
Features
User
Interface
Learning Capabilities Usefulness Ease of Use Situation
Awareness
Percentage of Users scoring positively (>4)
Radar Arrows
ICEIS 2016 - 18th International Conference on Enterprise Information Systems
462

Chung, L., Nixon, B. A., Yu, E. and J. Mylopoulos, 2000.
Non-functional requirement in Software Engineering,
Kluwer Academic Publishing.
Davenne D., Lericollais R., Sagaspe P., Taillard J., Gauthier
A., Espié S., Philip P. 2012. Reliability of simulator
driving tool for evaluation of sleepiness, fatigue and
driving performance, Accident Analysis and
Prevention, 45, pp.677-682.
Dingus, T. A., Klauer, S. G., Neale, V. L., Petersen, A., Lee,
S. E., Sudweeks, J., et al. 2006. The 100-car naturalistic
driving study: Phase II – Results of the 100-car field
experiment. Washington, DC: National Highway
Traffic Safety Administration.
Endlsey M. R 2012. Designing for Situation Awareness: An
Approach to User-Centered Design, Second Edition,
CRS press.
Fuller R. and Santos J. 2002. Human Factors for Highway
Engineers. New York: Pergamon.
Gregoriades. A and Sutcliffe. A. 2007. Workload prediction
for improved design and reliability of complex systems.
Reliability. Eng. System Safety, 39, n.4, pp.530–549.
Gregoriades A, Sutcliffe A, Papageorgiou G, Louvieris P.
2010 Human-Centred Safety Analysis of Prospective
Road Designs, IEEE Transactions on Systems, Man and
Cybernetics, Part A, Vol 40, 2, pp 236-250.
Gregoriades A., Sutcliffe A. S., 2005. Scenario-based
assessment of non-functional requirements, IEEE
Transactions on Software Engineering, , Vol 31, 5, pp
392-409.
Hevner, A. & Chatterjee, S 2010. Design Research in
Information Systems, Integrated Series in Information
Systems, vol 22, Springer.
Holohan, C., Culler, R., & Wilcox, B. 1978. Effects of
visual distraction on reaction time in a simulated traffic
environment, Human Factors, 20, pp.409–413.
Illa, X. B., Franch, X, & Pastor, J.A. 2000. Formalising
ERP selection criteria. In Proceedings of the 10th
international workshop on software specification and
design (IWSSD’00), California, pp. 115–123.
Konstantopoulos P., Chapman P., Crundall D. 2010.
Driver’s visual attention as a function of driving
experience and visibility. Using a driving simulator to
explore drivers’ eye movements in day, night and rain
driving, Accident Analysis and Prevention, 42, pp.827-
834.
Marew, T. et al. 2009. Tactics based approach for
integrating non-functional requirements in object-
oriented analysis and design Syst. Software, 82, pp.
1642–1656.
Matoussi, A., and Laleau, R. 2008. A Survey of Non-
Functional Requirements in Software Development
Process, Report No. TR-LACL-2008-7, Departement
d’Informatique Universite Paris 12, 2008.
Montella A., Ariab M., D’Ambrosiob A., Galantea F.,
Maurielloa F., Pernettic M. 2011. Simulator evaluation
of drivers’ speed, deceleration and lateral position at
rural intersections in relation to different perceptual
cues, Accident Analysis and Prevention, 43, pp.2072-
2084.
Nwokeji J., et al, 2014. ER 2014- International Workshp on
Conceptual Modeling in Requirements and Business
Analysis (MREBA), USA.
Peng, Y. G. Wang, H. Wang, 2012. User preferences based
software defect detection algorithms selection using
MCDM, Information Sciences 191. 3–13.
Reason, J., A. Manstead, S. Stradling, J. Baxter, K.
Campbell. 2005. Errors and violations on the roads: a
real distinction, Ergonomics, 33 (10–11) (1990), pp.
1315–1332.
Stone, R. J. 2001. Virtual Reality for Interactive Training:
An Industrial Practitioners Viewpoint, International
Journal of Human-Computer Studies, vol. 55, pp. 699-
711.
Sadana V., Liu X., 2007. Analysis of conflicts among non-
functional requirements using integrated analysis of
functional and non-functional requirements, Computer
Software and Applications Conference, COMPSAC.
Zayaraz G, Thambidurai P., Srinivasan M., Rodrigues P..
2005. Software quality assurance through COSMIC
FFP ACM SIGSOFT Software Engineering Notes, 30
(5).
Marew, T. et al.2009. Tactics based approach for
integrating on-functional requirements in object-
oriented analysis and design Syst. Software, 82, pp.
1642–1656.
Zhu M., Luo X., Chen X., Dash W.,2012. A non-functional
requirements tradeoff model in Trustworthy Software,
Information Sciences, Volume 191, 15, pp 61-75.
Sutcliffe, A. and Gault, B. 2004, The ISRE method for
analyzing system requirements with virtual prototypes.
Syst. Engin., 7: 123–143.
Theeuwes J. et al, 2012, Designing Safe Road Systems: A
Human Factors Perspective, Ashgate.
Validating Sociotechnical Systems’ Requirements through Immersion
463
