
Design of Customised Orthodontic Devices by Digital Imaging and
CAD/FEM Modelling
Sandro Barone, Alessandro Paoli, Armando Viviano Razionale and Roberto Savignano
Department of Civil and Industrial Engineering, University of Pisa, Largo Lucio Lazzarino 1, 56126, Pisa, Italy
Keywords: Orthodontic Aligner, Finite Element Model, Aligner Thickness.
Abstract: In recent years, the public demand of less invasive orthodontic treatments has led to the development of
appliances that are smaller, lower profile and more transparent with respect to conventional brackets and
wires. Among aesthetic appliances, removable thermoplastic aligners gained instant appeal to patients since
able to perform comprehensive orthodontic treatments without sacrificing comfort issues. The aligner must
deliver an appropriate force in order to move the tooth into the expected position. However, at present, the
relationship between applied force and aligner properties (i.e., aligner’s thickness) is poorly understood. In
this paper, a patient-specific framework has been developed to simulate orthodontic tooth movements by
using aligners. In particular, a finite element model has been created in order to optimise the aligner’s
thickness with regard to the magnitude of the force-moment system delivered to a mandibular central incisor
during bucco-lingual tipping.
1 INTRODUCTION
Orthodontic treatments are performed to achieve the
correct occlusion with the best functional and
aesthetic features. The correction of irregular bites is
obtained by applying mechanical actions that move
teeth into their proper position within the dental
arches. The growing interest for adult orthodontic
corrections has accelerated the use of aesthetic
alternatives to conventional fixed devices. For this
reason, the use of transparent tooth correction
systems is becoming common for minimally
invasive treatments. In particular, treatments based
on clear removable thermoplastic appliances
(aligners) are increasingly used (Boyd, 2008).
This system consists of a set of thermoformed
templates, made of transparent thermoplastic
material, which are sequentially worn by the patient.
The orthodontic three-dimensional force-moment
system on each tooth is generated by a pre-
determined geometrical mismatch between the
aligner shape and the dentition geometry. This
condition is determined by using virtual 3D models
of the patient’s dentition and computer-aided design
(CAD) methodologies (Beers et al., 2003). Each
single template, which corresponds to the new
required tooth placement, is programmed to perform
only a small part of the complete tooth movement.
Therefore, a full treatment consists of a set of
templates with varying shapes from the initial
anatomical geometry to the target tooth position.
The possibility to simulate and identify appropriate
moment-to-force ratios is a key issue in order to
predict and control tooth movements. At this
purpose, the Finite Element Analysis (FEA) is one
of the most used tools to evaluate the effectiveness
of dental devices and has been widely used in
dentistry since the 70’s (Farah et al., 1973).
In this paper a patient-specific framework has
been developed in order to make feasible a
customized simulation of orthodontic tooth
movements by using thermoplastic aligners. A Finite
Element (FE) model is created to design optimised
appliances leading to more efficient orthodontic
treatments. Even if the use of aligners is becoming
an effective solution to treat malocclusion conditions
(Boyd, 2008), few attempts have been made to
develop FE models describing the aligner’s
behaviour in delivering forces (Cai et al., 2015,
Gomez et al., 2015).
Tooth movements with aligners may be more
complex with respect to fixed appliances since there
is no specific point of force application. Many
parameters are certainly involved in determining the
clinical outcome: tooth anatomy, aligner’s material
properties, amount of mismatch between aligner and
dentition geometries, slipping motions between
44
Barone, S., Paoli, A., Razionale, A. and Savignano, R.
Design of Customised Orthodontic Devices by Digital Imaging and CAD/FEM Modelling.
DOI: 10.5220/0005821000440052
In Proceedings of the 9th International Joint Conference on Biomedical Engineering Systems and Technologies (BIOSTEC 2016) - Volume 2: BIOIMAGING, pages 44-52
ISBN: 978-989-758-170-0
Copyright
c
2016 by SCITEPRESS – Science and Technology Publications, Lda. All rights reserved
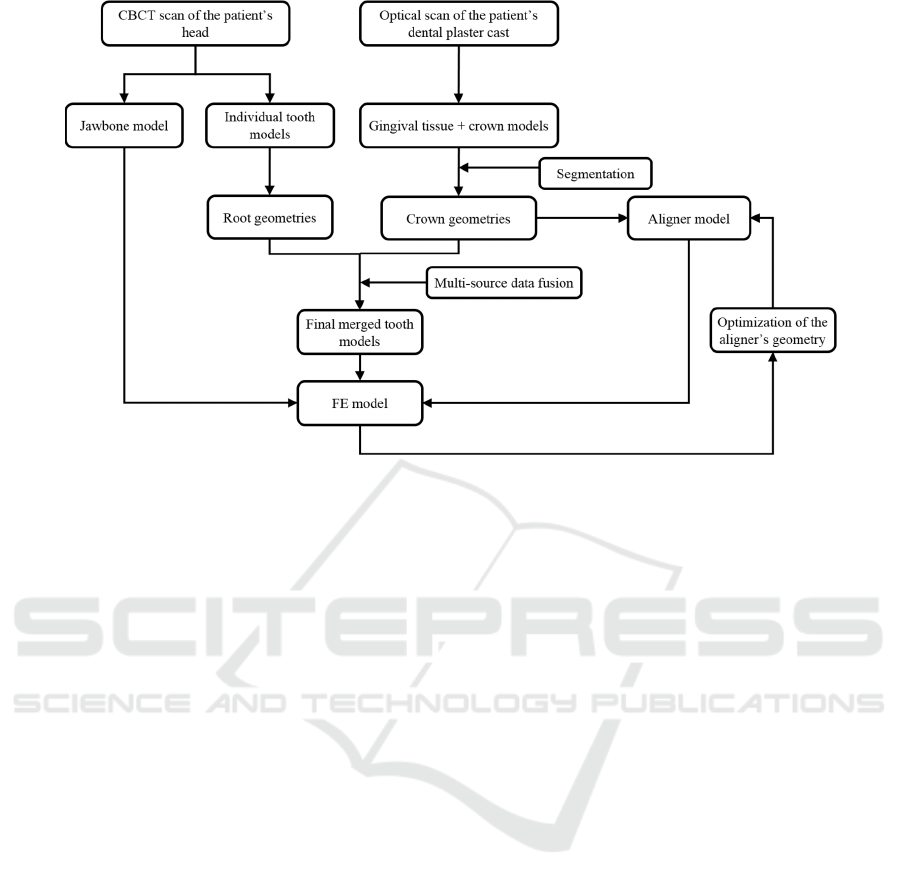
Figure 1: Overall workflow.
contact shapes. In particular, the aligner’s thickness
has demonstrated to have a great influence on the
magnitude of the force produced by the appliance
(Hahn et al., 2009, Kwon et al., 2008). In this work,
the authors have used the developed FE model to
study the influence of non-uniform aligner’s
thickness on the amount and quality of the force
system delivered to a central incisor during tipping.
2 MATERIALS AND METHODS
The patient anatomical geometries as well as the
aligner shape have been reconstructed by computer-
aided scanning and digital imaging techniques.
In particular, multi-source data are used to obtain
tooth anatomies including crown and root shapes.
Ideal tooth movements can be achieved through
orthodontic appliances that are designed by taking
into account not only tooth crowns but also root
geometrical features. For this reason, in this work,
accurate crown geometries, obtained from high-
precision optically scanned data, are merged with
approximate representations of root geometries
which are derived from a raw and fast segmentation
of Cone Beam Computed Tomography (CBCT)
data.
The aligner geometry has then been modelled by
exploiting CAD tools in order to create a layer,
which closely mates the tooth crown surfaces except
for the area corresponding to the tooth to be moved.
In this region, a penetration between crown and
aligner surfaces is introduced to generate the loading
condition. In particular, in this work, the influence of
both thickness and shape of the aligner has been
investigated in order to optimize the effectiveness of
the orthodontic treatment and reduce the patient
discomfort. Figure 1 summarizes the overall
framework.
2.1 Creation of the Patient Anatomical
Model
The patient’s anatomical model, composed of
alveolar bone, teeth and periodontal ligament (PDL),
is obtained by exploiting information derived from a
CBCT patient’s scan and an optical scan of the
relative dental plaster cast. The CBCT scan is used
to obtain complete geometries of each individual
tooth along with its relative spatial arrangement
within the jawbone. An optical scanner, based on a
coded structured light approach, has been used to
acquire the plaster model created from the patient’s
mouth impression. The aim of the optical scanning
procedure is to reconstruct an accurate digital model
composed of tooth crowns.
CBCT volumetric data are used to reconstruct
the jawbone structure as well as the complete and
individual tooth geometries. A CBCT scan yields a
stack of slices corresponding to cross-sections
through a maxillofacial volumetric region. CBCT
data are stored in a sequence of Digital Imaging and
Communications in Medicine (DICOM) images. An
imaging slice is a 2D matrix of grey intensity values
Design of Customised Orthodontic Devices by Digital Imaging and CAD/FEM Modelling
45
representing the x-ray attenuation of different
anatomical tissues.
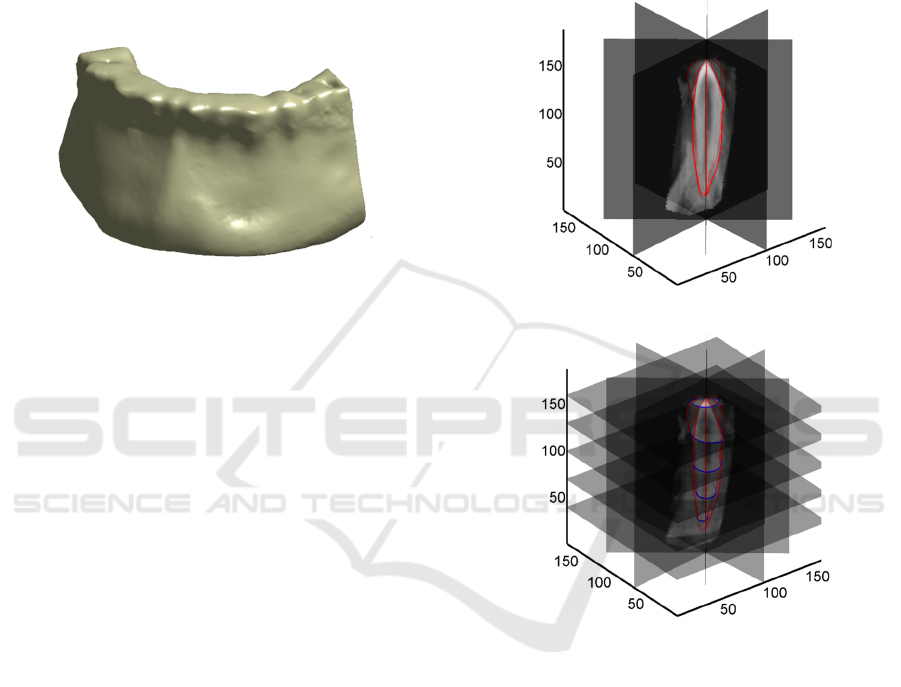
The three-dimensional model of the jawbone has
been obtained by exploiting tools provided by an
open-source software for medical image analysis
(3DSlicer, 2014). A triangular mesh of the
isosurface representing the bone shape (Figure 2)
has been obtained by segmenting the volumetric
CBCT data set with a specific grey intensity value
(isovalue).
Figure 2: Jawbone geometry used in the FE model.
2.1.1 Complete Tooth Geometries by CBCT
Scanning
The reconstruction of the individual tooth anatomies
is not so straightforward because tooth root regions
cannot be easily separated from surrounding bone
tissue by only considering pixel’s grey-intensity
values. Most of the existing techniques are based on
slice-by-slice segmentation procedures, which
involve the digital processing of hundreds of slices
in order to reconstruct three-dimensional geometries,
thus resulting in time-consuming procedures. In this
paper, DICOM images are processed by adopting
the methodology introduced in (Barone et al., 2015).
This method, is based on processing a small number
(four) of multi-planar reformation images, which are
obtained for each tooth on the basis of anatomy-
driven considerations. The reformation images
greatly enhance the clearness of the target tooth
contours, which are then extracted and used to
automatically model the overall 3D tooth shape
through a B-spline representation.
Practically, four reference planar sections are
automatically extracted as passing from the tooth
axis and oriented along the buccolingual direction,
the mesiodistal direction and the two directions
disposed at 45° with respect to these two meaningful
clinical views. These reference sections are used to
outline the tooth by interactively tracing four
different 2D tooth contours (C
i
) as shown in Figure
3-a. The four contours are used to automatically
extract a B-spline curve. Each slice perpendicular to
the tooth axis (transverse slice) intersect the C
i
contours in eight points that are used as control
points to compute a parametric B-spline curve of
degree 2 (Figure 3-b). For each slice, 100 points are
evaluated on the B-spline curve in order to obtain a
point cloud representing the overall tooth shape. For
further details the reader can refer to (Barone et al.,
2015).
(a)
(b)
Figure 3: a) Four reference planar sections along with the
2D tooth contours, b) B-spline curves computed for the
transverse slices.
Figure 4-a shows the point clouds relative to the
incisors, canine and premolar teeth of the inferior
arch used in the present work. Figure 4–b shows the
respective StL models obtained by a tessellation of
the respective point clouds.
The greatest benefit of this methodology consists
in providing reliable approximations of individual
tooth roots, by interactively contouring a few
significant images created from the whole CBCT
data set.
The processing time is greatly reduced with
respect to standard cumbersome slice-by-slice
methods usually proposed within medical imaging
BIOIMAGING 2016 - 3rd International Conference on Bioimaging
46
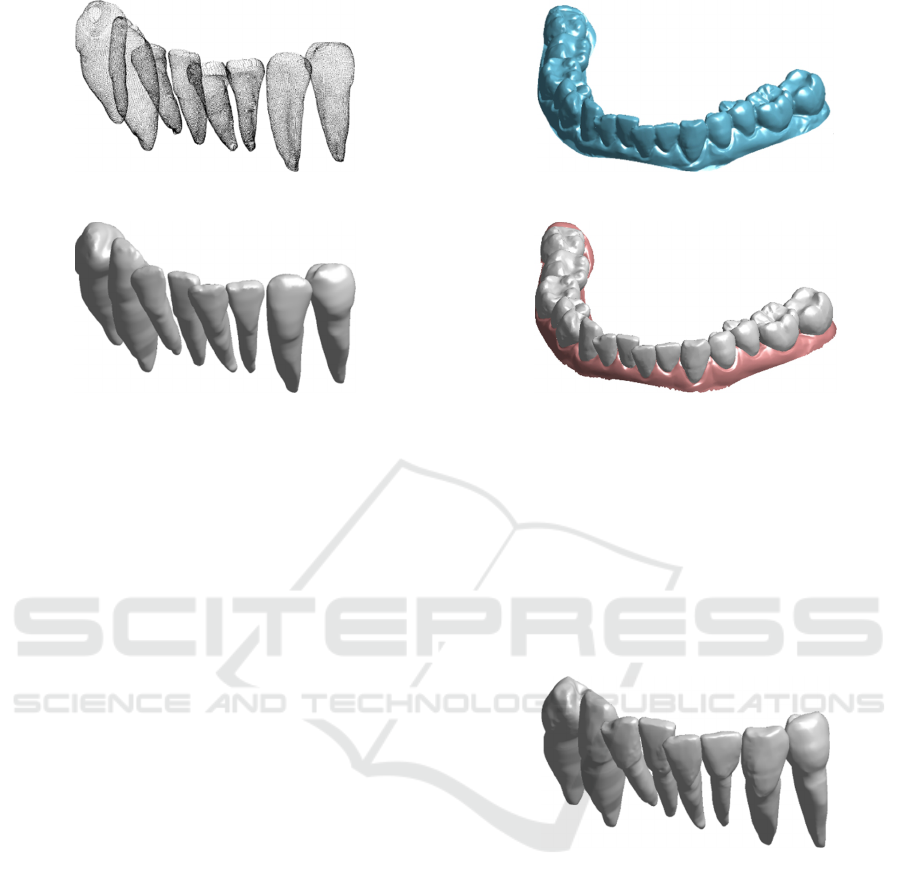
(a)
(b)
Figure 4: Incisor, canine and premolar tooth models of an
inferior arch as obtained by segmenting CBCT data. (a)
Point clouds, (b) StL models.
software. However, the accuracies obtained for
crown geometries, especially for multi-cusped
shapes, cannot be considered adequate to simulate
orthodontic treatments based on the use of
customized appliances.
2.1.2 Crown Geometries by Optical
Scanning
In this work, an optical scanner, based on a coded
structured light approach, has been used to acquire
the patient’s plaster model. An accurate digital
mouth reconstruction composed of both crown
shapes and gingival tissue is then obtained as shown
in Figure 5-a. The overall surface is then segmented
into disconnected regions, representing the
individual crown geometries and the gingiva (Figure
5-b) through a semi-automated procedure, which
exploits the curvature of the digital mouth model.
2.1.3 Multi-Source Data Fusion
For each tooth, the multi-source data obtained by
using optical and tomographic scanning must be
merged in order to create accurate multibody dental
models. The crown surfaces obtained by optical
scanning are aligned with the corresponding crown
geometries segmented from the CBCT data set.
The meshes from the two sets of data are
coarsely aligned into a common reference frame by
manually selecting at least three common points. A
refinement of the initial alignment is then
(a)
(b)
Figure 5: (a) Digital mouth model as obtained by using the
structured light scanner and (b) individual tooth crowns
and gingival geometries as obtained by segmenting the
model.
performed by a fine registration procedure based on
the Iterative Closest Point (ICP) technique. The
crown geometries obtained by processing DICOM
images are then removed by means of a disk vertex
selection algorithm.
Figure 6: Final merged tooth geometries (optical crowns +
CBCT roots) used in the FE model.
Each vertex of the optic crown is projected into a
point on the CBCT mesh. This point describes the
center of a sphere, which is used to select the points
of the CBCT mesh to remove. The final tooth
models (Figure 6) are then obtained by a Poisson
surface reconstruction approach (Kazhdan et al.,
2006). This allows for fully closed models
composed of the most accurate representation for
tooth crowns.
2.1.4 PDL Modelling
PDL geometries cannot be easily visualized and
reconstructed since usually the slice thickness is
Design of Customised Orthodontic Devices by Digital Imaging and CAD/FEM Modelling
47
similar or even greater than the ligament space
(about 0.2 mm) (Dorow et al., 2003). For this
reason, in this work the PDL has been modelled for
each tooth by detecting the interface area between
bone and tooth models to which a 0.2 mm thick shell
has been added. The volume shell is then subtracted
from the alveolar bone in order to define the PDL
volume (Liu et al., 2013). The obtained PDL solid
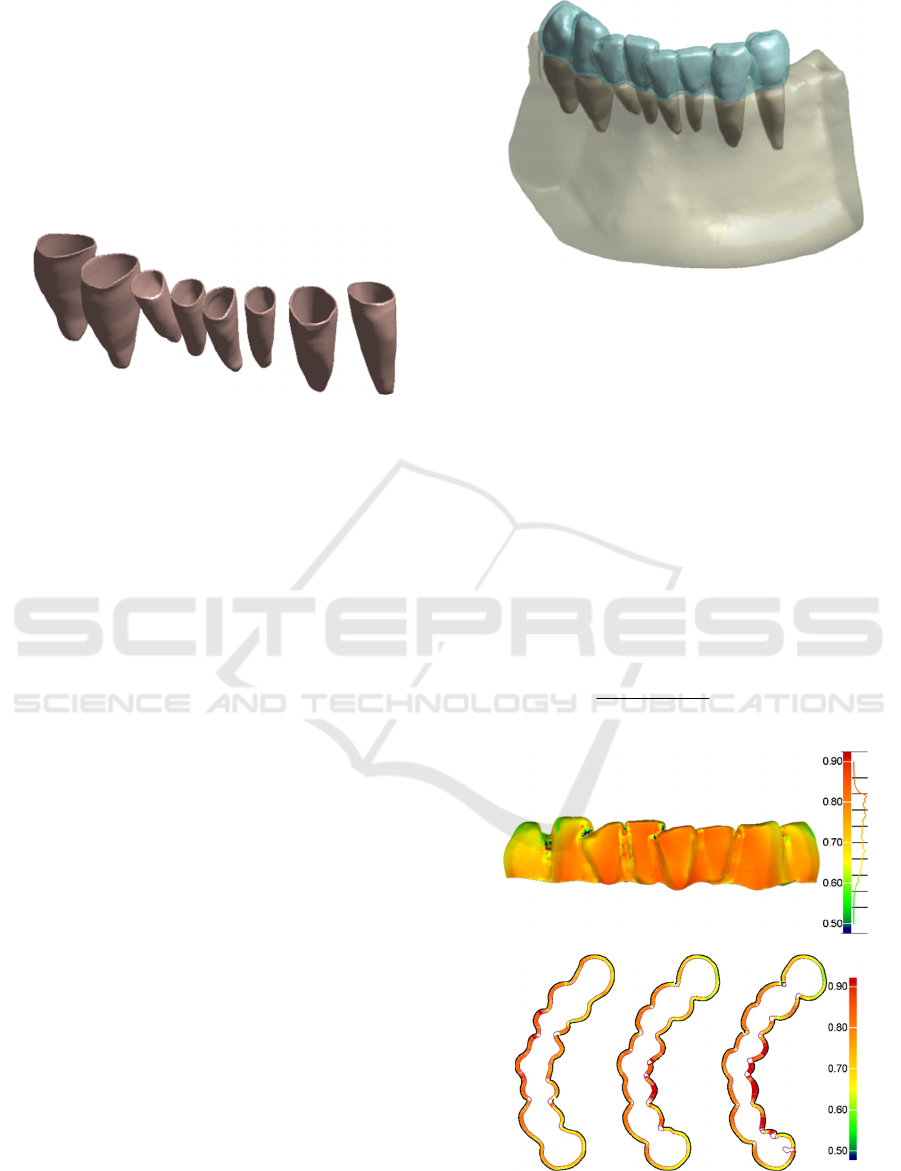
models are shown in Figure 7.
Figure 7: PDL geometries used in the FE model.
2.1.5 Orthodontic Aligner Modelling
Process
The aligner geometry has been created by defining a
layer completely congruent with the tooth crown
surface. The individual teeth are firstly joined, root
geometries are deleted and undercut volumes
manually removed in order to create a unique layer.
The layer is thickened to create a 0.5 mm thick
volume. Finally, the merged tooth geometries
(shown in Figure 6) are subtracted from the volume
and the most external surface of the remaining
geometry is removed with the aim at modelling the
inner shape of the aligner. This procedure is carried
out to guarantee an optimal fit between the mating
surfaces of the tooth crowns and the appliance
(Barone et al., 2014). The aligner is supposed to
have a uniform 0.7 mm thickness which originates
from the mean thickness of the thermoplastic
material disk (0.75 mm thick) before the
thermoforming process (Ryokawa et al., 2006). For
this reason, a shell has been created by thickening
the inner shape of the aligner by 0.7 mm along the
direction normal to the surface. Figure 8 shows the
overall modelled geometries used to create the FE
model.
In this work, a further modelling strategy has
been followed to test the influence of non-uniform
aligner thickness values on the effectiveness of the
orthodontic treatment. The idea is based on varying
the appliance geometry by thickening the appliance
in correspondence of highly deformed regions while
thinning the model in correspondence of low
deformed regions. This would allow to optimize the
forces delivered to any tooth in the arch.
Figure 8: Overall geometries used to create the FE model.
In particular the aligner displacement values
have been used to pinpoint adjust the aligner’s
thickness. The procedure can be schematized as
follows:
1. Evaluation of the displacement value (d) for
each FE mesh node of the inner surface of the
0.7 mm thick aligner;
2. Determination, for each node, of the normal
direction with respect to the surface. The mean
of the normal unit vectors of the triangles
having that node as vertex is used;
3. Computation, for each node, of a new point
along the normal direction having distance t
from the node linearly defined as:
min
min max min
max min
( )
( )
d d
t s s s
d d
(1)
(a)
(b)
Figure 9: a) Full-field map of the aligner thickness values
(expressed in mm) and three cross sections (b).
BIOIMAGING 2016 - 3rd International Conference on Bioimaging
48
where s
min
and s
max
are, respectively, the
minimum and maximum values which define the
aligner’s thickness range, while d
min
and d
max
respectively represent the minimum and maximum
displacement values computed for the 0.7 mm thick
aligner. The thickness range has been defined
between 0.5 mm and 0.9 mm. Figure 9 shows a full-
field map of the aligner thickness values (Figure 9-a)
and three different cross sections (Figure 9-b).
2.2 Generation of the FE Model
The different bodies were imported in Ansys
®
14.
Each body was modeled with solid 10 nodes
tetrahedrons. The approximate number of elements
and nodes for each simulation was 134000 and
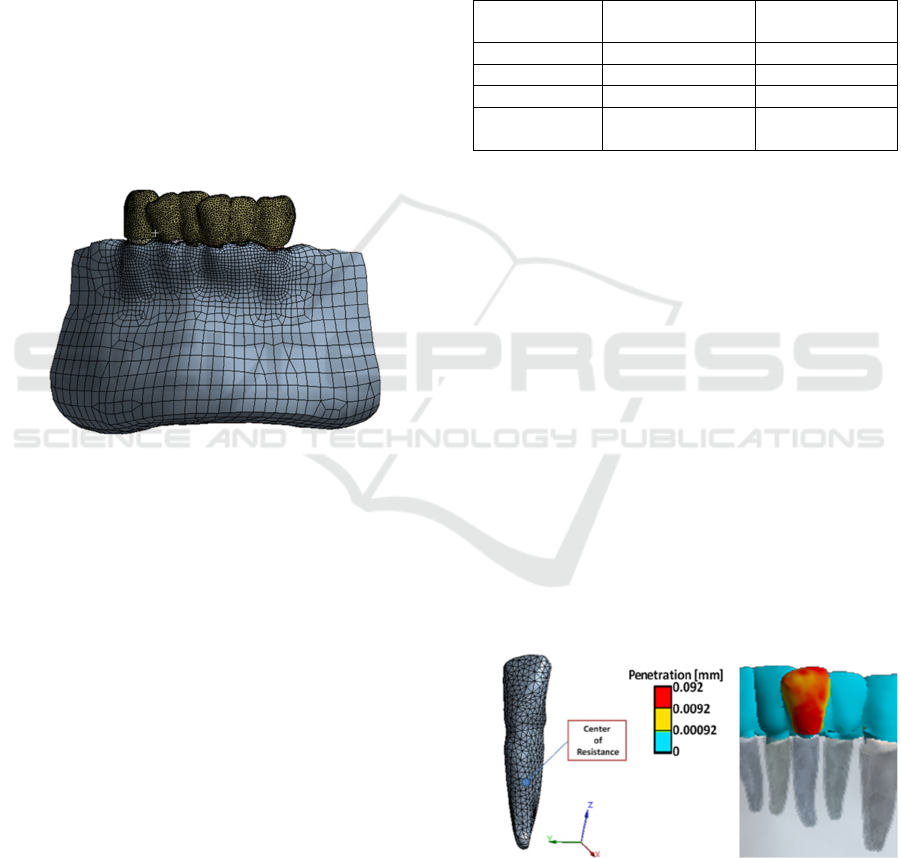
226000 respectively. Figure 10 shows the meshed
models for the simulation performed with a uniform
0.7 mm thick aligner.
Figure 10: Meshed model used for the simulation with 0.7
mm uniform thick aligner.
2.2.1 Material Properties
A linear elastic mechanical model was assigned to
each body as shown in Table 1. Moreover, teeth and
bone were supposed as made by a homogenous
material, without discerning in enamel, pulp, dentin
for the teeth and cortical and cancellous for the
bone. This simplification does not affect the
simulation results as shown in previous studies
(Penedo et al., 2010). In technical literature, many
are the biomechanical models that simulate the tooth
ligament properties (Fill et al., 2012). The
investigation of the ligament in-vivo behavior is not
a trivial task due to its small size (about 0.2 mm
thickness). For this reason, most of the scientific
literature has investigated the mechanical properties
of the PDL through experimental analyses, thus
developing five different models: linear elastic,
bilinear elastic, viscoelastic, hyperelastic and
multiphase (Fill et al., 2012). However, the complex
non-linear response of the PDL does not need to be
addressed while performing an analysis about the
first phase of the orthodontic reaction as in the
present study (Cattaneo et al., 2005).
The thermoplastic aligners are usually made
from a polyethylene terephthalate glycol-modified
(PETG) disc, whose mechanical properties can be
retrieved from the manufacturer's datasheet. Its
mechanical behavior has been approximated as
linear elastic.
Table 1: Material properties used for the FE analyses.
Young Modulus
[MPa]
Poisson's ratio
Bone
13000 0.3
Teeth
20000 0.3
PDL
0.059 0.49
Aligner
(PETG)
2050 0.3
2.2.2 Loading and Boundary Conditions
A bucco-lingual tipping of a mandibular central
incisor was simulated. The initial load configuration
for the FE analysis was generated by the penetration
between the aligner and the target tooth. The initial
models do not present any penetration between teeth
and aligner since the aligner is modelled onto the
teeth surfaces. The tooth must be rotated around the
Center of Resistance in order to create the initial
penetration. The coordinates of tooth Center of
Resistance were determined by using the method
proposed by (Viecilli et al., 2013). The reference
axes were defined accordingly to the occlusal plane.
The z-axis was perpendicular to the occlusal plane,
while the y and x-axis were parallel to the occlusal
plane and congruent respectively with the
mesiodistal and bucco-lingual tooth directions
(Figure 11-a). Finally, the tooth is rotated around its
C.Res. along the y-axis.
(a) (b)
Figure 11: Target tooth's Center of Resistance (a) and
initial penetration between teeth and aligner (b).
Design of Customised Orthodontic Devices by Digital Imaging and CAD/FEM Modelling
49
The resultant initial penetration turned out to be
about 0.09 mm as shown in Figure 11-b. The bone
extremities were fixed in all directions. An
augmented Lagrangian formulation was used to
simulate contact. Bonded contact surfaces were
considered between bone and PDL and between
PDL and teeth. Corresponding nodes cannot separate
each other and a perfect adhesion between contact
surfaces, without mutual sliding or separation, can
be assumed. The aligner-teeth contact was set as
frictionless, with a maximum allowed penetration of
0.01 mm which provided the best accuracy-
computational time ratio. Because of the meshing
process, an undesired initial penetration can occur
between the aligner and the non-target teeth. For this
reason the "adjust to touch" option was used for
those contact couples in order to remove all the
undesired initial penetrations.
2.2.3 Analysis Settings
Different scenarios were simulated to compare the
influence of the aligner's thickness onto the
orthodontic movement:
uniform 0.7 mm thickness;
uniform 0.6 mm thickness;
non-uniform thickness (average value = 0.62
mm) obtained as described in section 2.1.5.
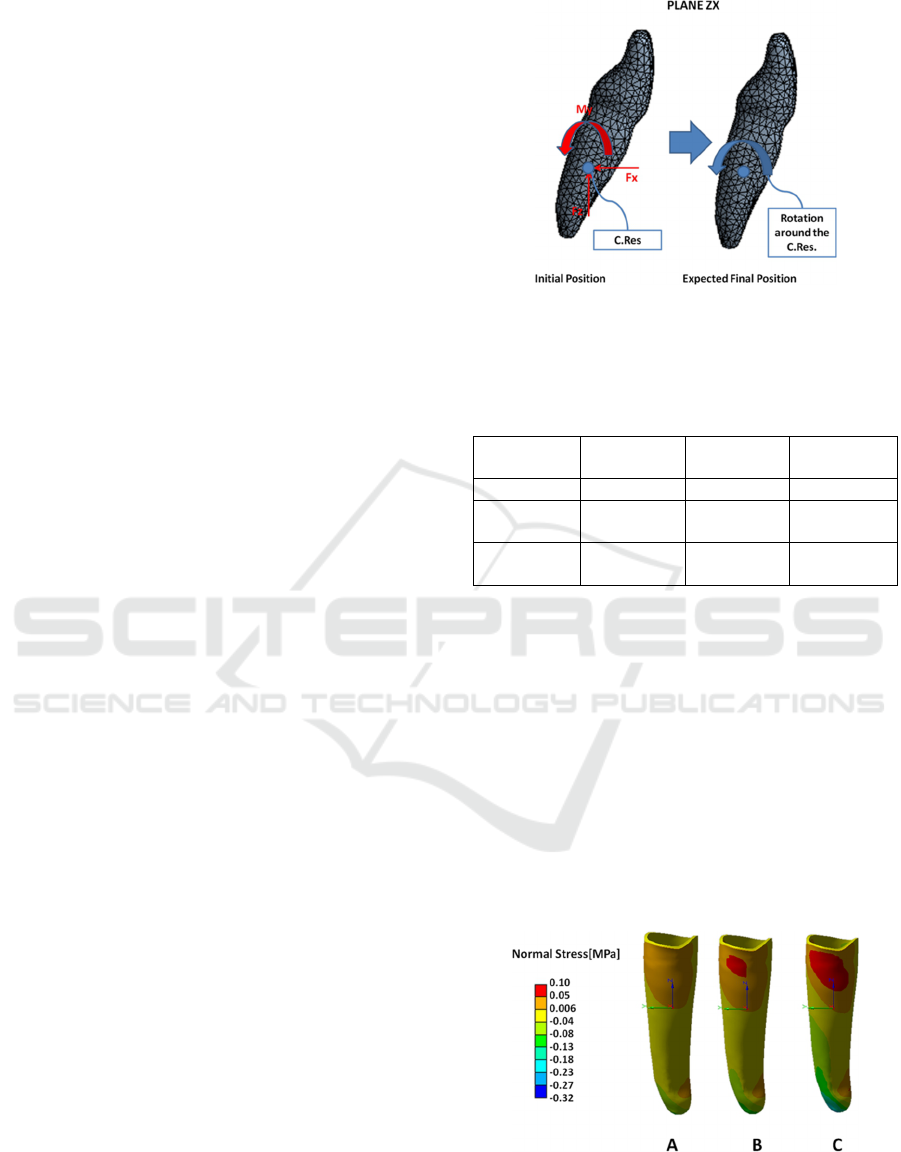
For each simulation, the resulting force-moment
system delivered by the aligner to the target tooth
was calculated at the Center of Resistance (Figure
12). Computational time resulted in about 2 hours
for each simulation, using a Workstation based on
Intel Xeon CPU E3-1245 v3@3.40 GHz and 16 GB
RAM.
3 PRELIMINARY RESULTS
The results obtained for each scenario were analysed
by comparing the moment along y-axis and the
resulting moment-to-force-ratio (M:F) delivered to
the tooth on the plane ZX (Table 2). The M:F values
describe the quality of the force system (Savignano
et al., 2015), while M
y
defines the amount of
orthodontic movement. Moreover, the stress in the
PDL, along the x-axis, and the tooth displacement
were compared (Figure 13). The magnitude of the
PDL stress values directly affects the bone
remodelling process, which is the main responsible
of the orthodontic movement (Penedo et al., 2010).
Figure 12: Initial tooth position and Force System on the
plane of interest (left). Expected final tooth position
(right).
Table 2: Force system delivered to the target tooth for
each scenario on the plane ZX.
Aligner 0.6 mm 0.7 mm
Non-
uniform
M
y
[Nmm]
1.51 2.26 3.96
M
y
/F
x
[mm]
1.81 2.24 2.83
M
y
/F
z
[mm]
-2.96 -3.42 -3.06
The amount of moment delivered to the tooth
increased by 50% from the 0.6 mm to the 0.7 mm
thick aligner. While the non-uniform aligner elicited
a moment 75% higher than the 0.7 mm and 173%
higher than the 0.6 mm. The same trend was
observed also for the stress values in the PDL. All
different scenarios showed a positive stress value on
the higher part of the anterior region and a negative
stress value on the posterior, in agreement with the
expected bucco-lingual movement of the tooth. The
maximum stress value was almost double for the
non-uniform aligner. Figure 14 shows the
displacement occurring on the target tooth for the
different configurations.
Figure 13: PDL stress values along the x-axis of the target
tooth for the different simulations: A) uniform 0.6 mm, B)
uniform 0.7 mm, C) non-uniform thickness.
BIOIMAGING 2016 - 3rd International Conference on Bioimaging
50
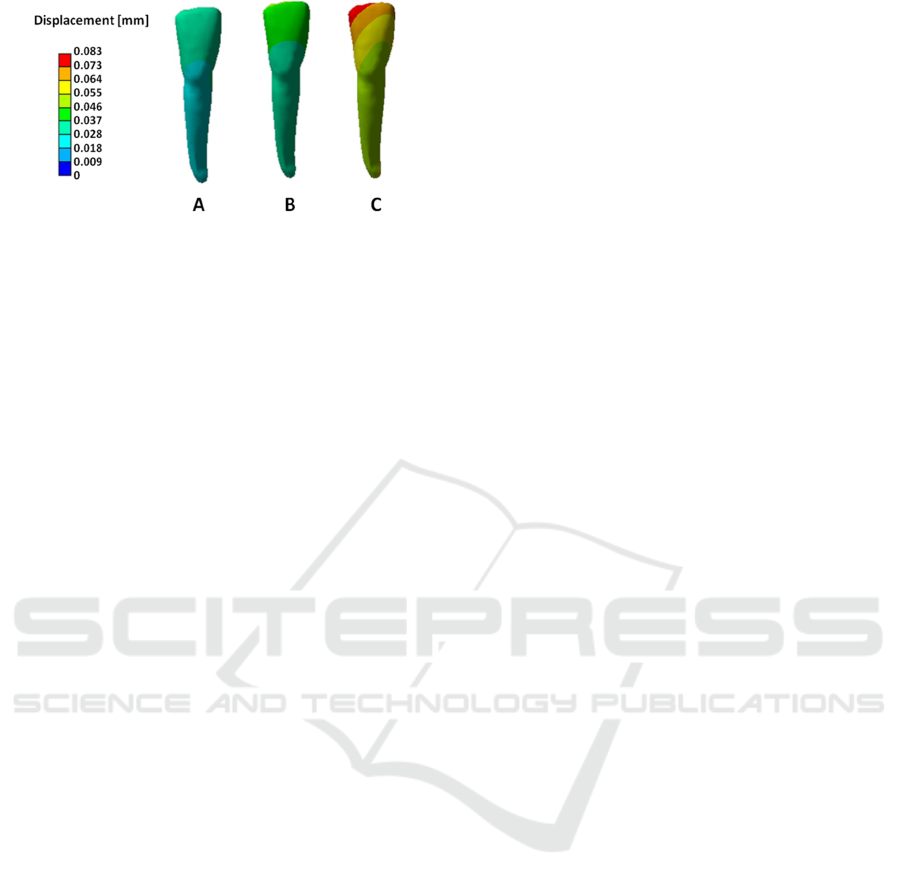
Figure 14: Displacement of the target tooth for the
different simulations: A) uniform 0.6 mm, B) uniform 0.7
mm, C) non-uniform thickness.
4 DISCUSSION AND
CONCLUSIONS
Thermoformed plastic aligners have demonstrated
limitations in exerting complex force systems
(Kravitz et al., 2009). In particular, extrusion of
central incisors and rotation and inclination of
canine and premolar teeth are obtained in clinical
practice by using composite elements as
attachments, bonded to the crowns surface, or divots
and power ridges, which enhance the biomechanical
effectiveness. However, the aligner thickness
represents an additional critical element that should
be optimized since the aligner material itself is the
only element that imparts the force system. Minimal
aligner thickness values would minimize patient
discomfort. However, forces delivered by thick
appliances are higher than those of thin materials
(Hahn et al., 2009).
Typically, aligners are obtained by a vacuum
thermoforming process performed onto 3D physical
moulds of the teeth manufactured by RP
methodologies for each single step of the
orthodontic treatment. A single thermoplastic
polymer resin sheet (about 0.75 mm-thick) is
stretched over each prototyped mould and trimmed
to extract the final configuration. For this reason, a
constant thickness is usually considered for the
aligners.
In this paper, the influence of non-uniform
aligner’s thickness for the tipping of a mandibular
central incisor has been investigated by exploiting
FE analyses. Preliminary results have evidenced a
more effective force system delivered to the central
incisor by pinpoint modulating the aligner thickness
in order to vary its stiffness. The non-uniform
appliance elicited a higher magnitude of the desired
moment M
y
and a better quality of the movement as
attested by the higher values obtained for the M:F
parameter.
These findings clearly call upon some
considerations about the aligner’s manufacturing
process. Currently, the standard production
processes are strictly constrained by the
thermoforming procedures, which provide only
constant thickness aligners. An alternative method
for the direct manufacturing of the aligner should be
used. For instance, milling by CNC machines or
layer-by-layer printing of a single or multiple
polymeric materials, would allow to obtain non-
uniform thin-walled polymeric orthodontic aligners.
Nevertheless, essential aligner’s properties are large
spring-back, high stored energy, tolerance to mouth
hostile environment, biocompatibility and low
surface roughness in correspondence of the mating
surfaces. These features should be taken into high
consideration when considering an alternative
production method. This topic certainly represents a
challenging task which should affect future research
activities.
A further parameter that influences the
effectiveness of the orthodontic treatment, besides
the aligner’s thickness, is represented by the
mechanical properties of the thermoplastic materials.
In the present study, the physical values indicated in
material manufactures datasheets have been used.
However, these values are given under standard
atmospheric conditions. Temperature, humidity, and
forming procedures may have marked effects on the
actual mechanical properties, which may differ
between the intraoral environment and room
temperature (Ryokawa et al., 2006). For this reason,
some experimental tests are currently being carried
out by simulating intraoral environment in order to
characterize the aligner’s mechanical properties in
working conditions.
REFERENCES
3DSlicer. 2014. A multi-platform, free and open-source
software package for visualization and medical image
computing [Online]. Available: http://www.slicer.org/
[Accessed 1 September 2015.
Barone, S., Paoli, A. & Razionale, A. V. 2015. CT
segmentation of dental shapes by anatomy-driven
reformation imaging and B-spline modelling.
International Journal for Numerical Methods in
Biomedical Engineering, in press, doi:
10.1002/cnm.2747.
Barone, S., Paoli, A., Razionale, A. V. & Savignano, R.
2014. Computer aided modelling to simulate the
biomechanical behaviour of customised orthodontic
Design of Customised Orthodontic Devices by Digital Imaging and CAD/FEM Modelling
51

removable appliances. International Journal on
Interactive Design and Manufacturing (IJIDeM), in
press, doi: 10.1007/s12008-014-0246-z.
Beers, A. C., Choi, W. & Pavlovskaia, E. 2003. Computer-
assisted treatment planning and analysis. Orthodontics
and Craniofacial Research, 6, 117-125.
Boyd, R. L. 2008. Esthetic orthodontic treatment using the
invisalign appliance for moderate to complex
malocclusions. Journal of Dental Education, 72, 948-
967.
Cai, Y. Q., Yang, X. X., He, B. W. & Yao, J. 2015. Finite
element method analysis of the periodontal ligament in
mandibular canine movement with transparent tooth
correction treatment. Bmc Oral Health, 15.
Cattaneo, P. M., Dalstra, M. & Melsen, B. 2005. The finite
element method: a tool to study orthodontic tooth
movement. Journal of Dental Research, 84, 428-433.
Dorow, C., Schneider, J. & Sander, F. G. 2003. Finite
Element Simulation of in Vivo Tooth Mobility in
Comparison with Experimental Results. Journal of
Mechanics in Medicine and Biology, 3, 79-94.
Farah, J. W., Craig, R. G. & Sikarski.Dl 1973.
Photoelastic and Finite-Element Stress Analysis of a
Restored Axisymmetric First Molar. Journal of
Biomechanics, 6, 511-520.
Fill, T. S., Toogood, R. W., Major, P. W. & Carey, J. P.
2012. Analytically determined mechanical properties
of, and models for the periodontal ligament: Critical
review of literature. Journal of Biomechanics, 45, 9-
16.
Gomez, J. P., Pena, F. M., Martinez, V., Giraldo, D. C. &
Cardona, C. I. 2015. Initial force systems during
bodily tooth movement with plastic aligners and
composite attachments: A three-dimensional finite
element analysis. Angle Orthodontist, 85, 454-460.
Hahn, W., Dathe, H., Fialka-Fricke, J., Fricke-Zech, S.,
Zapf, A., Kubein-Meesenburg, D. & Sadat-Khonsari,
R. 2009. Influence of thermoplastic appliance
thickness on the magnitude of force delivered to a
maxillary central incisor during tipping. American
Journal of Orthodontics and Dentofacial Orthopedics,
136.
Kazhdan, M., Bolitho, M. & Hoppe, H. 2006. Poisson
surface reconstruction. Proceedings of the fourth
Eurographics symposium on Geometry processing.
Cagliari, Sardinia, Italy: Eurographics Association.
Kravitz, N. D., Kusnoto, B., BeGole, E., Obrez, A. &
Agran, B. 2009. How well does Invisalign work? A
prospective clinical study evaluating the efficacy of
tooth movement with Invisalign. American Journal of
Orthodontics and Dentofacial Orthopedics, 135, 27-
35.
Kwon, J. S., Lee, Y. K., Lim, B. S. & Lim, Y. K. 2008.
Force delivery properties of thermoplastic orthodontic
materials. American Journal of Orthodontics and
Dentofacial Orthopedics, 133, 228-234.
Liu, Y., Ru, N., Chen, J., Liu, S. S.-Y. & Peng, W. 2013.
Finite Element Modeling for Orthodontic
Biomechanical Simulation Based on Reverse
Engineering: A Case Study. Research Journal of
Applied Sciences, Engineering and Technology, 6,
3267-3276.
Penedo, N. D., Elias, C. N., Pacheco, M. C. T. & Gouvêa,
J. P. d. 2010. 3D simulation of orthodontic tooth
movement. Dental Press Journal of Orthodontics, 15,
98-108.
Ryokawa, H., Miyazaki, Y., Fujishima, A., Miyazaki, T.
& Maki, K. 2006. The mechanical properties of dental
thermoplastic materials in a simulated intraoral
environment. Orthodontic Waves, 65, 64-72.
Savignano, R., Viecilli, R., Paoli, A., Razionale, A. V. &
Barone, S. 2015. Nonlinear Dependency of Tooth
Movement on Force System Directions. American
Journal of Orthodontics & Dentofacial Orthopedics,
in press.
Viecilli, R. F., Budiman, A. & Burstone, C. J. 2013. Axes
of resistance for tooth movement: Does the center of
resistance exist in 3-dimensional space? American
Journal of Orthodontics and Dentofacial Orthopedics,
143, 163-172.
BIOIMAGING 2016 - 3rd International Conference on Bioimaging
52
