
Decision Support System for Adoption of Cloud-based Services
Radhika Garg, Marc Heimgartner, Burkhard Stiller
Communication Systems Group CSG@IfI, University of Z
¨
urich UZH, Binzm
¨
uhlstrasse 14, CH-8050 Z
¨
urich, Switzerland
Keywords:
Cloud Computing, Cloud Adoption, Decision Support System, Multi-attribute Decision Algorithms.
Abstract:
Adoption of any new technology in an organization is a crucial decision as it can have its impact at technical,
economical, and organizational level. One of such decisions is related to adoption of Cloud-based services
in an organization. Cloud Computing provides elastic resources as per the demand and provides the facility
to pay as per the use. Thus, it is changing the way IT infrastructure is used today with huge benefit of
cost savings. However, if the solution adopted by an organization is not fulfilling the requirements, it can
have tremendous negative consequences at technical, economical, and organizational level. Therefore, the
decision to adopt Cloud-based services should be based on a methodology that supports a wide array of criteria
for evaluating the available alternatives. Also, as these criteria or factors can be mutually interdependent
and conflicting, a trade-offs-based methodology is needed to make such decisions. This paper, therefore,
discusses the design, implementation, and evaluation of the prototype developed for automating the theoretical
methodology of Trade-offs based Methodology for Adoption of Cloud-based Services (TrAdeCIS) developed
in (Garg and Stiller, 2014). This system is based on Multi-attribute Decision Algorithms (MADA), which
selects the best alternative, based on the priorities of criteria of decision maker. In addition the applicability of
this methodology to the adoption of cloud-based services in an organization is validated with several use-cases
towards the end of the paper. Furthermore, the extendibility of this system to other domains is being evaluated
with respect to Train Operating Companies, who wish to find out the best alternative of providing Internet
connectivity and voice calls on-board trains.
1 INTRODUCTION
Traditional IT (Information Technology) aligns re-
sources according to applications in order to fulfill
their business requirements. Each application has its
own dedicated infrastructure and data storage (Ne-
tApp, 2015). For data protection and continuity of
business operations, dedicated backup and recovery
solutions are also deployed. As an alternative, Cloud
Computing (CC) has recently emerged as a paradigm
that offers its users the flexibility of scaling their com-
puting resource usage without the concern of over
or under-provisioning. CC is the result of evolution
and embracement of various technologies as that of
Virtualization (separating physical devises into one
or more virtual devices), Service-oriented Architec-
ture (based on loosely coupled independent services),
and Utility Computing (which charges the user based
on the usage instead of a fixed rate). The major
benefits of cloud-based services include pay-as-you-
go model, business agility and flexibility, increase in
economies of scale. However, there also exist disad-
vantages in terms of security, privacy risk, or vendor-
lock in (Armburst et al., 2010). CC has four deploy-
ment models (1) Private Cloud, (2) Public Cloud, (3)
Hybrid Cloud, and (4) Community Model (Armburst
et al., 2010). CC today can be delivered as XaaS
(Anything-as-Service), which includes the fundamen-
tal service models of Software-as-a-Service (SaaS),
Platform-as-a-Service (PaaS), and Infrastructure-as-
a-Service (IaaS) and can be extended to anything such
as Network-as-a-Service, Database-as-a-Service, or
Communication-as-a-Service, Business-as-a-Service
(Garg and Stiller, 2014). Owing to several available
options an organization has to decide various follow-
ing aspects:
• Selection of Deployment Model: Each deploy-
ment model has its advantage and disadvantages;
therefore, several factors have to be considered
while making a decision.
• Selection of Service Model: Each service model
consists of various requirements to be fulfilled
both from the side of Cloud Service Provider
(CSP) and the organization that plans to adopt the
solution. For example, in case of PaaS, CSP pro-
Garg, R., Heimgartner, M. and Stiller, B.
Decision Support System for Adoption of Cloud-based Services.
In Proceedings of the 6th International Conference on Cloud Computing and Services Science (CLOSER 2016) - Volume 1, pages 71-82
ISBN: 978-989-758-182-3
Copyright
c
2016 by SCITEPRESS – Science and Technology Publications, Lda. All rights reserved
71

vides both hardware and software on which appli-
cations run, whereas, in IaaS a virtual machine is
provided by CSP. For OS and middleware, orga-
nization is responsible. Therefore, here again the
decision of which service model can be adopted
depends on various requirements.
• Selection of Appropriate Service Package: Also,
there is a variation in terms of capabilities CSP
provider in numerous different packages. These
packages can have different benefits or draw-
backs. For example, some CSPs might offer ser-
vices at low cost, however, they might then not
offer backups or redundant storage of data at mul-
tiple locations. This implies that the factors influ-
encing the decision can be dependent and mutu-
ally contradictory. Therefore, organization has to
make a trade-off and make the selection based on
the best match to its requirement.
Due to this wider range of decisions to be taken
and selections to be made, an automated Decision
Support System with industrial strength will have
to make trade-off decisions, which need to show a
respective detailed evaluation of alternative options.
Thus, the research questions to be answered are the
following:
• How can a quantified trade-off based strategy be
established?
• How can such a strategy evaluate several alterna-
tives with respect to numerous interdependent and
contradictory requirements?
To address this problem of decision making while
adopting Cloud-based services in an organization, the
methodology TrAdeCIS was introduced (Garg and
Stiller, 2014). TrAdeCIS automates the decision pro-
cess and the paper evaluates its applicability and va-
lidity not only in the context of Cloud Computing but
also in the decision of adopting any new technology
in an organization.
The remainder of this paper is structured as fol-
lows. Section 2 discusses related work in the field of
the decision analysis for adopting any technology in
an organization. It also highlights existing gaps and
how TrADeCIS bridges them. Section 3 presents the
architecture and discusses the applicability and rele-
vance of the algorithms used for making such a deci-
sion. Section 4 presents key functionality and tests as
well as evaluates it with respect to several use cases
from the domain of cloud computing. While Section
5 finally discusses the applicability and generalabil-
ity of TrAdeCIS beyond the domain of cloud-based
services, Section 6 concludes the paper.
2 RELATED WORK
Spokesperson of Gartner stated that the customers
should be very careful while selecting the correct ser-
vice provider, and ask them detailed questions about
contractual terms (Moore, 2015). Therefore, the de-
cision maker has to be aware of complete require-
ments, their interdependencies, and conflicts in or-
der to evaluate different CSPs. This part of the work
has been done in (Garg and Stiller, 2015). The sec-
ond challenge is to develop a quantitative approach
to make decision of adopting best alternative that en-
compasses all requirements (criteria) and their inter-
relations. There have been efforts in the past to make
a decision whether to move the legacy infrastructure
into cloud or not. (Armburst et al., 2010) and (Walker,
2009) propose two different approaches. While (Arm-
burst et al., 2010) compares the cost of using a cloud-
based service with the costs of a datacenter on an
hourly basis, (Walker, 2009) presents an approach to
compare the costs of leasing and purchasing a CPU
(Central Processing Unit) over several years. Both of
these approaches only consider cost as a factor, when
there are multiple conflicting factors that must be con-
sidered. Also, this approach is not open to an ex-
tension to multiple quantitative factors (that can have
different measurement units) and to factors that are
of qualitative nature (Menzel et al., 2013). There-
fore, there is a need of methodology that encompasses
multiple factors for evaluating several available alter-
natives. In the past MADAs have been used for the
decision on outsourcing (Wang and Yang, 2007) that
supports multiple factors. MADAs include a finite
set of alternatives, and their performance in multiple
criteria is identified in the beginning of the analysis.
These methods can either be used to sort or classify
the available alternatives. However, the current re-
search is restricted to a number of predefined factors
for taking a decision. Research so far on a cloud adop-
tion decision process also suggests approaches such
as that of Goal-oriented Requirements Engineering
(GRE) ((Beserra et al., 2012), (Zardari and Bahsoon,
2011)) and a quantified method using MADA (Men-
zel et al., 2013), (Saripalli and Pingali, 2011). GRE-
based approaches are based on a step-by-step process
of fulfilling requirements of the cloud user and are
qualitative in nature. MADA based approaches are
quantitative in nature; however, fail to evaluate impact
such an adoption will have on an organization and do
not incorporate business or organizational aspects in
the decision. They also do not consider the influence
of one attribute over another. In addition, they do not
establish a trade-off strategy, where conflicting fac-
tors are involved. A trade-off strategy refers to the
CLOSER 2016 - 6th International Conference on Cloud Computing and Services Science
72
technique of reducing or forgoing one or more desir-
able parameter in exchange of increasing or obtaining
other desirable outcomes in order to maximize the to-
tal return.
As shown in Table 1, gap still exists in research
efforts in terms of not only developing a trade-offs-
based methodology for decision making while adopt-
ing CC, but also in automating it. The comparison of
related work to the work done in this paper is based
on four key features; “
√
” describing the presence and
“×” denoting the lack of that feature.
Table 1: Comparison of Related Work with Respect to Main
Characteristics of Current Work.
Features Cost - MADA- TrAdeCIS
based based
approaches approches
Interrelations
of factors
× ×
√
Trade-offs
based quanti-
fied methodol-
ogy
× ×
√
Automated
decision sup-
port system
× ×
√
Applicability
to other
domains
× ×
√
This paper, therefore, fills this gap by (a) automat-
ing trade-off based quantified methodology, and (b)
studying its applicability for the use-cases for the do-
main of CC, which model all the relevant factors and
their interrelations.
3 RESEARCH METHODOLOGY
AND ARCHITECTURE OF THE
SYSTEM
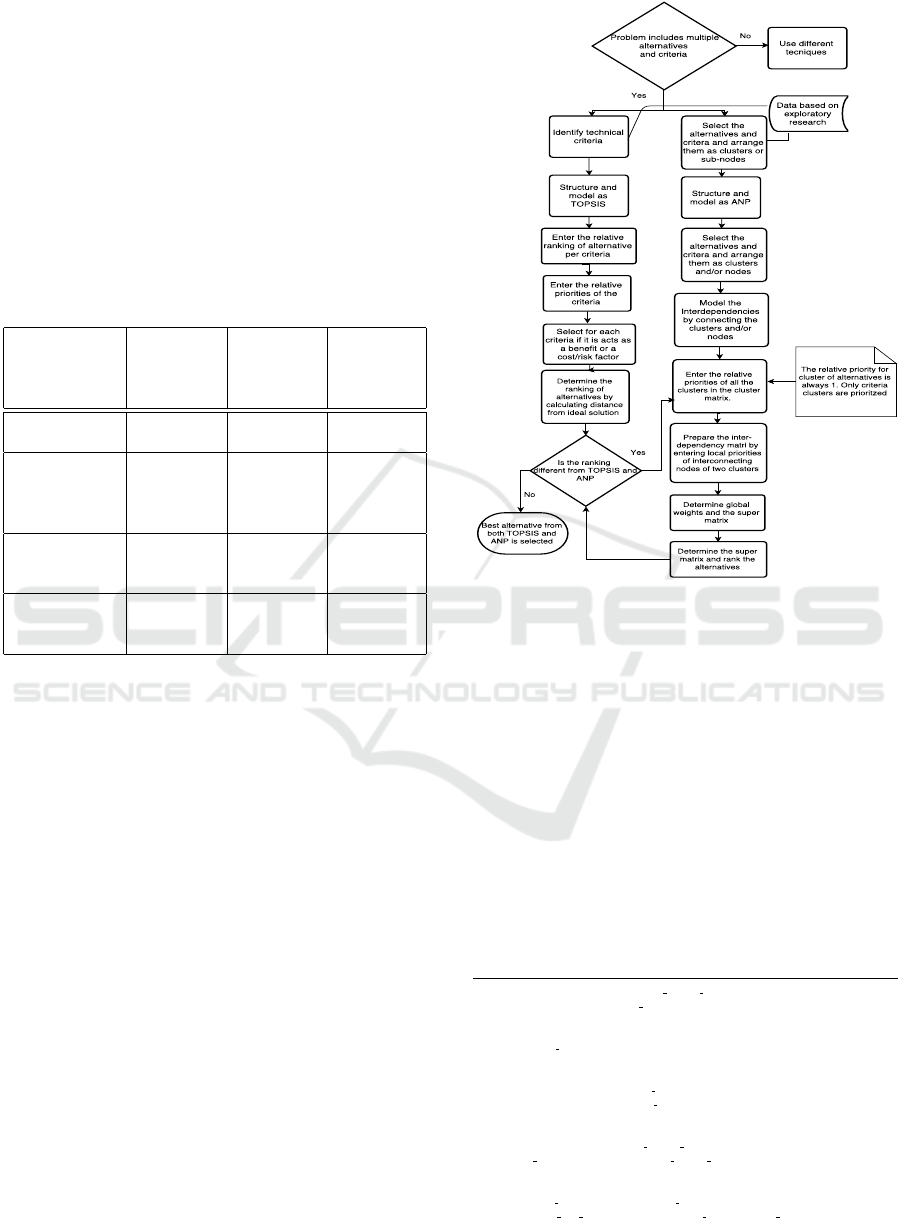
As shown in Figure 1, the methodology followed to
establish trade-offs-based decision of selecting the
best alternative is based on algorithms of MADA-
The Technique for Order of Preference by Similar-
ity to Ideal Solution (TOPSIS) and Analytic Network
Process (ANP). Both of these algorithms require mul-
tiple alternatives and criteria as inputs. TOPSIS is
used to rank the alternatives from the technical per-
spective. ANP is used to rank the same alternatives
from economical and business perspective. The rele-
vant criteria from the domain of CC, has already been
identified in (Garg and Stiller, 2015). The user can
either select the relevant criteria from this list, or en-
Figure 1: Flow Diagram for TraAdeCIS.
ter their own requirements. The details of these algo-
rithms and their implementations are described in the
following sections. Furthermore, the architecture and
the database model of the system developed is also
being discussed below.
3.1 TOPSIS
TOPSIS is based on the concept that the optimal so-
lution is the one, which has geometrically the short-
est distance from the best possible solution and the
longest distance from the worst possible solution
(Ishizaka and Nemery, 2013).
Listing 1: Algorithm for TOPSIS.
def topsis (matrix , weights , has positiv effect ,
normalization = vector normalization ) :
# normalize and apply weights
weighted matrix = normalization (weights) ∗ normalization (matrix )
# extract min and max values for each column
mins = numpy.min(weighted matrix, axis =0)
maxs = numpy.max(weighted matrix, axis=0)
# create ideal and anti ideal arrays
ideal = numpy.where( has positiv effect , maxs, mins)
anti ideal = numpy.where( has positiv effect , mins, maxs)
# calculate distances to the ideal and anti ideal arrays
distance ideal = norm(weighted matrix − ideal , axis=1)
distance anti ideal = norm(weighted matrix − anti ideal , axis =1)
# compute relative closeness
Decision Support System for Adoption of Cloud-based Services
73

relative closeness = distance anti ideal / ( distance ideal +
distance anti ideal )
return relative closeness
Code snippet 1, expects three inputs:
• a NxM matrix of the values with N criteria as
columns and M alternatives as rows.
• weights, N priority values in order to prioritize the
criteria.
• has positiv effect, N true or false values, depend-
ing on the positive or negative impact of the crite-
ria on the decision.
As shown in Listing 1, the first step is to normal-
ize the NxM matrix and weights in order to gain ho-
mogeneous values, which can be mutually compared
(Line 4). From the normalized and weighted matrix
the minimum and maximum values are taken for each
criteria for later use (Line 7, 8). After that the best
possible solution is computed by taking the maximum
value if the criteria has a positive effect on the result or
the minimum value if it has a negative impact on the
result (Line 11). The worst possible solution is con-
structed by taking the minimum value if the impact
is positive and the maximum value if the impact is
negative (Line 12).The next step is to compute the dis-
tance of the matrix to the ideal as well as the anti-ideal
solution. This is done by computing the Euclidean
distance (Line 15, 16). Finally the relative closeness
is computed. Ranking of alternatives is based on the
relative closeness of alternatives to the ideal solution.
Higher the value, higher is the ranking of the alterna-
tive (Line 19).
The complexity of the TOPSIS algorithm, with re-
spect to implementation shown above is O(M ∗N
2
)
where M is the number of alternatives and N the num-
ber of criteria.
3.2 ANP
ANP is generalization of the Analytic Hierarchy Pro-
cess (AHP) (Ishizaka and Nemery, 2013), and is a
method where dependencies can be modeled between
any of the elements. The alternatives and criteria are
modeled as clusters (comprising of 1 or more nodes),
and are connected as a network. Each connection
symbolizes the interdependency between the 2 con-
nected nodes or clusters. On one hand it results in
modeling of more accurate models, but on other hand
it increases the complexity of the required inputa.
In ANP the super matrix has to be constructed
first. As shown in Listing 2, we get the values of the
super matrix, which where previously computed by
the eigenvectors of all the possible pairwise compari-
son matrices. A pairwise comparison matrix, is a ma-
trix where criteria or alternatives are compared with
respect to every other element in the network(see use
cases for an example). This comparison of criteria or
alternatives is dependent on the set interrelations.
Listing 2: Generation of the Supermatrix.
supermatrix : function ( clusterNodes ) {
var children = graph. findChildren ( clusterNodes ) ;
var matrix = utils . matrix( children . length , 0) ;
children .each( function (column, sourceNode) {
children .each( function (row, targetNode) {
matrix[row][column] = graph.getValue (sourceNode, targetNode) || 0;
}) ;
}) ;
return matrix
}
In order to compute the result of ANP the expected
input is the super matrix as well as the number of al-
ternatives. A further constraint is that the alternatives
are always the last n elements of the super matrix,
where n is the number of alternatives . The result is
then constructed by computing the limit matrix, and
transforming it into an array, which gives the rank-
ing of each alternative. In order to compute the limit
matrix, the super matrix has to be raised to high odd
powers until it converges. It can be shown that the
limit exists if the matrix is column stochastic (Saaty
and Vargas, 2006).
Listing 3: Generation of Limitmatrix.
def limit matrix (matrix) :
result = matrix
previous matrix = result
while True:
result = linear normalization (numpy.linalg .matrix power( result , 3) )
if numpy.isnan(numpy.sum(result)):
raise ArithmeticError (’ received not a number’)
if numpy. allclose ( previous matrix , result ) :
break
previous matrix = result
return result
As shown in code snippet 3, the computation of
limit matrix is an iterative process where the matrix
is raised by the power of 3 and then again normalized
in order to keep the matrix column stochastic (Line
7). Then the result is checked if it is equal up to the
8th decimal precision with the previous result (Line
12). If so the process is ended. Usually this takes
around 3 iterations to find a result. The number of
iterations depends on the limit of the super matrix (the
power at which the matrix converges), and therefore
on the values in the super matrix, which consist of the
global cluster comparison, the criteria comparison of
the cluster, and the criteria value.
The reason for raising the super matrix by the
CLOSER 2016 - 6th International Conference on Cloud Computing and Services Science
74
power of 3 is that odd numbers have the advantage
of preserving the structure of the matrix (in matrix
multiplication, depending on where a zero is the other
values might switch places with the zeros). When the
limit is found, the values for the whole row are the
same. The advantage, however, is that if is raised by
an odd number the first column will certainly have
non-zero values.These values denote the ranking of
the alternatives. Another advantage is that by consec-
utively raising the matrix by 3 in the end the matrix
will be raised by 3x, where x is the number of itera-
tions. Higher the value of x lesser iterations will be
needed. The value of 3 is chosen so as to maintain
a balance between the rising complexity of the com-
putation with higher values of x, and the number of
iterations needed to compute the limit matrix.
The complexity of the algorithm is O(n
3
x
) , where
x is the number of iterations and n the dimension of
the super matrix.
3.3 Trade-off based Decision
Once the ranking of alternatives is obtained by using
TOPSIS (from technical perspective) and ANP (from
business-economical and organizational-perspective),
a trade-offs-based strategy is required if the ranking
is different. TrAdeCIS therefore, as shown in Figure
1, compares the ranking and gives the option to the
decision maker to select the best technical solution at
a trade-off of business value. Trade-offs are achieved
by altering the priorities of the criteria. There are es-
sentially three possible dimensions at which priorities
can be adjusted in ANP. (1) At the global cluster level,
prioritizing an entire cluster compared to others. The
alternatives cluster can also be compared as an ex-
ception to other clusters if needed. (2) At the cluster
level, comparing the importance of criteria in a clus-
ter. (3) At the criteria level, changing the values of the
comparison matrix.
3.4 Architecture
The architecture of the system follows the community
standards with Django projects. Django is fullstack
web framework for Python. In Django coherent logic
is bundled in a so-called “app”. TrAdeCIS is built
with two apps: (1) “mcda”, for storing, computing
and visualizing TOPSIS and ANP, and (2) “account”,
to manage the different access levels which TrAdeCIS
provides. The app “mcda” consists of three database
models namely, Decision, TOPSIS and ANP (cf. Fig-
ure 2). Decision model denotes one use-case, which
consists of a name, optional description and the data
for TOPSIS and ANP, which are stored in their re-
spective tables.
Figure 2: Database Interrelations.
4 TESTING AND EVALUATION
The methodology of TrAdeCIS as explained in previ-
ous section has been implemented to provide an au-
tomated decision support system for adopting cloud-
based services. Therefore, this section tests the de-
veloped system with the objective of evaluating its
applicability and usability with various use-cases of
making such decisions. The performance values of
alternatives per criteria are obtained from (Cloud Har-
mony Inc., 2015), which is platform to measure and
monitor performance of cloud-based services. Fi-
nally, scalability of the system with respect to number
of alternatives and criteria is evaluated.
4.1 Use Case 1- Decision of Adopting
IaaS
The first use case is an example of adopting IaaS with
the alternatives under consideration as shown in Ta-
ble 2.
Table 2: Use Case 1 Input for TOPSIS.
Alternatives Availability Scale
Up
Operating
Systems
Amazon
EC2
99.95 0 9
GoGrid 100 1 4
NephoScale 99.95 1 4
OpSource 100 1 4
Rackspace 100 1 8
For TOPSIS the values from Table 2 are used to
compare the different alternatives. All the criteria
are weighted equally and have a positive influence
(benefit) on the result. Availability is the percentage
value that respective alternative mentions in the Ser-
vice Level Agreement (SLA). Factor of Scale Up has
Decision Support System for Adoption of Cloud-based Services
75
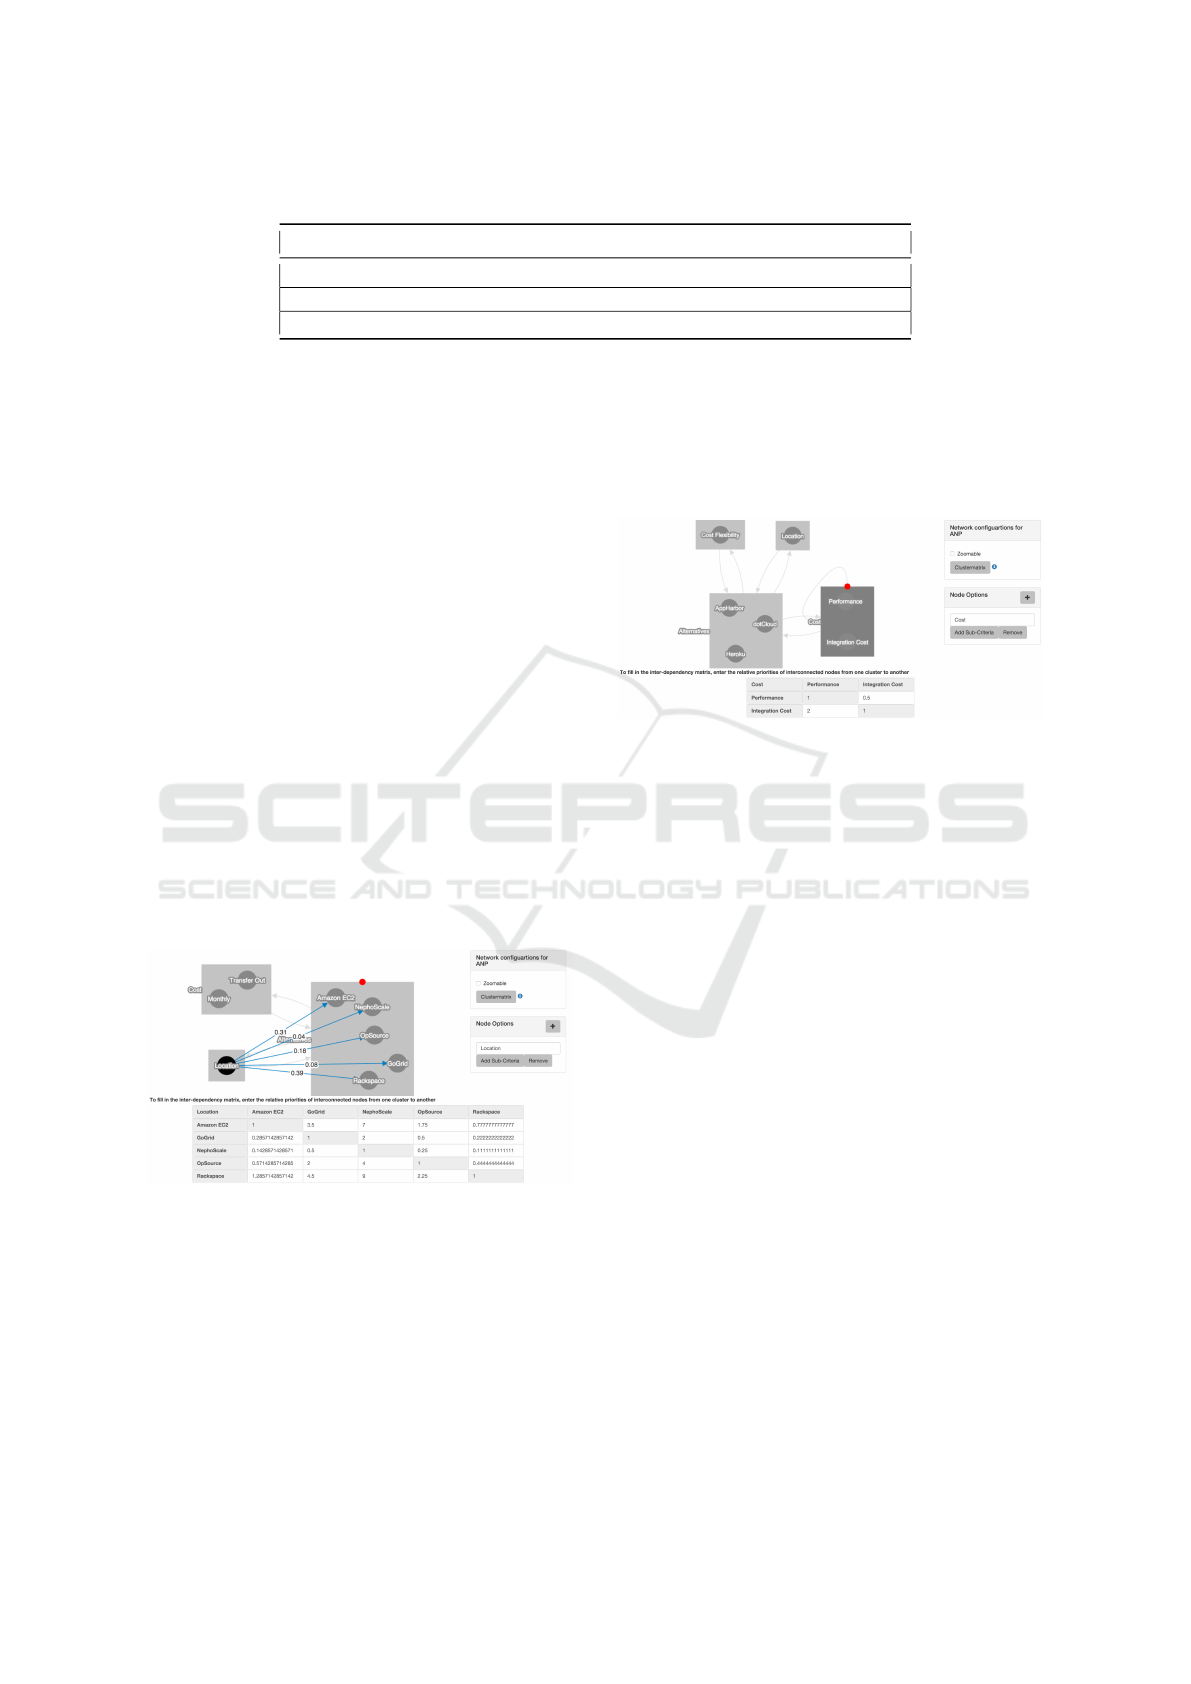
Table 3: Use Case 2 Input for TOPSIS.
Alternatives Uptime RAM (MB) Runtimes Services Add-ons
Heroku 99.91 512 9 2 17
dotcloud 99.95 32 5 1 7
AppHarbor 99.99 512 1 3 33
a boolean value (true or false) denoting if scaling up
of the resource is possible or not. Operating systems
is the number of different OS that are supported (usu-
ally VMs) by the resource. Ranking is then computed
with TOPSIS as shown in code snippet 1, and it re-
sults in Rackspace being ranked the highest.
In order to compare the alternatives from business
perspective (including economical and organizational
factors) the model shown in Figure 8 is constructed.
Here the compared criteria have no interrelations be-
tween each other. Location denotes the number of
places where a server exists. Monthly cost is the total
cost associated for each month for owing the service.
Transfer out is the cost which arise per GB of out-
bound Internet traffic. Therefore, the pairwise com-
parison matrix for, location as shown in Table 4, as
well as for monthly cost as shown in Table 5, and
for transfer out as shown in Table 6 are entered with
respect to their interrelation to the alternatives. Ta-
ble 7 shows the resulting super matrix that is com-
puted from the eigenvectors of the comparison matrix.
Finally the resulting limit matrix is obtained by apply-
ing code snippet 3, which results in Table 8. Since the
result of both algorithms was Rackspace no further
step for calculating a trade-off is necessary.
Figure 3: Use Case 1- ANP Model.
4.2 Use Case 2 Decision of Adopting
PaaS
For second use-case the scenario of adopting PaaS is
evaluated, with alternative providers and criteria as
shown in Table 3. For TOPSIS the criteria of Run-
times signifies the number of supported programming
languages. Services are the additional services that
are supported (for example databases), and add-ons
are additional other programs which can be used with
the service. Also, uptime of the service in the past 30
days for all the providers is included for evaluation.
In this scenario all these criteria have a positive im-
pact and are weighted equally. The result of TOPSIS
as computed with code snippet 1 is Heroku.
Figure 4: Use Case 2- ANP Model.
For ranking the alternatives from the business per-
spective the model in Figure 4 for ANP is constructed.
In this case there is a self-loop on the cost cluster,
which allows to give relative priority to each criteria
in a cluster. Here the criteria of integration cost is
considered 2 times more important than that of per-
formance cost. For this scenario, the resulting super
matrix is shown and not every pairwise comparison
matrix. Again by applying code snippet 3 the limit
matrix is found, shown in Table 10, which ranks dot-
Cloud the highest.
However, now the results of TOPSIS and ANP do
not match and therefore a tradeoff is necessary. Since
TrAdeCIS allows to select the best technical alterna-
tive at a trade-off of business values, priority of cri-
teria are altered in the ANP model. By adjusting the
importance of criteria of integration cost to be 4 times
higher than that of performance cost in the cost clus-
ter, both algorithms give the same result Heroku.
4.3 Use Case 3 Decision of Adopting
IaaS
For the third use-case, even though the decision is still
regarding IaaS, it entails higher complexity owing to
higher number of interrelations between the factors.
For TOPSIS the criteria are shown in Table 11 and
the weights are equal and all criteria have a positive
impact on the decision. For ANP the model is shown
CLOSER 2016 - 6th International Conference on Cloud Computing and Services Science
76

Table 4: Use Case 1 Comparison Matrix for Location.
Location Amazon EC2 GoGrid NephoScale OpSource Rackspace
Amazon EC2 1 7/2 7 7/4 7/9
Go Grid 2/7 1 2 1/2 2/9
NephoScale 1/7 1/2 1 1/4 1/9
Op Source 4/7 2 4 1 4/9
Rackspace 9/7 9/2 9 9/4 1
Table 5: Use Case 1 Comparison Matrix for Monthly Cost.
Monthly Cost Amazon EC2 GoGrid NephoScale OpSource Rackspace
Amazon EC2 1 273.6/80.81 146/80.81 87.6/80.81 51.1/80.81
Go Grid 80.81/273.6 1 146/273.6 87.6/273.6 51.1/273.6
NephoScale 80.81/146 273.6/146 1 87.6/146 51.1/146
Op Source 80.81/87.6 273.6/87.6 146/87.6 1 51.1/87.6
Rackspace 80.81/51.1 273.6/51.1 146/51.1 87.6/51.1 1
Table 6: Use Case 1 Comparison Matrix for Transfer Out.
Transfer Out Amazon EC2 GoGrid NephoScale OpSource Rackspace
Amazon EC2 1 0.29/0.12 0.13/0.12 0.15/0.12 0.18/0.12
Go Grid 0.12/0.29 1 0.13/0.29 0.15/0.29 0.18/0.29
NephoScale 0.12/0.13 0.29/0.13 1 0.15/0.13 0.18/0.13
Op Source 0.12/0.15 0.29/0.15 0.13/0.15 1 0.18/0.15
Rackspace 0.12/0.18 0.29/0.18 0.13/0.18 0.15/0.18 1
Table 7: Use Case 1 Resulting Super Matrix.
Monthly Cost Transfer Out Cost Location Amazon EC2 GoGrid NephoScale OpSource Rackspace
Monthly Cost 0 0 0 0.1 0.1 0.1 0.1 0.1
Transfer Out Cost 0 0 0 0.1 0.1 0.1 0.1 0.1
Location 0 0 0 0.2 0.2 0.2 0.2 0.2
Amazon EC2 0.117 0.133 0.308 0 0 0 0 0
GoGrid 0.033 0.054 0.083 0 0 0 0 0
Nepho Scale 0.062 0.121 0.042 0 0 0 0 0
OpSource 0.104 0.104 0.175 0 0 0 0 0
Rackspace 0.183 0.088 0.392 0 0 0 0 0
Table 8: Use Case 1 Resulting Limit Matrix.
Monthly Cost Transfer Out Cost Location Amazon EC2 GoGrid NephoScale OpSource Rackspace
Monthly Cost 0 0 0 0.25 0.25 0.25 0.25 0.25
Transfer Out Cost 0 0 0 0.25 0.25 0.25 0.25 0.25
Location 0 0 0 0.5 0.5 0.5 0.5 0.5
Amazon EC2 0.289 0.289 0.289 0 0 0 0 0
GoGrid 0.085 0.085 0.085 0 0 0 0 0
Nepho Scale 0.089 0.089 0.089 0 0 0 0 0
OpSource 0.186 0.186 0.186 0 0 0 0 0
Rackspace 0.351 0.351 0.351 0 0 0 0 0
in Figure 5. Here, the clusters have different priori-
ties. Cost is three times more important than migra-
tion time, carbon footprint, and legal and regulative
compliance. Also, number of places where severs are
placed, is four times more important than migration
time and carbon footprint. Hence making the cluster
of Cost being prioritized the highest. The resulting
super matrix is shown in Table 12. The resulting limit
matrix which is obtain by applying code snippet 3 is
shown in Table 13.
Decision Support System for Adoption of Cloud-based Services
77
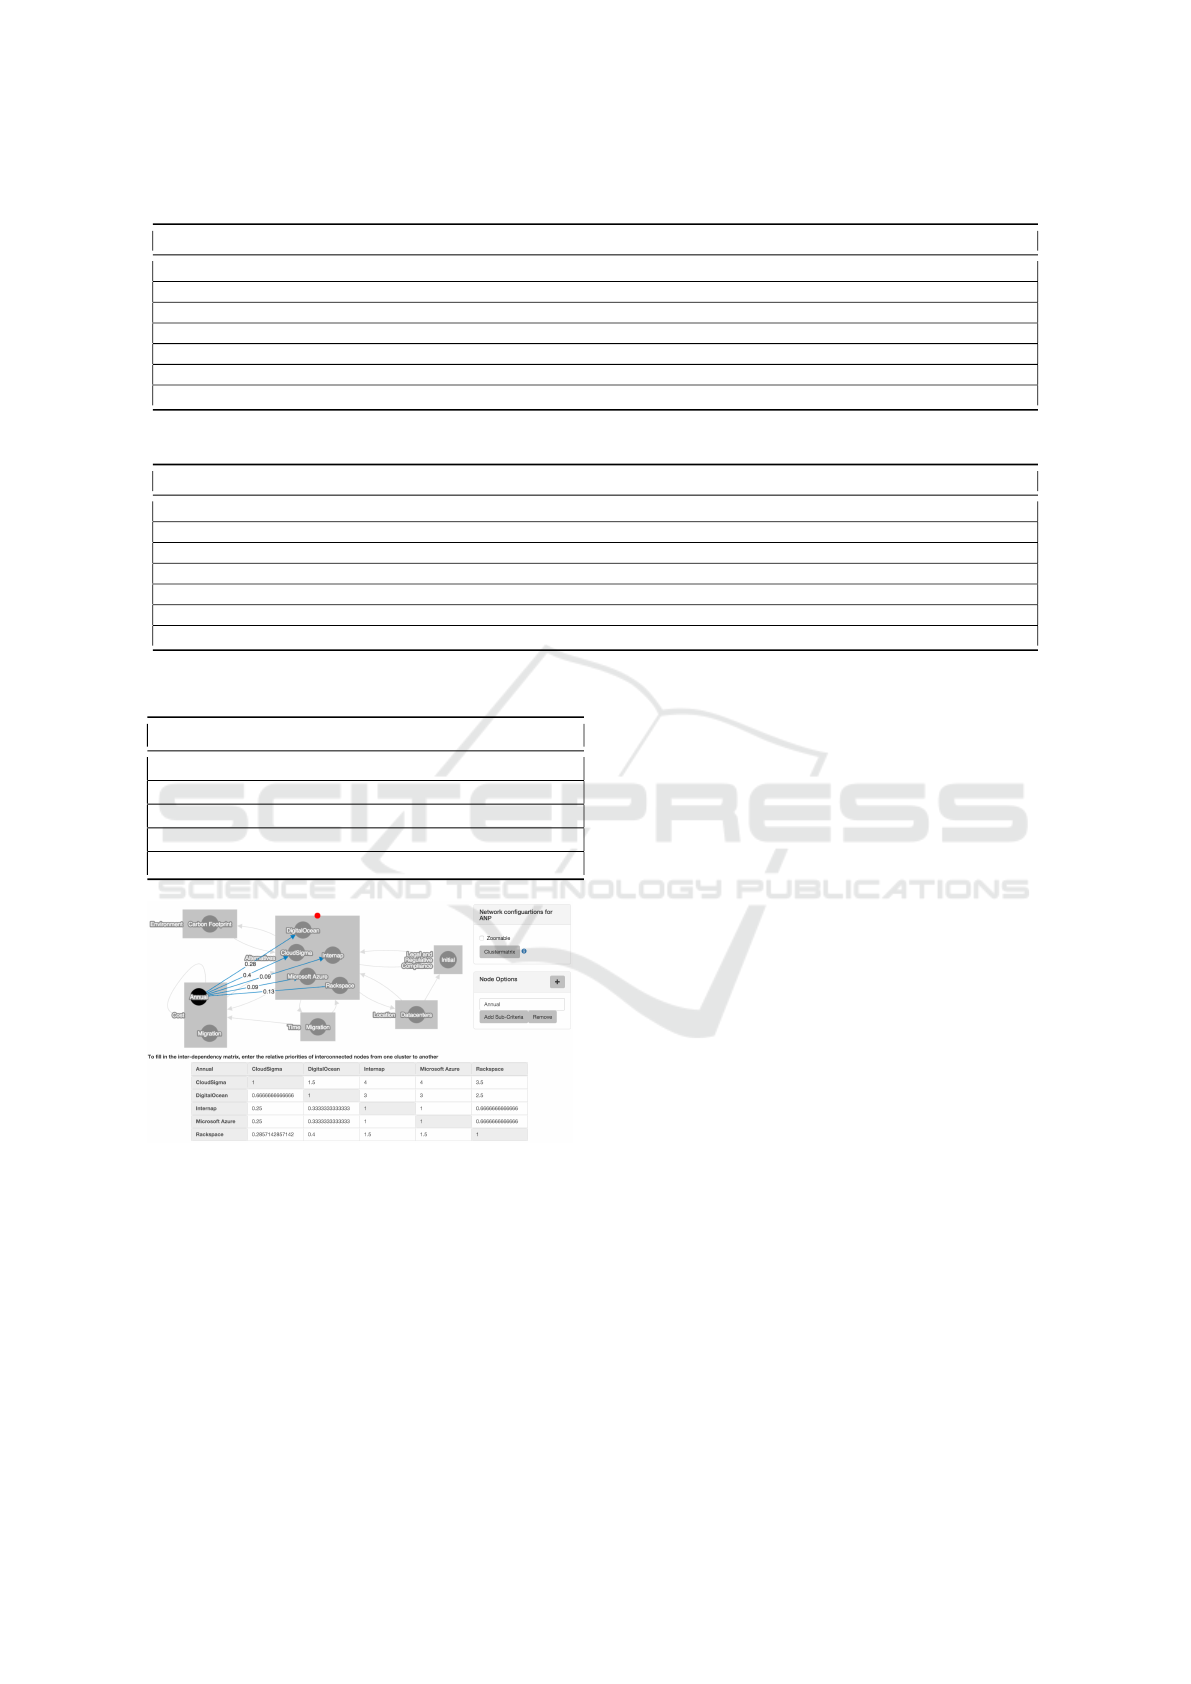
Table 9: Use Case 2 Resulting Super Matrix.
Location Performance Cost Integration Cost Cost Flexibility Heroku dotcloud AppHarbor
Location 0 0 0 0 0.083 0.083 0.083
Performance Cost 0 0 0 0 0.021 0.056 0.028
Integration Cost 0 0 0 0 0.062 0.028 0.056
Cost Flexibility 0 0 0 0 0.083 0.083 0.083
Heroku 0.100 0.037 0.104 0.035 0 0 0
dotcloud 0.050 0.025 0.022 0.144 0 0 0
AppHarbor 0.100 0.022 0.040 0.071 0 0 0
Table 10: Use Case 2 Resulting Limit Matrix.
Location Performance Cost Integration Cost Cost Flexibility Heroku dotcloud AppHarbor
Location 0 0 0 0 0.333 0.333 0.333
Performance Cost 0 0 0 0 0.140 0.140 0.140
Integration Cost 0 0 0 0 0.193 0.193 0.193
Cost Flexibility 0 0 0 0 0.333 0.333 0.333
Heroku 0.335 0.335 0.335 0.335 0 0 0
dotcloud 0.343 0.343 0.343 0.343 0 0 0
AppHarbor 0.322 0.322 0.322 0.322 0 0 0
Table 11: Use Case 3 Input for TOPSIS.
Alternatives CPU RAM Storage (SSD)
Cloud Sigma 1 2 50
Digital Ocean 2 2 40
Internap 1 4 20
Microsoft Azure 1 3.5 50
Rackspace 2 2 40
Figure 5: Use Case 3- ANP Model.
Because the results of TOPSIS (Microsoft Azure)
and ANP (CloudSigma) do not match, a trade-off is
now suggested by the system. By changing/ trading-
off the priority values in the cluster matrix- prioritiz-
ing location 3 times higher than cost- the result of
ANP is now Microsoft Azure as well. Therefore, in
TrAdeCIS trade-offs are calculated by altering the pri-
orities of the criteria in the ANP model. These al-
teration are based on the compromise in priorities of
criteria a decision maker is willing to make.
4.4 Performance Testing
This section analyses the performance of TrAdeCIS
with respect to how long certain tasks need to execute
or to load. While TOPSIS scales well even with grow-
ing number of alternatives and criteria, ANP does not.
The highly complex model of ANP, and its corre-
sponding input value does limit the size at which it
is user friendly to work with. The Table 14 shows an
overview of the performance of the ANP model with
growing number of nodes. The load up time shows the
time taken for initial rendering depending on the num-
ber of nodes. The selection matrix generation shows
how long the generation of the pairwise comparison
matrix takes. From Table 14 it can be deduced that
the number of nodes in the model should not grow
over 75, otherwise the user would have to wait for
very high interval of time. It is important to note that
the generation time for comparison matrix is not de-
pendent on the total number of nodes in the model,
but on the number of nodes that have to be compared
based on a specific interrelation.
In addition, the decision support system has an
overview page, where the results of both TOPSIS and
ANP are visualized, and the user can make any alter-
ations to the existing decision in the database. There-
fore, it is important to measure the loading and pro-
cessing time for this page. The load time for 10 nodes
and 50 nodes in ANP is shown in Figure 6 and Fig-
ure 7 respectively. The overall load up time of the
overview page is around 1.5 seconds and 3 seconds
depending on the complexity of the model and the
number of the nodes. Therefore, based on these val-
CLOSER 2016 - 6th International Conference on Cloud Computing and Services Science
78
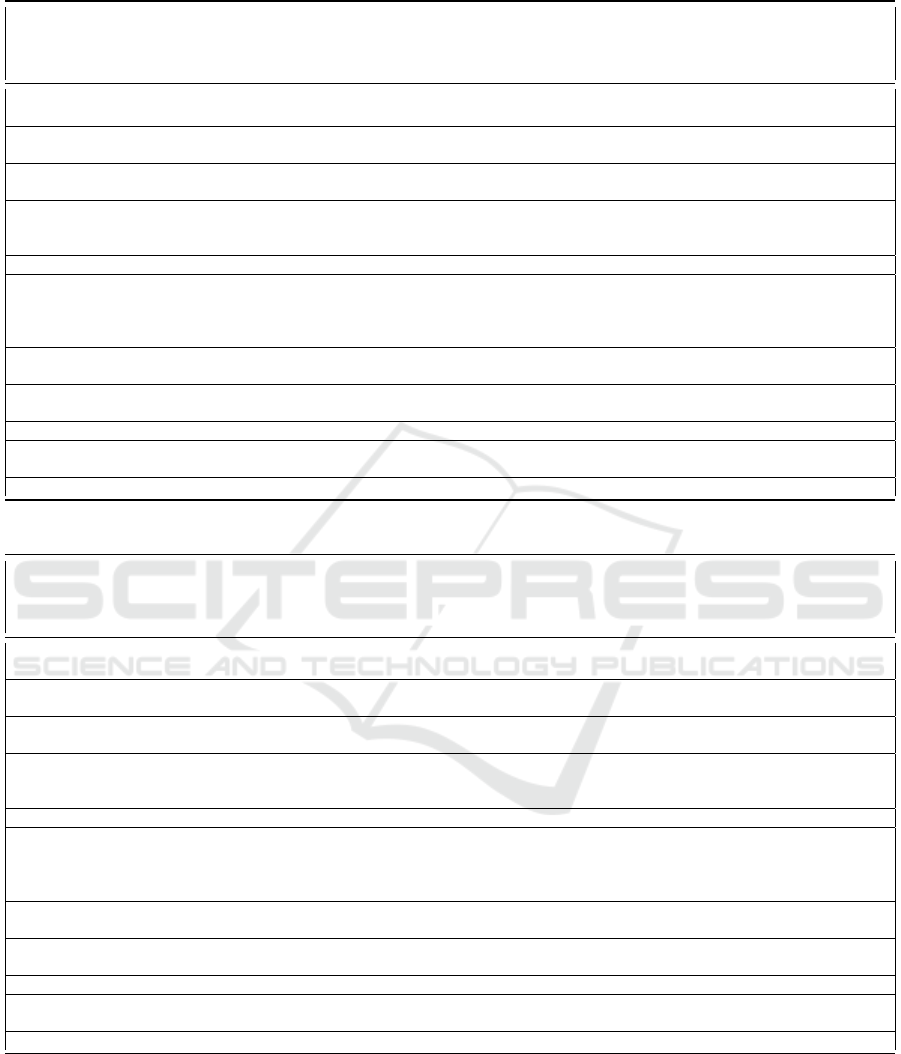
Table 12: Use Case 3 Resulting Super Matrix.
Migration
Cost
Annual
Cost
Migration
Time
Carbon
Foot-
print
Location Legal
and
Regula-
tive
Cloud
Sigma
Digital
Ocean
Internap Microsoft Rackspace
Migration
Cost
0 0 0.083 0 0 0 0.016 0.016 0.016 0.016 0.016
Annual
Cost
0 0 0.017 0 0 0 0.016 0.016 0.016 0.016 0.016
Migration
Time
0 0 0 0 0 0 0.031 0.031 0.031 0.031 0.031
Carbon
Foot-
print
0 0 0 0 0 0 0.031 0.031 0.031 0.031 0.031
Location 0 0 0 0 0 0 0.031 0.031 0.031 0.031 0.031
Legal
and
Regula-
tive
0 0 0 0 0.252 0 0.031 0.031 0.031 0.031 0.031
Cloud
Sigma
0.012 0.078 0.030 0.013 0.048 0.024 0 0 0 0 0
Digital
Ocean
0.007 0.055 0.013 0.019 0.055 0.022 0 0 0 0 0
Internap 0.008 0.018 0.013 0.018 0.031 0.036 0 0 0 0 0
Microsoft
Azure
0.030 0.018 0.028 0.019 0.086 0.013 0 0 0 0 0
Rackspace 0.008 0.024 0.016 0.032 0.031 0.036 0 0 0 0 0
Table 13: Use Case 3 Resulting Limit Matrix.
Migration
Cost
Annual
Cost
Migration
Time
Carbon
Foot-
print
Location Legal
and
Regula-
tive
Cloud
Sigma
Digital
Ocean
Internap Microsoft Rackspace
Migration
Cost
0.077 0.077 0.077 0.077 0.077 0.077 0.077 0.077 0.077 0.077 0.077
Annual
Cost
0.046 0.046 0.046 0.046 0.046 0.046 0.046 0.046 0.046 0.046 0.046
Migration
Time
0.076 0.076 0.076 0.076 0.076 0.076 0.076 0.076 0.076 0.076 0.076
Carbon
Foot-
print
0.076 0.076 0.076 0.076 0.076 0.076 0.076 0.076 0.076 0.076 0.076
Location 0.076 0.076 0.076 0.076 0.076 0.076 0.076 0.076 0.076 0.076 0.076
Legal
and
Regula-
tive
0.194 0.194 0.194 0.194 0.194 0.194 0.194 0.194 0.194 0.194 0.194
Cloud
Sigma
0.099 0.099 0.099 0.099 0.099 0.099 0.099 0.099 0.099 0.099 0.099
Digital
Ocean
0.086 0.086 0.086 0.086 0.086 0.086 0.086 0.086 0.086 0.086 0.086
Internap 0.081 0.081 0.081 0.081 0.081 0.081 0.081 0.081 0.081 0.081 0.081
Microsoft
Azure
0.097 0.097 0.097 0.097 0.097 0.097 0.097 0.097 0.097 0.097 0.097
Rackspace 0.077 0.077 0.077 0.077 0.077 0.077 0.077 0.077 0.077 0.077 0.077
ues it can be concluded TrADeCIS, in general is not
a heavy system and can reach conclusive quantified
results within acceptable time limits.
5 APPLICABILTY OF TrAdeCIS
IN OTHER DOMAINS
TrAdeCIS was primarily developed to support organi-
zations in the adoption of cloud-based services. How-
Decision Support System for Adoption of Cloud-based Services
79
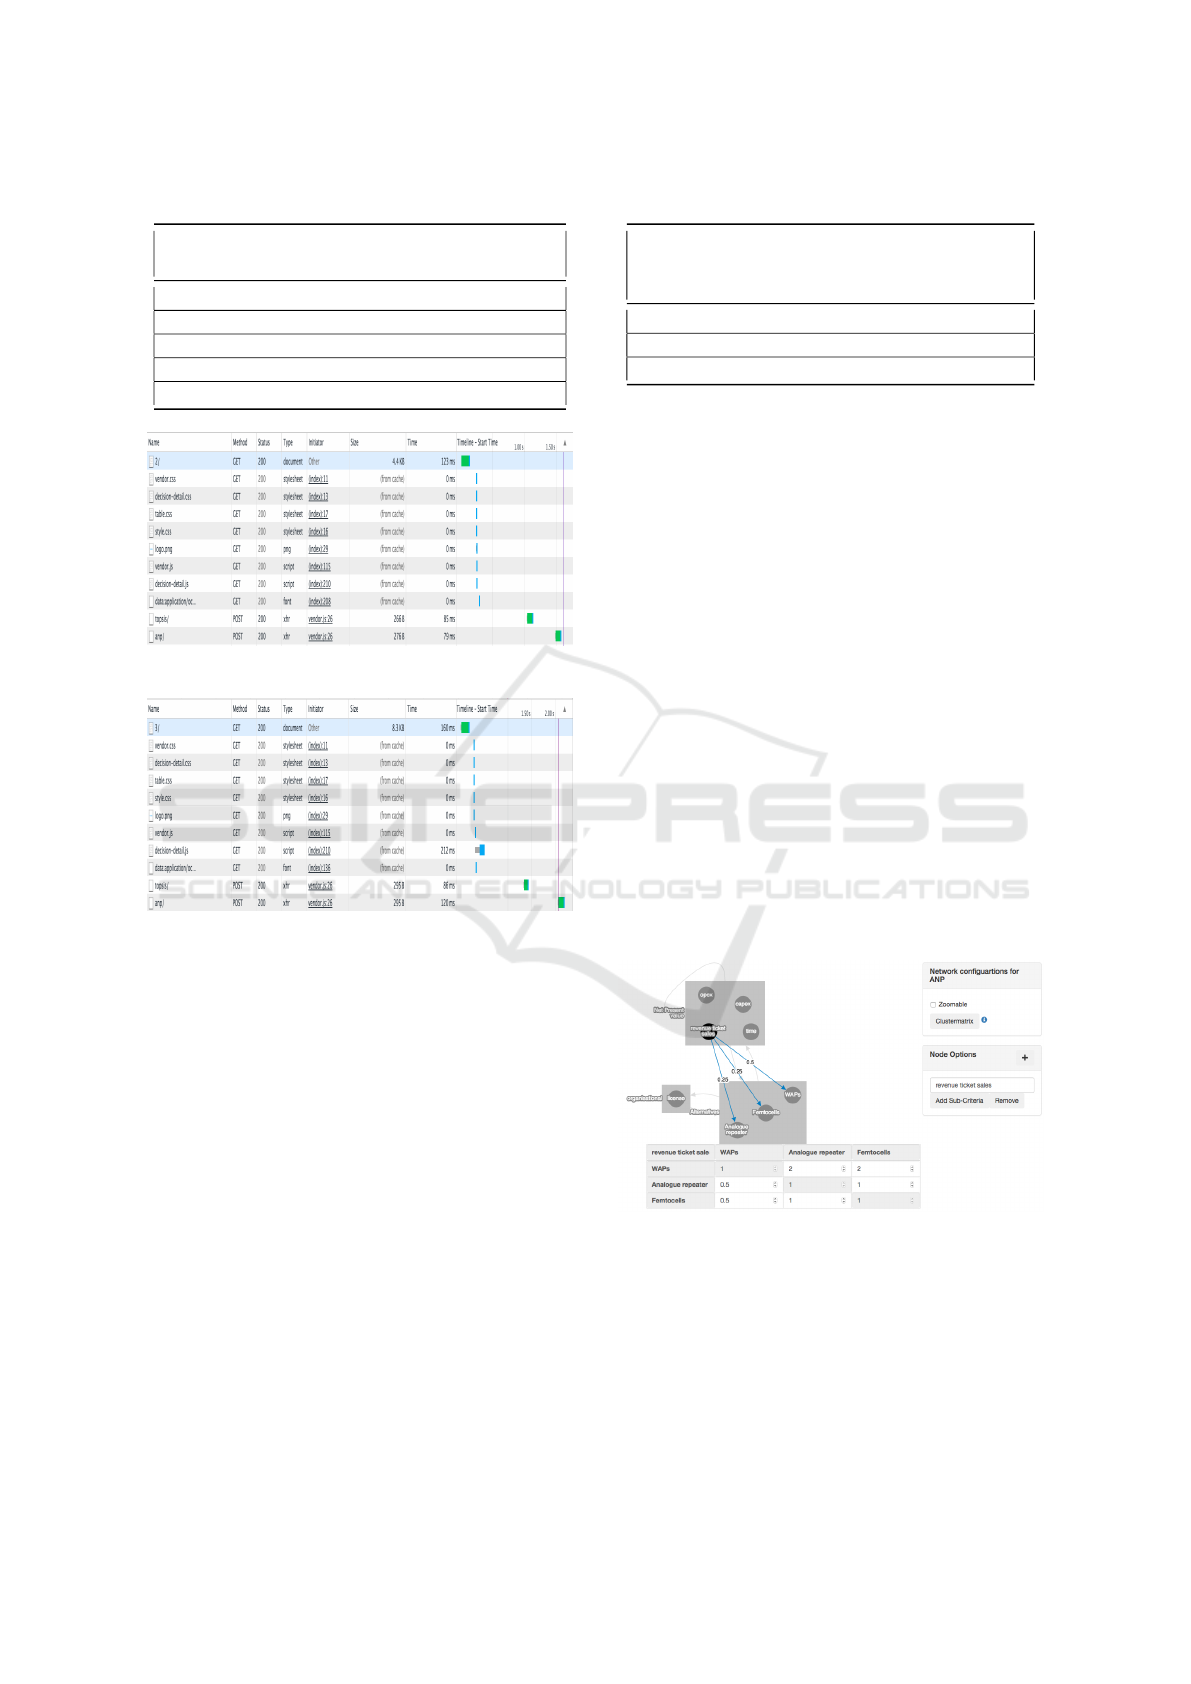
Table 14: ANP Time Measurements.
Number of
Nodes
Initial load
up time
Matrix gen-
eration
3 414 ms 100 ms
10 486 ms 250 ms
25 637 ms 600 ms
50 826 ms 1400 ms
100 1256 ms 4100 ms
Figure 6: Load Up Time with 10 Nodes.
Figure 7: Load Up Time with 50 Nodes.
ever, organizations may also utilize TrADeCIS to im-
prove their understanding and adoption decisions of
other technologies than that of cloud-based services.
This is illustrated by applying TrAdeCIS to Train Op-
erating Companies (TOC) who need to make a deci-
sion of choosing the best technology when they re-
search the possibility to improve both voice- and data
coverage on-board trains. This decision takes the per-
spective of the TOC who is hoping to sell more tick-
ets by providing connectivity on-board trains. For the
train-to-wayside connection, it is assumed that all on-
board solutions use the same system: connection to
mobile base stations (3G or beyond). The following
alternatives are evaluated (cf. Table 15) to be installed
on-board train:
• Option 1: Wireless Access Point (WAP)
• Option 2: Analogue repeater
• Option 3: Femtocells
The technical requirements from these alternatives
and their relative priorities are as follows:
Table 15: Input for TOPSIS.
Alternatives Internet
availabil-
ity
Voice
cover-
age
Internet
speed
Option 1 3 1 3
Option 2 2 2 2
Option 3 2 2 2
• Internet should be available to all passengers with
a mobile device (Priority 1)
• Quality of voice calls should be improved for all
passengers with a phone (Priority 2)
• Internet speed should be as high as possible (Pri-
ority 3)
Therefore, after applying TOPSIS to these techni-
cal requirements, installation of WAPs is ranked the
highest.
From the financial/economic requirements per-
spective, ANP is used to model it as shown in 8. The
factor of Net Present Value, which should be positive
as soon as possible, is of highest priority. However,
it is broken into sub-factors as that of low deploy-
ment time, high revenue, low capital expenditure, and
low operational expenditure. In addition, all these fac-
tors contribute differently to the factor of Net Present
Value. This is represented with a self-loop and the
respective weightage or priorities of these factors are
entered in the corresponding comparison matrix. Also
in terms of the organizational requirements, the TOC
prefers to avoid the use of licensed spectrum (medium
importance).
Figure 8: Use Case 4- ANP Model.
The resulting super matrix, which is constructed
from all the comparison matrices, is shown in Table
16. The highest ranked alternative from ANP is also
WAPs, as shown in limit matrix (cf. Table 17). There-
fore, as the ranking obtained from both TOPSIS and
ANP is the same, for the scenario of providing inter-
net and voice call connectivity on-board train, WAP
is the best alternative.
CLOSER 2016 - 6th International Conference on Cloud Computing and Services Science
80
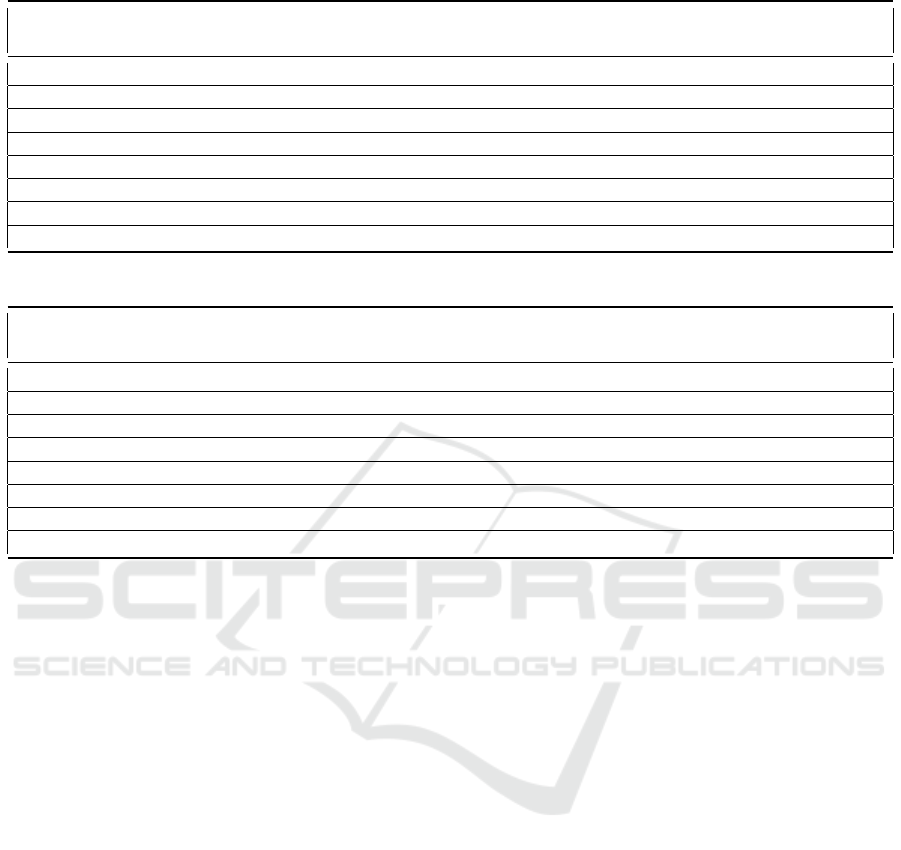
Table 16: Use Case 4 Resulting Super Matrix.
OPEX CAPEX Time Revenue License WAPs Analogue Femtocells
ticket sales repeater
OPEX 0 0 0 0 0 0.083 0.083 0.083
CAPEX 0 0 0 0 0 0.083 0.083 0.083
Time 0 0 0 0 0 0.083 0.083 0.083
Revenue ticket sales 0 0 0 0 0 0.083 0.083 0.083
License 0 0 0 0 0 0.333 0.333 0.333
WAPs 0.05 0.041 0.021 0.308 0.425 0 0 0
Analogue repeater 0.05 0.081 0.041 0.154 0.425 0 0 0
Femtocells 0.05 0.027 0.014 0.154 0.142 0 0 0
Table 17: Use Case 4 Resulting Limit Matrix.
OPEX CAPEX Time Revenue License WAPs Analogue Femtocells
ticket sales repeater
OPEX 0 0 0 0 0 0.125 0.125 0.125
CAPEX 0 0 0 0 0 0.125 0.125 0.125
Time 0 0 0 0 0 0.125 0.125 0.125
Revenue ticket sales 0 0 0 0 0 0.125 0.125 0.125
License 0 0 0 0 0 0.5 0.5 0.5
WAPs 0.428 0.428 0.428 0.428 0.428 0 0 0
Analogue repeater 0.409 0.409 0.409 0.409 0.409 0 0 0
Femtocells 0.164 0.164 0.164 0.164 0.164 0 0 0
6 SUMMARY, CONCLUSIONS,
AND FUTURE WORK
This paper has designed, developed, and evaluated the
decision support system to automate the methodology
of TrADeCIS that facilitates the decision of adopting
cloud-based services in an organization. TrAdeCIS
makes a trade-offs based quantified decision of select-
ing the best alternative as per the requirements of the
organization using integrated MADAs of TOPSIS and
ANP. Appropriate use-case (involving train operating
companies) validated the applicability of TrADeCIS
in a decision process of adopting a different technol-
ogy besides that of cloud-based services.
TrAdeCIS is the first methodology that supports
an automated and quantified trade-offs based deci-
sion for selecting the best Cloud-based service, with
the consideration of all interrelations of relevant fac-
tors. These factors can have different measurement
units, or can be qualitative. As the selected algo-
rithms normalize input values and allow entering rel-
ative ranking (required for qualitative factors), this
methodology is applicable to decisions involving po-
tentially any technology. The only requirements for
this methodology to be applicable is that the decision
must involve multiple alternative solutions that are to
be evaluated on multiple criteria. For the future im-
provement in the developed system, following major
tasks will be considered:
• Consistency checks for ANP: Currently the input
in the pairwise comparison matrix are not checked
in terms of the are consistent, e.g., if A is bigger
than B, and C is bigger than B, logically C would
also be bigger than A. Therefore an error message
could be shown which informs the user about such
inconsistency.
• Tradeoff suggestions: The improvement will pro-
vide suggestions in terms of minimum required
changes in priorities to match the results of TOP-
SIS and ANP. This will considerably reduce the
effort required from the side of the user.
ACKNOWLEDGEMENTS
This work was partly funded by FLAMINGO, the
Network of Excellence Project ICT-318488, sup-
ported by the European Commission under its Sev-
enth Framework Program. The authors would also
like to thank Bram Naudts for discussions and excel-
lent input with respect to applying TrAdeCIS to Train
Decision Support System for Adoption of Cloud-based Services
81

Operating Companies.
REFERENCES
Armburst, M., Fox, A., Griffith, R., Anthony, J. D., Katz,
R., Konwinski, A., Lee, G., Patterson, D., Rabkin, A.,
Stoica, I., and Zaharia, M. (2010). A View of Cloud
Computing. Communications of the ACM, 53(4):50–
58.
Beserra, P. V., Camara, A., Ximenes, R., Albuquerque,
A. B., and Mendonc¸a, N. C. (2012). Cloudstep: A
Step-by-step Decision Process to Support Legacy Ap-
plication Migration to the Cloud. In Proceedings of
the IEEE 6th International Workshop on theMainte-
nance and Evolution of Service-Oriented and Cloud-
Based Systems (MESOCA), pages 7–16, Trento, Italy.
Cloud Harmony Inc. (2015). Cloud Harmony. https://
cloudharmony.com/. Last visited in October, 2015.
Garg, R. and Stiller, B. (2014). Trade-off-based Adop-
tion Methodology for Cloud-based Infrastructures and
Services. In Monitoring and Securing Virtualized
Networks and Services, Springer, pages 1–13, Brno,
Czech Republic.
Garg, R. and Stiller, B. (2015). Factors Affecting Cloud
Adoption and Their Interrelations. In Proceedings of
the 5th International Conference on Cloud Computing
and Services Science (CLOSER), SCITEPRESS (Sci-
ence and Technology Publications, Lda.), pages 87–
94, Lisbon, Portugal.
Ishizaka, A. and Nemery, P. (2013). Multi-criteria Decision
Analysis: Methods And Software. John Wiley & Sons.
Menzel, M., Sch
¨
onherr, M., and Tai, S. (2013). (MC
2
)
2
:
Criteria, Requirements and a Software Prototype for
Cloud Infrastructure Decisions. Software: Practice
and Experience, 43(11):1283–1297.
Moore, S. (2015). Gartner Says Worldwide Cloud
Infrastructure-as-a-Service Spending to Grow 32.8%
in 2015e. http://www.gartner.com/newsroom/id/
3055225.
NetApp (2015). The Journey from Traditional IT to
the Cloud-Net App. http://webobjects.cdw.com/
webobjects/media/pdf/netapp/NetApp-Virtualization
-To-Cloud-Brochure-1.pdf?cm sp=NAPShowcase- -
Cat4- -CloudComputing. Last visited in October,
2015.
Saaty, T. L. and Vargas, L. G. (2006). Decision Making With
The Analytic Network Process. Springer.
Saripalli, P. and Pingali, G. (2011). MADMAC: Multi-
ple Attribute Decision Methodology for Adoption of
Clouds. In Proceedings of the IEEE 4th International
Conference on Cloud Computing (CLOUD), pages
316–323, Washington DC, USA.
Walker, E. (2009). The Real Cost of a CPU Hour. IEEE
Computer, 42(4):35–41.
Wang, J. J. and Yang, D. L. (2007). Using a Hybrid Multi-
criteria Decision Aid Method for Information Systems
Outsourcing. Computers and Operations Research,
34(12):3691–3700.
Zardari, S. and Bahsoon, R. (2011). Cloud Adoption: a
Goal-oriented Requirements Engineering Approach.
In Proceedings of the ACM 2nd International Work-
shop on Software Engineering for Cloud Computing,
pages 29–35, Honolulu, Hawaii, USA.
CLOSER 2016 - 6th International Conference on Cloud Computing and Services Science
82
