
An Evaluation Methodology for VANET Applications Combining
Simulation and Multi-sensor Experiments
Dominique Seydel
1
, Sebastian Bittl
1
, Jakob Pfeiffer
1
, Josef Jiru
1
, Hanno Beckmann
2
, Kathrin Frankl
2
and Bernd Eissfeller
2
1
Fraunhofer Institute for Embedded Systems and Communication Technologies ESK, Munich, Germany
2
Bundeswehr University Munich, Munich, Germany
Keywords:
VANET, ETSI ITS, ADAS, Positioning, GNSS, Evaluation, Simulation.
Abstract:
Wireless vehicular networks are in the wake of mass deployment both in Europe and the USA. These net-
works introduce a new promising source of information about vehicular environments usable by cooperative
advanced driver assistance systems (ADAS). However, development and evaluation of such ADAS is still
challenging. Thus, we propose a methodology for their development and evaluation process. It is applied to
evaluate the fulfillment of requirements on position accuracy information within the communicated data sets.
Accuracy requirements are only roughly defined and not sufficiently evaluated in real world environments.
This holds especially for GNSS (Global Navigation Satellite Systems) optimized for maximum integrity of
obtained positions, which is required for safety critical ADAS to increase robustness and reliability. Our
main goal is to determine whether position accuracy provided by GNSS is sufficient for cooperative ADAS.
Thereby, we find that pure GNSS input cannot fulfill position accuracy requirements in most test cases.
1 INTRODUCTION
Vehicular ad hoc networks (VANETs) are an active
research area. Their aim of increased traffic safety
leads to high interest of both automotive industry as
well as governments to push forward deployment in
upcoming years (MoU, 2011; Harding et al., 2014).
A well known concept for development of advanced
driver assistance systems (ADAS) is to include sim-
ulation based testing and evaluation early in the de-
velopment process (Chrisofakis et al., 2011; Hanzlik,
2013) and adapt the simulation environment in each
phase, e.g. for Vehicle in the Loop tests (Winner et al.,
2009). This concept is especially in need for VANET
applications, due to a wide range of possible traffic
scenarios with many involved vehicles. Thus, it is
hard to realize a complex setup in a reproducible way
during field tests (Sommer et al., 2009). Moreover,
for the simulation of VANET applications road traffic
and wireless network have to be simulated simultane-
ously. These two simulations have to be coupled to
generate a realistic behavior of surrounding vehicles
and to consider the corresponding network parame-
ters (Wegener et al., 2008).
The first use cases to be deployed, like Road
Works Warning (RWW), require only an accuracy
that allows the ego vehicle to be assigned to a dedi-
cated lane. For the longitudinal direction, demands
on the position accuracy are even lower (ETSI 539-
1, 2013). Our evaluation includes two important
VANET use cases, Intersection Collision Risk War-
ning (ICRW) (ETSI 539-2, 2013) and Longitudinal
Collision Risk Warning (LCRW) (ETSI 539-3, 2013).
From a comparison of the different early use cases of
VANETs (ETSI 638, 2015), one can see that these
two ADAS can be regarded as advanced applications
regarding the requirements on the position accuracy
and the communication latency. Their deployment is
planned for a later stage of expansion. One advantage
of using ICRW and LCRW for the evaluation of the
positioning requirements is the availability of com-
parable reference systems realized with conventional
sensors, such as radar sensors. The more the results of
the VANET based implementation resemble the ones
of the reference system, the more reliable VANETs
can be seen as a sensor for ADAS.
Development and test of ADAS are complex tasks
and errors within the implementation of the ADAS
have a severe impact on the results of conducted eva-
luation. Thus, we developed a testing environment to
Seydel, D., Bittl, S., Pfeiffer, J., Jiru, J., Beckmann, H., Frankl, K. and Eissfeller, B.
An Evaluation Methodology for VANET Applications Combining Simulation and Multi-sensor Experiments.
In Proceedings of the International Conference on Vehicle Technology and Intelligent Transport Systems (VEHITS 2016), pages 213-224
ISBN: 978-989-758-185-4
Copyright
c
2016 by SCITEPRESS – Science and Technology Publications, Lda. All rights reserved
213

compare intermediate results of the VANET based ap-
plication with the used radar based reference system.
The basic question of our examination is to fig-
ure out, if pure GNSS, like GPS, yield a sufficiently
high position accuracy for ADAS or if extra in-vehicle
sensors are needed. This also answers the question
whether already sold vehicles can be equipped with
VANET technology by plug-in devices, which need
nothing except a power supply from the vehicles en-
ergy system (just like navigation systems).
The remainder of this work is outlined as follows.
A review of related work is provided in Section 2. Af-
terwards, Section 3 introduces the proposed evalua-
tion methodology, which is applied in Section 4. Fi-
nally, a conclusion about achieved results and possi-
ble topics of future work are given in Section 5.
2 RELATED WORK
Basic requirements of VANET based ADAS have
been determined and some realizations based on early
versions of VANET standards have been tested during
numerous field tests in Europe (e.g., DRIVE C2X,
simTD) and the US (Harding et al., 2014). Thereby,
accurate determination of vehicles’ position was iden-
tified as a main issue in VANETs.
In general, current VANET approaches use wire-
less cyclic broadcast of beacon messages for basic
information distribution among nodes (e.g., vehicles
or road side units (RSUs)). Two similar approaches
are followed within the European Telecommunica-
tions Standards Institute (ETSI) Intelligent Transport
Systems (ITS) and US Wireless Awareness in Ve-
hicular Environments (WAVE) standardization frame-
works (MoU, 2011; Harding et al., 2014). Communi-
cation within VANETs is often referred to as Vehicle-
to-X (V2X) communication. In the following, we
stick to the ETSI ITS nomenclature, but porting to the
WAVE system is straight forward.
Within ETSI ITS the beacon messages are called
Cooperative Awareness Messages (CAMs). These are
generated and received by a so called Cooperative
Awareness Basic Service within the facility layer of
the protocol stack. Thereby, the facility layer com-
bines all functionality from layers five upwards within
the ISO/OSI model (ETSI 637-2, 2014).
2.1 Evaluation Environments
(Joerer et al., 2012) presents a coupled simulation
environment were network and traffic simulation is
combined to show the impact of VANETs for an in-
tersection collision detection application. Within this
simulation the effectiveness of vehicular networks
for cooperative collision detection is evaluated, espe-
cially on packet level.
Currently it is not possible to use other popu-
lar VANET standard implementations, which are of-
ten used for research and application evaluation, like
iTETRIS for ETSI ITS (Rondinone et al., 2013) or
Veins for WAVE (Sommer et al., 2009). This is
caused by close coupling of such implementations
to their simulation environments (ns-3 resp. OM-
Net++). Moreover, protocol implementations dedi-
cated for real hardware typically make direct use of
operating system functionality, e.g., to obtain time in-
formation. Thus, such information is hard to be re-
placed by the one provided by a simulation environ-
ment. Moreover, parallel and coordinated usage of
many on-board units (OBUs) within a test setup leads
to very high complexity within the setup and testing
process. Therefore, rigid usage of an abstraction layer
for all data input sources is required, which is im-
plemented within the ezCar2X framework (Roscher
et al., 2014), as described in Section 4.1.
2.2 Development of ADAS
Development of ADAS is a complex process. Much
effort has been spent on strategies limiting required
effort of the development process and ensuring testa-
bility of obtained ADAS. Important prior work in-
cludes (Winner et al., 2009; Chrisofakis et al., 2011;
Berger, 2012; Hanzlik, 2013). As a main subject,
many aspects from the field of software engineering
have been adapted to the special needs of the automo-
tive context. An approach for an integrated testing
and simulation framework is given in (Voigtl
¨
ander,
2008). Our implementation in Section 4 uses some
of the concepts from (Voigtl
¨
ander, 2008), adapted for
the needs of cooperative ADAS.
However, development of cooperative ADAS
shows even higher complexity in comparison to such
ADAS using only information from within a single
vehicle. Especially, testability is a significant chal-
lenge, due to a massive increase in the variety of data
sets within the newly known vehicular environment.
Thus, we propose an extension to well known ADAS
development methods to enable their usage in the de-
velopment process of future VANET based ADAS.
In (Tan et al., 2006), a cooperative vehicle colli-
sion warning system was proposed based on commu-
nicated node positions obtained with differential GPS
(Global Positioning System). The feasibility of trajec-
tory prediction based on the communicated positions
was examined. An architecture was proposed imple-
menting a ”Future Trajectory Estimator” for received
VEHITS 2016 - International Conference on Vehicle Technology and Intelligent Transport Systems
214

vehicle position data. The following main weaknesses
of VANET based applications were identified: a) The
prediction accuracy decreases when the position er-
ror increases. b) Applications are vulnerable to long-
period GPS blockage and communication drop-outs.
c) There is limited tolerance of changes in the driver’s
intention, due to a slower update frequency of the de-
termined positions.
Evaluation of ADAS performance is an important
part of the development process. Thus, it is described
in more detail in Section 2.3.
2.3 Sensor based Reference System
(Yan et al., 2008) study security gains by combin-
ing data from VANET messages with radar measure-
ments. Thereby, the aim is to validate position infor-
mation from received messages. In contrast, our aim
is to evaluate if the position information is accurate
enough for robust usage within ADAS applications.
Basic requirements of a reference system for
ADAS are given in (Strasser et al., 2010). The mea-
sured distance, relative velocity and heading of the de-
tected objects are passed to the ADAS for further pro-
cessing. Different types of distance measurement sen-
sors have been proposed for usage in the automotive
domain. These include laser scanners, radar sensors,
photonic mixing devices (PMDs) and cameras, which
are common sensors for current ADAS equipped ve-
hicles (Winner et al., 2009).
OBUs typically use a GNSS based positioning
system, e.g., Cohda Wireless MK4a (Cohda, 2013).
We use a GNSS software receiver and compare its real
live measurements to the ones of an automotive radar
system. Details about the satellite based position es-
timation are given in Section 2.4. The input data for
an ADAS based on a VANET approach are messages
sent by vehicles. CAMs mainly contain the vehicle’s
position, including the positions confidence informa-
tion (optional), speed, heading and generation time of
the position (ETSI 637-2, 2014).
Further processing of the different input data sets
for evaluation of the VANET based ADAS is de-
scribed in Section 3.2.
2.4 Satellite based Positioning
GNSS have deeply entered the consumer market and
are widely used for car navigation systems. GNSS
based service applications offer a number of oppor-
tunities to the transportation market. Professional
and reliability critical applications like road tolling,
anti-theft systems and dangerous goods tracking have
been implemented in vehicles. These applications
are highly sensitive to the appearance of jamming de-
vices, one account of weaknesses of current satellite
navigation systems: the extremely low signal power.
In principle, GNSS such as the American GPS, the
European Galileo, the Russian Glonass and the Chi-
nese Beidou are based on the same principle: Naviga-
tion satellites are placed in a medium earth orbits in a
height of about 20.000 km to 25.000 km. These satel-
lites emit highly precise ranging signals with up to 50
W for the estimation of the signal travel time from the
satellite to the receiver on the earth. If the receiver is
able to track the signal of 4 satellites or more, it can
calculate it’s actual position by simple resection of
the ranging information. If the receiver would be per-
fectly aligned to the common GNSS clock, 3 satellites
in view would be enough. However, most receivers
are not perfectly aligned to the system time of GNSS
and the receiver’s clock offset to the system time has
to be estimated. Beside the actual time information
valid for the transmitting satellite, the satellite signal
also carries information to determine the position of
all satellites of the corresponding system, corrections
for ionospheric and tropospheric effects as well as off-
set information for the satellite’s unique clocks.
Most of the actual commercial GNSS receivers are
designed to use the satellite signals of the GPS L1
civil navigation signal. Furthermore, the European
Galileo and the Chinese Beidou provide open positio-
ning signals at the same center frequency of 1575.42
MHz, so modern civil GNSS receivers will also be
able to use these three systems in parallel. From the
time the receiver estimated the timing offset between
these satellite navigation systems, all corresponding
satellites can be used for a joint positioning.
Since it’s full operability in 1995, the GPS L1 C/A
(coarse/acquisition) signal offers a performance of
about 5 to 10 m to the civil user. In case of scattering
or multi path effects due to vegetation, buildings or
other surrounding objects, the position accuracy can
decrease to several tens (or in worst case hundreds) of
meters. In case of more precise requirements on the
position, one might also use either differential correc-
tion services, like DGNSS, or more sophisticated dual
frequency receivers. The usage of two frequencies al-
lows the receiver to estimate the ionospheric signal
distortions, which effects the distance estimation be-
tween receivers and satellite the most. Thus, the usage
of two frequencies improves the accuracy up to 2 to
9 m and in combination with differential corrections
down to tens of centimeters. For additional informa-
tion, see (Navipedia, 2015), (Misra, 2001), (Kaplan
et al., 2005) and (Hofmann, 2007).
An Evaluation Methodology for VANET Applications Combining Simulation and Multi-sensor Experiments
215

3 EVALUATION
METHODOLOGY
A central aspect of our development and evaluation
methodology is to combine pure software based sim-
ulation, a real world reference system and a real
world VANET. Thereby, we try to keep the amount
of changing code as low as possible, when moving
between the simulation environment to real world ex-
periments. This is done due to two major reasons.
At first, it avoids the effort for implementing a lot of
wrapper code, which speeds up the development pro-
cess. Secondly, it avoids errors introduced by chang-
ing behavior of the ADAS between the different eva-
luation environments.
The proposed development process of ADAS in-
cludes the simulation environment into the testing
process early. Thereby, the methodology is simi-
lar to well known test-driven development (Beck,
2002) leading to an enhanced and extended version
of simulation-driven development, which has shown
good results used within a single vehicle (Chrisofakis
et al., 2011). Thereby, each implemented feature is
tested with simulated data inputs and its performance
is evaluated as early as possible.
In contrast to prior work, we do not use the
newly implemented feature only on a single entity in
the simulation environment. Instead, after a feature
showed the expected behavior on a single vehicle it is
deployed on all entities (i.e., vehicles, road side units)
within the simulation environment. Thereby, also the
correct interaction of each component regarding mul-
tiple communicating entities can be verified early in
the development process.
A central requirement of the proposed methodo-
logy is the availability of a set of traffic scenarios,
which are characteristic for the use case(s) of the
ADAS to be implemented. To obtain such scenarios
we use two complementary approaches.
Firstly, the standardized requirements of the
ADAS are used to identify relevant road topolo-
gies. Afterwards, various traffic flows for these road
topologies are generated. Thereby, we used determi-
nistic traffics flows as well as such from random trip
generation. This can be done by various mechanisms,
as such implemented within the Simulation for Urban
Mobility (SUMO) framework (Behrisch et al., 2011).
Secondly, traffic scenarios which are identified as
challenging for ADAS by real world field tests are in-
cluded. To identify and characterize such scenarios,
a possibility to obtain detailed traces from test drives
and to re-run the entire drive with consistent timing of
data inputs within the simulation environment is re-
quired. Requirements for such playback functionality
can be found in (Broggi et al., 2012), our implemen-
tation is described in detail in Section 4.1.3.
As already mentioned, we do not only use simula-
tions to evaluate an ADAS. We also apply (multiple)
vehicle-mounted sensors. As our target ADAS’s aim
at collision avoidance, distance measurement sensors
are used. Thereby, we address the issue that it is hard
to perfectly resemble traffic scenarios from simulation
in practice, because of many cooperating entities.
The distance sensors are used to realize a refe-
rence ADAS serving as ground truth for the evalua-
tion of the cooperative ADAS based on V2X data. To
obtain a well usable reference system, we recommend
to follow best practices for such single vehicle ap-
plications proposed in prior work (Chrisofakis et al.,
2011; Hanzlik, 2013). Thereby, the reference sys-
tem is designed to obtain the maximum performance
achievable by an ADAS using only local sensor infor-
mation. Field tests are used to compare the reference
system and cooperative ADAS. In a first testing step,
side effects caused by the implementation are identi-
fied and removed. Afterwards, system limitations are
determined during a second evaluation step.
In the following, a software architecture, which
allows to implement a framework for the above
described evaluation methodology, is described in
Section 3.1. Afterwards, Section 3.2 describes a set
of information processing steps which is common to
many VANET based ADAS. Thus, these processing
steps can be regarded as an extension to the standar-
dized information handling steps within current ETSI
ITS and WAVE frameworks.
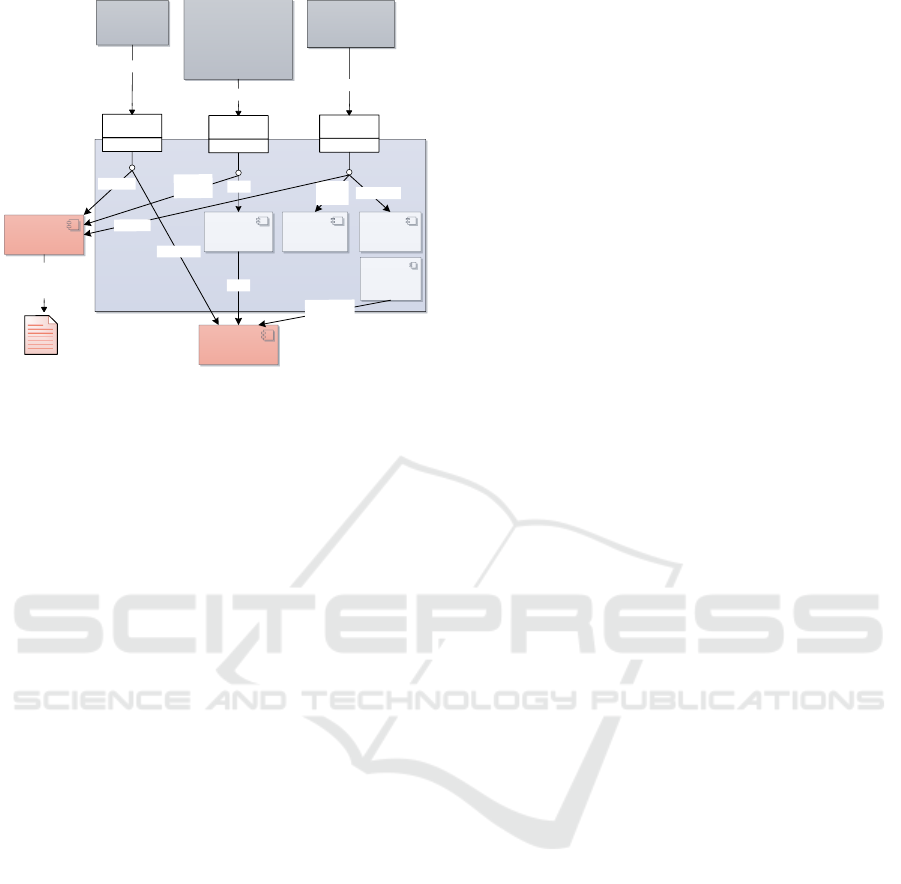
3.1 Software Architecture
To switch from simulation to a real world environ-
ment with little effort we facilitate input interfaces
that can be used for real sensors as well as for the in-
put data from a simulation environment. The received
data at the interfaces is then processed in the exact
same manner for both types of environments. The re-
sulting software architecture is depicted in Figure 1.
Required functionality from the advanced ITS imple-
mentation are described in the next paragraphs.
The time provider is the central component to fa-
cilitate the current time, which can be requested by all
the other components of the system. It can be based
on different time systems, like the local system time,
a GPS time or the timestamps used in the simulation
environment. The main advantage of this single time
provider is a synchronized time base for the whole
evaluation system. Another advantageous feature is
the ability to change the speed of the systems time
lapse. Thus, in a simulation or playback environ-
VEHITS 2016 - International Conference on Vehicle Technology and Intelligent Transport Systems
216
Positioning
Sensor
Object
Sensor
V2X
Receiver
Data Recorder
[T], [P]
«interface»
ITSG5
CAMs
ITSG
5
messages
«interface»
Bus
Radar Objekts
CAN data
V2X messages
Recorded Test Data
CAN data,
Positions,
ITSG5 messages
Radar data
ADAS
application
[T], [P]
LDM
[T], [P]
CAMs
ITS communication
system
[T] Time
Provider
Timestamp
[P] Position
Provider
GNSS
Position
«interface»
GNSS
GNSS Position
Positions
Trajectory
Provider
[T], [P]
Object
/
Ego
Trajectory
Figure 1: Software Architecture of the Evaluation System.
ment (which is described later in Section 4.1.3) de-
velopment time is reduced significantly. The position
provider is the time provider’s equivalent component
for position data. Within the system other entities can
request the current position of the ego vehicle. The
position provider obtains its input data from a position
sensor connected to the system, like a GNSS receiver
or from a traffic simulator.
After a VANET message has been received, it is
propagated through the protocol stack until it arrives
at the application layer. Within the ETSI ITS frame-
work, part of the application layer is located in the so
called facility layer. It contains a dedicated facility
entity for each message type, e.g., the basic service
for CAMs. After a message has been processed by
its respective facility entity, it is handed over to the
so called Local Dynamic Map (LDM). The LDM en-
tity is standardised by ETSI ITS in (ETSI 895, 2014)
and it is meant to store all received messages until its
validity time expires. It hands over the stored data to
all data sinks which have registered for the correspon-
ding message type. Our first component for informa-
tion processing is the data fusion, which registers as a
data sink at the LDM.
A trajectory provider is used to model the tra-
jectory of a vehicle, either the ego vehicle or every
one of the other vehicles within its vicinity. Thereby,
trajectories can be modelled in various ways. Most
common trajectory representations are a sequence of
points, which are usually observed positions along the
driven path and for the predicted behavior in the fu-
ture (Ziegler et al., 2014). For trajectory modelling
splines are popular in the automotive domain, because
they resemble smooth trajectories satisfying the de-
manded constraints. They can also be used for trajec-
tory planning in collision avoidance scenarios (Madas
et al., 2013). Splines are used to approximate and
interpolate the vehicle’s trajectory as a continuous
function. If several points of a function can be mea-
sured, the approximation is done by calculating poly-
nomials between the known points. Depending on
the degree of the polynomials, continuous gradients
and curvatures can be chosen as boundary conditions.
Therefore, a smooth and continuous function can be
achieved. As splines do not oscillate at their bounda-
ries they can be used to get an accurate estimation of
the function in the near future, where no positions are
known yet. One disadvantage is, that the interpolation
has to be recalculated every time a new position value
is obtained (Huckle et al., 2014).
A further important component for our evaluation
environment is the data recorder. It connects to all the
defined interfaces during initialization phase of the
framework. At runtime, it records all the input data
streams together with a time stamp of the recording
time for each entry. To have this synchronized input
data of one driving scenario available is very useful
for the offline evaluation of the ADAS applications.
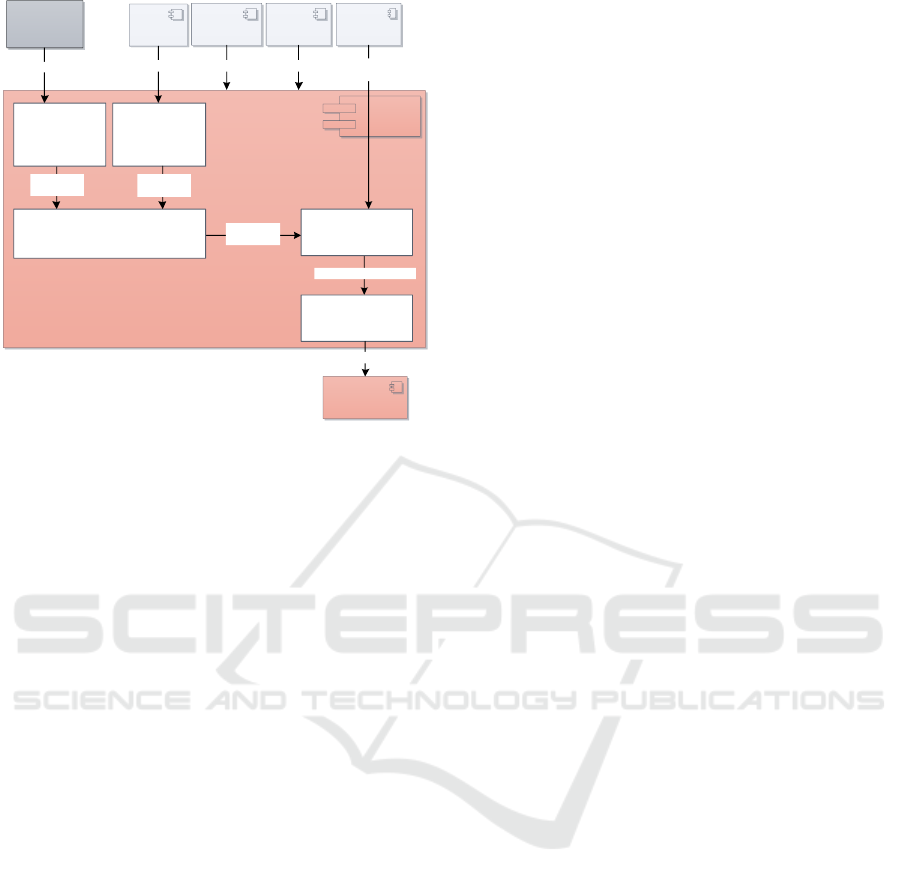
3.2 General Purpose Information
Processing
Most safety critical applications of VANETs account
for collision avoidance systems with a low amount of
exceptions, like broken down vehicle warning (ETSI
638, 2015). They all are based on the VANET proto-
col stack. The analysis of requirements for such col-
lision avoidance systems shows that advanced infor-
mation processing is very similar for many of them.
Thus, we define a basic set of common information
processing blocks to be used by all these ADAS.
The information processing chain is illustrated in
Figure 2 and described in the following. Details about
the actually chosen methods for our dedicated evalu-
ation can be found in Section 4.1.
The object sensors data messages are pre-
processed in the corresponding component. Likewise,
the received CAMs are pre-processed in the V2X data
pre-processing component. Both components result
in local object lists D
R
and D
V
with exactly the same
format. These object lists are the input data for the
data fusion and vehicle tracking function that genera-
tes a global object list D
G
with all detected vehicles in
the vicinity of the ego vehicle. To compare the evalu-
ation results of the object sensor based ADAS and the
VANET based application, the data fusion component
can also handle each class of input data separately.
Then, for each object in D
G
the trajectory agent cre-
ates a new trajectory provider or updates the existing
one with the new position data for the dedicated ob-
An Evaluation Methodology for VANET Applications Combining Simulation and Multi-sensor Experiments
217
ADAS
Application
Object
Sensor
Radar data
LDM
CAMs
Time Provider
Position
Provider
Trajectory
Provider
Object / Ego
Trajectory
Positions Timestamp
Object List DG + Trajectory
(sensor local)
Object List DR
Object Sensor
Preprocessing
(global)
Object List DG
V2X Data
Preprocessing
Datafusion
(
sensor local
)
Object List DV
Trajectory Agent
Collision Detection
HMI
Warning Message
Figure 2: Information processing chain for an ADAS.
ject. The trajectory agent itself offers an interface to
subscribe for the object list D
G
that also delivers the
associated trajectory provider for each object. Finally,
the collision detection entity which subscribed to D
G
,
receives every update of the list. If necessary, a war-
ning message is issued, that is displayed on the human
machine interface (HMI).
The object sensor data pre-processing has two
main tasks. The first one is to filter all object sensor
messages and only pass those with detected objects.
The second task is to transform the object’s position
data so that it relates to the vehicle’s reference posi-
tion (in the centre of the front bumper) and not to the
object sensor’s mounting position any more. The re-
lative position of each object sensor in relation to the
reference position has to be measured very accurately
and is statically configured for every test vehicle.
Within the LDM, CAMs are already filtered ac-
cording to their relevance for the ego vehicle and their
validity time. In addition, the purpose of the V2X
data pre-processing differs from the object data in the
case of position transformation. In a first step, the
absolute GPS position is transformed into a relative
distance to the ego vehicle’s reference position. This
step is required to further process the object sensor
and V2X data in a similar way within a Cartesian co-
ordinate system. This transformation produces a de-
viation, due to the nature of the coordinate system.
Thus, this transformation should only be performed
once at the beginning of the processing chain.
The next step is to spatio-temporally align the
V2X data with the ego vehicles current time and posi-
tion. As described in (Stiller et al., 2007), a trajectory
prediction has to be performed for the time span of
the communication delay of each received message
from another vehicle, which results in a (predicted)
position at this juncture. The communication delay is
calculated by the difference of the generation time of
the message and the current time stamp of the ego ve-
hicle. The precondition for this spatio temporal align-
ment is that the time basis of all vehicles are synchro-
nized, for example by using GPS time.
Multiple realization possibilities exist for vehicle
trackers. An important example is multi hypothesis
tracking (MHT) (Blackman, 2004), which is a well
established approach for multi-target tracking. The
main advantage of MHT is to solve observation-to-
track conflicts by holding alternative data associa-
tion hypotheses and propagating them into the future.
Thereby, subsequent data can resolve the uncertainty.
The trajectory agent is meant to manage all trajec-
tory providers generated from D
G
. It holds an internal
hash map with an entry for each object together with
a link to the corresponding trajectory provider. With
each update of the object list the hash map is searched
for all objects. If one can not be found, a new tra-
jectory provider is generated. Otherwise, the existing
one is updated with the new position. For all entries
of the hash map that are not available in D
G
any more
the corresponding trajectory providers are destructed.
Collision detection can be done by using motion
prediction models like trajectory prediction, state-
space models, structured environment approximation,
classification models or neural networks. (Christo-
pher et al., 2009) gives an overview on existing ap-
proaches for collision risk estimation.
As already depicted in Figure 2, the processing
of the ADAS based reference application and the
V2X application only differs in the pre-processing
steps. One reason for this architecture decision was
to achieve comparability of both applications during
validation phase. More precisely, the object sensor
for radar data and the V2X receiver have the same
tasks: to decode and filter the incoming messages.
One delaying factor is the data access within the
LDM, though it is compensated by the spatio tempo-
ral alignment in the V2X data pre-processing com-
ponent. Only the transformation algorithm used in
the object sensor and the spatio temporal alignment
within the V2X data pre-processing have a varying
impact on the precision of the objects position. Since,
the transformation is based on the exactly determined
distance of the mounted radar and the ego vehicles
reference position it is accurate to a millimeter and
therefore the inaccuracy is negligible. Thus, the im-
pact of the processing steps on the evaluation results
can be reduced to the accuracy of the algorithm used
for the spatio temporal alignment of the V2X data.
VEHITS 2016 - International Conference on Vehicle Technology and Intelligent Transport Systems
218

4 EVALUATION REALIZATION
Since all required components and interfaces within
the ITS communication architecture are already spec-
ified in the ETSI ITS standards, like (ETSI 636-4,
2014), (ETSI 894-2, 2014) and (ETSI 895, 2014), we
used our dedicated ETSI ITS framework called ez-
Car2X (Roscher et al., 2013) that implements these
standards. Also, the facilities for the position and time
providers are located within the ezCar2X framework.
Only the sensor data received at the CAN interface
is handed over to the responding components of the
ADAS applications.
Usage of the evaluation methodology from Sec-
tion 3 for the evaluation of two dedicated ADASs
(ICRW and LCRW) is described in the following.
4.1 Evaluation Environments
Our design goal was to generate the smallest possi-
ble effort for a change between the simulation envi-
ronment and the real test vehicles. So we optimized
the software architecture regarding the reusability of
most of the components in both environments. To ob-
tain the required flexibility, all interfaces to external
entities are realized with abstract classes and diffe-
rent implementations. For example, three implemen-
tations are used for GPS/GNSS and V2X input: file
(i.e. playback), real hardware, simulation based.
According to (ETSI 894-2, 2014; ETSI 636-4,
2014) all time stamps within the protocol stack have
to be aligned to their respective GPS coordinates.
Thus, the ezCar2X position and time providers were
implemented in a coupled way ensuring mutual con-
sistency of both time and position data.
In our trajectory provider we used cubic splines
with third order polynomials from (Kluge, 2011) for
the prediction of all trajectories. The forecasting hori-
zon of the trajectory providers was set to 10 seconds,
but only the next 2 seconds were considered within
the collision risk estimation, as the number of false
detections increases with a longer time span.
The vehicle tracker uses the MHT approach as de-
scribed in (Streit et al., 1995). It is implemented using
the library from (GTMS, 2003) for vehicle tracking,
using the Dempster-Shafer theory of evidence.
In our collision detector implementation, we use
trajectory prediction and combine it with a piece-
wise approximation of the trajectories as described in
(Lytrivis et al., 2014). Therefore, the two trajectories
of ego and other vehicle are examined in each time
step of the prediction period. A bounding box is ge-
nerated around each vehicle’s reference position using
its width and length (taken from the vehicle’s CAM)
(ETSI 637-2, 2014). Additionally, for the V2X data
the bounding box has to be expanded by adding the
current uncertainty of the GPS position (also taken
from the CAM) in a circular shape. This expansion
is justified by the nature of GPS positions, which are
defined as a position and a circular region around it.
Within that circle, 95 % of the measured positions are
located. Thus, a GPS position should not be taken as
an exact value. Instead, the whole confidence circle
has to be considered during collision detection. The
bounding boxes increase with the degradation of the
position accuracy. Finally, the two bounding boxes
are used to identify whether they overlap. If this is the
case, a collision is detected and a warning message is
generated, which is displayed on the HMI.
Our simulation environment is described in Sec-
tion 4.1.1. Afterwards, Section 4.1.2 gives details
about the field test setup. Finally, the tracing and play-
back mechanism is introduced in Section 4.1.3.
4.1.1 Simulation Environment
We use a simulation environment consisting of three
dedicated state of the art frameworks. These are
SUMO for microscopic traffic flow simulation, the
ns-3 network simulator for channel as well as layer
1 and 2 simulation, together with the ezCar2X frame-
work providing the remaining protocol layers in ac-
cordance with current ETSI ITS standards (Behrisch
et al., 2011; Riley and Henderson, 2010; Roscher
et al., 2013). A detailed description of this combi-
nation of dedicated tools and their coupling process
can be found in (Roscher et al., 2014).
Vehicles’ position information within the simula-
tion environment is perfect, i.e., each vehicle can de-
termine its global position without any error. Posi-
tions of other vehicles are only known from received
messages. Therefore, Gaussian noise is added to the
positions generated in the traffic simulation to study
the impact of position uncertainty.
SUMO can be run in parallel or in advance of
the remaining simulators. Running it in advance and
using generated vehicle traces for the other simula-
tors significantly increases simulation speed. How-
ever, this can only be done for use cases with no in-
teraction between ADAS output and vehicle behavior,
as vehicle trajectories are fixed in this case. For exam-
ple, this can be done to determine the time of issued
warnings. Therefore, the input data for an ADAS, as
described in Section 3.1, is then derived from the out-
put file of the SUMO traffic simulator. One of the ve-
hicles within the traffic scenario is defined as the ego
vehicle whose positions are then passed to the posi-
tion interface for the ego position provider.
Two options for receiving position information
An Evaluation Methodology for VANET Applications Combining Simulation and Multi-sensor Experiments
219
from other vehicles were realized. To obtain a best
case scenario (i.e. no packet loss), the positions of
all other vehicles are handled as received CAMs at
the ITS-G5 interface. This models the best possible
information quality for the ADAS. A more realistic
option is to use the ns-3 channel simulation to model
real message exchange. Corresponding radar data can
be obtained from a radar sensor model within the sim-
ulation environment.
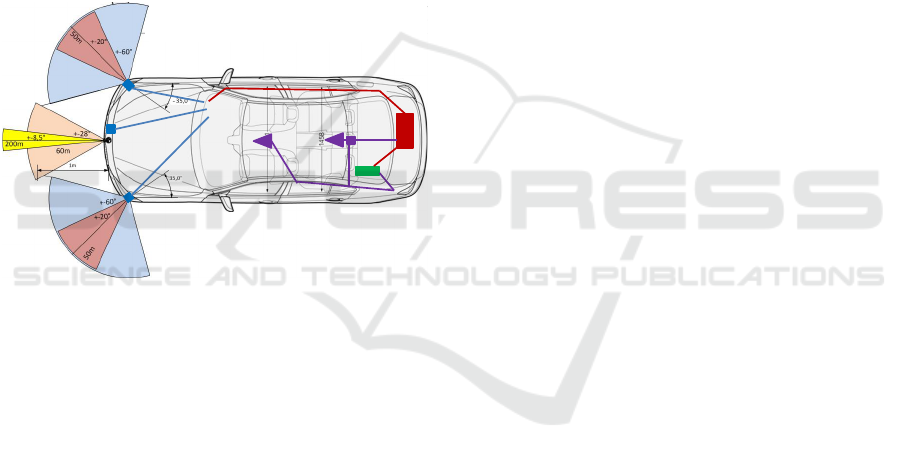
4.1.2 Real World Test Setup
As described above, our aim is to evaluate ADAS
avoiding front or side collisions, (ETSI 539-2, 2013)
and (ETSI 539-3, 2013). Thus, the test vehicle is
equipped with three radar sensors acting as object
sensors as illustrated in Figure 3.
CAN
Interface
SRR
SRR
LRR
Power
supply
Multi-
Antenna
ITSG5
Box
textetevcgvsdfjbfabdfjabjfddabfbdjhbfjsbdfhbjhafbdhjajsdaf
bshdbfjasdfja
textetevcgvsdfjbfabdfjabjfddabfbdjhbfjsbdfhbjhafbdhjajsdaf
bshdbfjasdfja
textetevcgvsdfjbfabdfjabjfddabfbdjhbfjsbdfhbjhafbdhjajsdaf
bshdbfjasdfja
Figure 3: Test vehicle equipment and radar sensor coverage.
Radar sensors where chosen due to their wide
spread usage for automotive applications. They en-
sure robust object detection, a high resolution and
measurement accuracy. The Long Range Radar
(LRR) is placed in front of the vehicle to cover the
forward-facing street over a distance of 200 meters.
The two Short Range Radars (SRR) face to the front-
left and front-right with an angle of 35 degrees from
the longitudinal axis of the vehicle. The SRRs have
shorter coverage of about 50 meters, but a wider input
opening angle of 60 degree coverage. All three radars
were connected via CAN buses to the notebook run-
ning the software framework and ADAS.
The test vehicle was additionally equipped with
two multi-antennas for VANET communication
within the 5,9 GHz frequency band, an ITS-G5 com-
pliant communication box from Cohda Wireless (Co-
hda, 2013) and a dual-frequency GNSS software re-
ceiver that was also connected to the notebook.
In the test scenario a second vehicle was involved
that was equally equipped, except for one front LRR.
To identify the impact of the position accuracy on the
VANET based ICRW scenario the following test sce-
nario was used: the ego vehicle approaches an inter-
section with a constant velocity where the last pos-
sible stop line is marked with a pylon. Afterwards,
the ego vehicle is going back to the start position and
repeats the maneuver. The second test vehicle ap-
proaches the intersection from the left direction in the
first run and from the right direction in the second run.
This scenario is repeated several times to have compa-
rable sensor data and to compensate possible effects
caused by a deviant driver behavior. Thereby, the sce-
nario produces two collision situations that were de-
tected by the radar based reference implementation.
We look at pure GNSS based positioning as we
use no extra data input, i.e. via a mobile network.
During the test, information on the satellites’ posi-
tion and pseudo ranges were collected. This informa-
tion was recorded by the GNSS software receiver of
each test vehicle. The rtklib (Takasu, 2009) was then
applied, to determine the vehicle’s position and the
corresponding accuracy in post-processing. To this
end, the information from the GNSS software receiver
and from a second GNSS receiver, installed about
100 meters next to the test place at a position with
well known coordinates, were used. These different
position accuracies for the same test scenario were
recorded to have a varying position accuracy available
during post-processing for evaluation purposes.
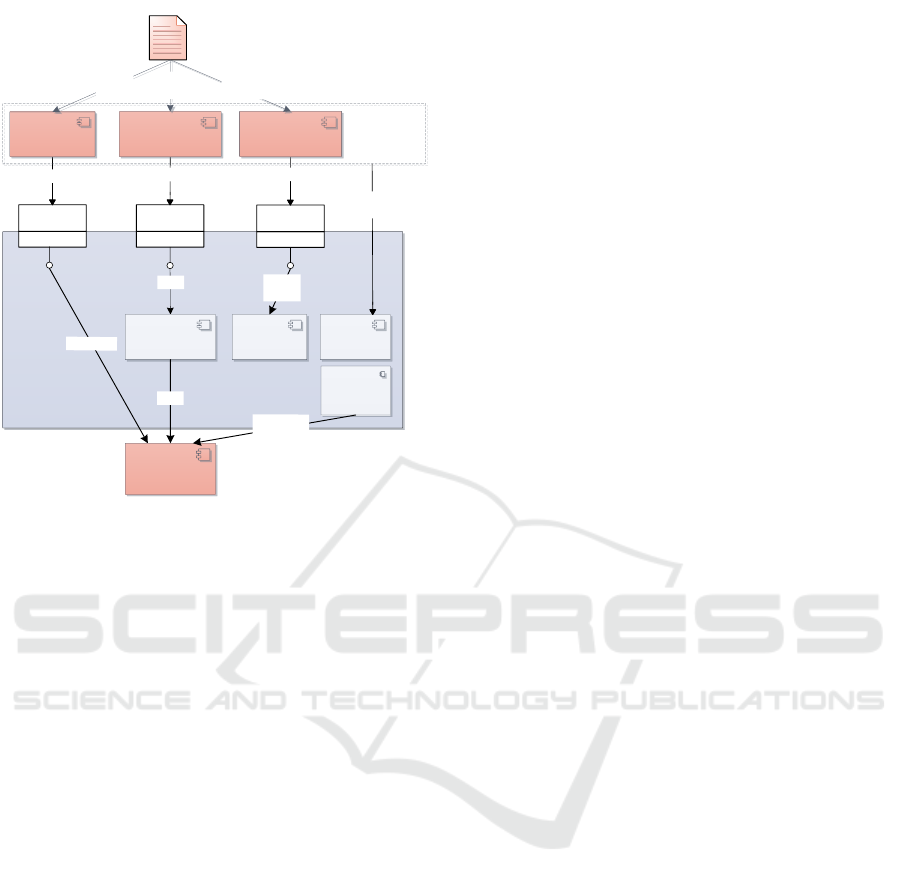
4.1.3 Offline Testing Environment
One main advantage of our software architecture ap-
proach is the possibility to integrate data player com-
ponents for all sensor data recorded in a field test.
Data sets are synchronized and can be used for off-
line evaluation of enhancements within the applica-
tion. Figure 4 shows the playback architecture that
only differs in the software components for data input
to the simulation and evaluation environment.
The software architecture, which was already de-
scribed in Section 3.1, is reused for synchronized off-
line playback together with another set of data input
components. For each one of the radar data, ITS-G5
messages and position data stream a playback compo-
nent was implemented. These components read one
data block out of the recorded stream and replay the
data on their corresponding interface on the exact time
offset as recorded. All the player components regis-
ter at a central signal handler during the initialization
phase of the software framework. When all compo-
nents are ready the RUN signal is send which guaran-
tees a synchronized start of the playback.
Thereby, the playback architecture provides an
offline testing environment where small changes of
the ADAS application implementations can be tested
VEHITS 2016 - International Conference on Vehicle Technology and Intelligent Transport Systems
220
«interface»
ITSG5
CAMs
«interface»
Bus
Radar Objects
V2X Messages
Radar Data
ADAS
Application
[T], [P]
LDM
[T], [P]
CAMs
ITS communication
system
[T] Time
Provider
[P] Position
Provider
GNSS
Position
«interface»
GNSS
GNSS Position
Trajectory
Provider
[T], [P]
Object
/
Ego
Trajectory
Synchronized
Playback
Synchronized
Playback
Recorded Test Data
File CAM Facility
File Radar
Sensor
File GPS Sensor
„Radar“
Streams
„ITSG
5
“
Stream
„Position“
Stream
Playback
Time
Figure 4: Synchronized information flow within the play-
back architecture used as offline evaluation environment.
under consistent conditions for a realistic driving sce-
nario with much lower effort as for a test drive and
much faster evaluation speed as the playback system
doesn’t have to run in real time. All components after
the data player are executed in multiple threads, like
done in live testing mode.
4.1.4 Reference System
To compare the evaluated collision detection system
with the radar based reference system the following
reference values were examined:
1. Difference in the time of collision detection t
Di f f
2. Distance of the ego and second vehicle at the time
of collision detection d
3. Number of false (positive and negative) detections
# false pos and # false neg
The time of collision detection is used to deter-
mine the time lag for the V2X based ADAS in com-
parison to the radar based reference system. If a col-
lision was detected by the V2X based ADAS, the dif-
ference of the two reference positions (in the centre
of the front bumper) of the ego and the second vehicle
is calculated and compared to the distance measured
by the reference system at the time when the colli-
sion was detected. The third criteria is a very com-
mon benchmark for collision detection systems, that
counts the false positive and false negative detections
compared to the reference system.
4.2 Evaluation Results
The evaluation results for the analyzed performance
aspects are discussed in the next sections.
4.2.1 Position Accuracy Availability
For the driven test scenario described in 4.1.2 we
recorded two different position data sets: the pure
GPS data and the GPS data with a reduced ionosphere
effect (by incorporation of the measurement from the
additional GNSS receiver). The pure GPS data had
a minimum accuracy of 7,58 m, maximum accuracy
of 20,39 m and the average value was 14,41 m. The
GNSS with reduced ionosphere effects had the same
values for minimum and maximum accuracy and an
average position accuracy of 13,7 m.
It is important to note, that the GNSS software re-
ceiver was configured to achieve a high integrity level
for the vehicle’s position, which is crucial in the con-
text of collision avoidance. If the provided integrity
is too low, the ADAS system might suffer from false
alarms. Thus, narrow radio frequency filters are ap-
plied within the GNSS receiver to block interfering
signals and frequency shifted multi-path effects. As
mentioned before, this helps to gain a higher integrity
level, but may reduce the number of used satellites.
The smaller the number of satellites, the worse the
achieved position accuracy. The number of satellites
in view further suffered from shadowing by trees and
a building, which encircled the test area.
4.2.2 End-to-End Delay
During our test we also analysed the end-to-end delay
that is calculated by the offset of the CAM generation
time at the sender and the recording time at the re-
ceiver, which is equal to the time when the input data
is available at the ADAS application. At the sender, a
new CAM is generated as soon as the position is up-
dated. The update frequency of our position solution
was 1 Hz. For the ego vehicle we identified the fol-
lowing delay: minimum 14 milliseconds, maximum
1.001 second and an average delay of 127 ms. The
second vehicle obtained a minimum of 14 ms, maxi-
mum of 510 ms and an average delay of 70 ms.
End-to-end delay is used in the V2X data pre-
processing component, as described in Section 3.2,
for the spatio temporal alignment of the second vehi-
cle’s position. As this mechanism is meant to predict
the vehicle status for the timespan of the communica-
tion delay, the impact of this end-to-end delay on the
ADAS application is reduced to a minimum. In de-
tail, the impact depends on two factors: the accuracy
An Evaluation Methodology for VANET Applications Combining Simulation and Multi-sensor Experiments
221
of the prediction mechanism itself and the accuracy
of the position data used to calculate the prediction.
4.2.3 Impact of the Position Accuracy
The accuracy of the communicated positions has to
be considered within collision detection. Thus, the
position can not be taken as an exact value the appli-
cability of V2X data input strongly depends on the
position accuracy received from other vehicles. As
described in 4.1, the bounding boxes of the ego and
second vehicle used for collision risk estimation are
expanded by adding the current uncertainty of the po-
sition value. Thus, collisions were detected earlier as
in the reference system, but with less reliability. The
difference can be quantified by the position accuracy
value itself. To cope with lower position accuracy, ad-
vanced approaches for the usage of bounding boxes
during collision risk estimation have to be examined.
4.2.4 Analysis of the V2X based ADAS
The accuracy of the ego and other positions were var-
ied during the test runs in the playback environment
to analyze the impact of the ego and second vehicle’s
position accuracy separately. The ego position confi-
dence was set to 0.25 m during one set of test runs,
since this is equal to the measurement accuracy of the
used radar sensors, and also to the originally derived
value in a second test setup. Respectively, the con-
fidence of the second vehicle was set to 0.25 m and
again to the recorded value in separate test runs.
We analysed the results from numerous test runs
and found, that the best combination of weights for
the ego and the second vehicle’s position accuracy is
to take the confidence for the second vehicle from the
CAM and a fixed value of 0.25 m for the ego vehicle.
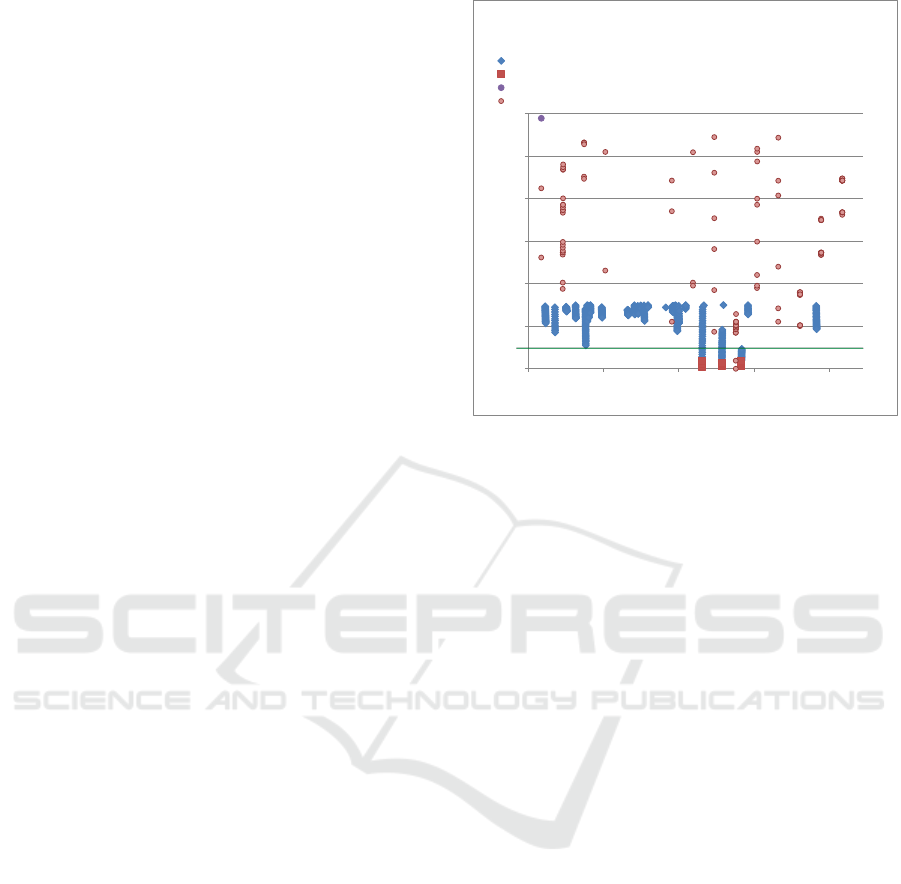
The resulting collision detection within the ADAS is
then depicted in Figure 5 for the radar reference sys-
tem and the V2X based detection.
At the horizontal axis, the diagram shows the
chronological sequence of the results for the driven
test scenario. A detected collision based on radar data
is marked with rectangular shapes. The results of the
V2X communication based detection are labeled with
circular shapes. The collision scenario with the sec-
ond vehicle approaching from right hand side can be
recognized in the middle of the sequence for the re-
ference system. The one collision situation was de-
tected over a period of three prediction steps by the
reference system. Future positions of the ego vehicle
and the second vehicle are predicted every 100 mil-
liseconds for a timespan of 2 seconds into the future.
The vertical axis of the diagram represents the pre-
dicted future distance between the reference positions
Auswirkungen gemischter Systeme [closed]
© Fraunhofer ESK
www.esk.fraunhofer.de
Seite 12/27
4.1 Kollisionsberechnung mit O: cam, E: 0.25 (ICRW von rechts)
In den Abbildung 5 wird der Vergleich der C2X basierten Kollisionserkennung mit dem Wert für
die Object Position Accuracy aus der empfangenen CAM und der Ego Position Accuracy von
0,25 m und die Radar-Referenzdaten dargestellt. Die folgende Abbildung 5 stellt die
Auswertung des ICRW Szenarios von rechts dar.
Abbildung 5: Vergleich der Radar- und C2X-basierten Kollisionserkennung (DGNSS O:cam
E:0.25) für das Szenario ICRW (von rechts)
Zeitpunkt der Kollisionserkennung
Der Zeitpunkt zwischen der ersten Kollisionserkennung mithilfe der Radardaten und der ersten
Erkennung durch C2X kommunizierte Daten beträgt:
t
Diff
= 1,739 Sekunden
0
0,5
1
1,5
2
2,5
3
0:01:13,440 0:01:17,328 0:01:21,216 0:01:25,104 0:01:28,992
Distance to the point of collision [m]
Chronological sequence of the scenario [h:mm:ss,000]
ICRW (right) - comparison of radar and V2X data
(DGNSS O:CAM E:0,25)
Radardaten - Distanzen (< 0,75m) ohne Kollisionen; keine stehenden Objekte
Radardaten - Distanzen erkannter Kollisionen
CAMs_Ocam5_E025 - Distanzen (<3,0 m) ohne Kollision
CAMs_Ocam_E025 - Distanzen erkannter Kollisionen
Radar data – distance (<0.75 m) without collisions
Radar data – distance of detected collisions
CAMs (O:cam, E:0.25) – distance (<3.0 m) without collisions
CAMs (O:cam, E:0.25) – distance of detected collision
Figure 5: Comparison of radar and V2X based ADAS.
of the ego and the second vehicle in case of a pre-
dicted collision of their bounding boxes. Since the
distances measured by the radar sensors have a much
higher accuracy, we took only distances less than 0.75
m into account for the illustration of the results from
the radar based collision detection.
As marked with an extra line at 0.25 m in Figure 5,
we added a threshold for the distance of the reference
positions of the ego and second vehicle. Thereby, a
detected collision by V2X data is only incorporated,
if the predicted distance in the future is less than 0.25
m. We recommend to use this threshold as one extra
element in a V2X based ADAS to decide whether a
warning message is actually passed to the driver. This
threshold would reduce the number of false positive
collision detections but is does not compensate the
low position accuracy.
By means of the defined benchmark parameters,
the V2X based collision detection achieved the fol-
lowing results: t
Di f f
is at 1.74 seconds, d = 5.65 cen-
timeters, # false pos = 0 and # false neg = 2. The
two false negative detections represent the delay of
the V2X based application. During a detected colli-
sion, the distance of the two reference positions of the
ego and the second vehicle goes below the defined
threshold not before the third prediction step of the
reference system. Since the collision situation ends
after this third step, it is only detected once by the
V2X based application.
VEHITS 2016 - International Conference on Vehicle Technology and Intelligent Transport Systems
222

5 CONCLUSIONS AND FUTURE
WORK
VANETs are in the wake of mass roll out within up-
coming years. To fulfill the aim of increased safety
of driving, advanced methodologies for development
and evaluation of VANET based ADAS are required.
The proposed methodology, which is based on the
concept of simulation driven development, can be
used to realize an evaluation environment incorpo-
rating simulation, real world tests and offline test-
ing. Therefore, our approach is optimized to keep the
effort to a minimum when switching between these
three environments.
Moreover, we evaluated available position accu-
racy of today’s GNSS systems. Thereby, our results
show that the position accuracy of pure GNSS is not
sufficiently high, in order to provide location data
for every driving situation with a quality that enables
safe VANET based collision avoidance applications.
Thus, we propose to incorporate further positioning
solutions, i.e. differential GNSS or relative position-
ing approaches, to improve the position accuracy.
To achieve a wider range of test scenarios within
the evaluation environment future work could fo-
cus on integrated test scenarios for the evaluation of
ADAS applications, such as the availability of sim-
ulated traffic information in real test drives. An-
other open research topic is to examine advanced al-
gorithms for the usage of the bounding boxes during
collision risk estimation, as outlined in Section 4.2.3.
Future work will also include an extended eva-
luation towards positioning systems using extra sen-
sors, like acceleration sensors, and to implement fur-
ther VANET applications. The goal is to evaluate the
correlation between the position accuracy and safety
related VANET based applications.
ACKNOWLEDGMENT
Presented results were obtained during the project
“M
¨
oglichkeiten und Grenzen des Multi-GNSS RAIM
f
¨
ur zuk
¨
unftige Safety-of-Life Anwendungen” (Multi
RAIM II), funded by the German Federal Ministry
of Economics and Technology (BMWi) and admin-
istered by the Project Management Agency for Aero-
nautics Research of the German Space Agency (DLR)
in Bonn, Germany (grant no. 50NA1313).
REFERENCES
MoU (2011). Memorandum of Understanding within the
CAR 2 CAR Communication Consortium on Deploy-
ment Strategy for cooperative ITS in Europe. V
4.0102.
ETSI EN 101 539-1 (2013). Intelligent Transport Systems
(ITS); V2X Applications; Part 1: Road Hazard Sig-
nalling (RHS) application requirements specification.
V1.1.1.
ETSI EN 101 539-2 (2013). Intelligent Transport Systems;
V2X Applications; Part 2: Intersection Collision Risk
Warning (ICRW) application requirements specifica-
tion. V0.0.7.
ETSI EN 101 539-3 (2013). Intelligent Transport Sys-
tems; V2X Applications; Part 3: Longitudinal Colli-
sion Risk Warning (LCRW) application requirements
specification. V1.1.1.
ETSI EN 102 894-2 (2014). Intelligent Transport Systems;
Users and applications requirements; Part 2: Appli-
cations and facilities layer common data dictionary.
V1.2.1.
ETSI EN 102 638 (2015). Intelligent Transport Systems;
Vehicular Communications; Basic Set of Applica-
tions; Use case definitions. V1.1.4.
ETSI EN 302 895 (2014). Intelligent Transport Systems;
Vehicular Communications; Basic Set of Applica-
tions; Local Dynamic Map (LDM). V1.1.1.
ETSI EN 302 636-4-1 (2014). Intelligent Transport Sys-
tems; Vehicular Communications; GeoNetworking;
Part 4: Geographical Addressing and Forwarding for
Point-to-Point and Point-to-Multipoint Communica-
tions; Sub-part 1: Media-Independent Functionality.
V1.2.1.
ETSI EN 302 637-2 (2014). Intelligent Transport Sys-
tems; Vehicular Communications; Basic Set of Appli-
cations; Part 2: Specification of Cooperative Aware-
ness Basic Service. V1.3.2.
Beck, K. (2002). Test Driven Development: By Example.
Addison-Wesley Longman.
Behrisch, M., Bieker, L., Erdmann, J., and Krajzewicz, D.
(2011). SUMO - Simulation of Urban MObility: An
Overview. In The Third International Conference on
Advances in System Simulation, pages 63–68.
Berger, C. and Rumpe, B. (2012). Engineering Autonomous
Driving Software. In Experience from the DARPA Ur-
ban Challenge. Springer, pages 243–272.
Blackman, S. S. (2004). Multiple Hypothesis Tracking for
Multiple Target Tracking. IEEE Aerospace and Elec-
tronic Systems Magazine, 19(1):5–18.
Broggi, A. et al. (2012). High Performance Multi-
Track Recording System for Automotive Applica-
tions. In International Journal of Automotive Tech-
nology, 13(1):pages 123–132.
Chrisofakis, E., Junghanns, A., Kehrer, C., and Rink, A.
(2011). Simulation-based development of automotive
control software with Modelica. In 8th International
Modelica Conference, pages 20–22.
Cohda Wireless (2013). MK4a V2X Evaluation Kit. online:
http://cohdawireless.com/Portals/0/PDFs/CohdaWire
lessMK4a.pdf. accessed: 28.10.2015.
An Evaluation Methodology for VANET Applications Combining Simulation and Multi-sensor Experiments
223

Christopher, T. (2009). Analysis of dynamic scenes: Ap-
plication to driving assistance. Doctoral dissertation,
Institut National Polytechnique de Grenoble-INPG.
Hanzlik, A. (2013). Simulation-based Application Software
Development in Time-Triggered Communication Sys-
tems. International Journal of Software Engineering
& Applications, 4(2):75–92.
Harding, J., Powell, G. R., Yoon, R. F., J., Doyle, C.,
Sade, D., Lukuc, M., Simons, J., and Wang, J. (2014).
Vehicle-to-Vehicle Communications: Readiness of
V2V Technology for Application. Technical Report
DOT HS 812 014, Washington, DC: National High-
way Traffic Safety Administration.
Hofmann-Wellenhof, B. and Lichtenegger, H. and Wasle, E.
(2007). GNSS – Global Navigation Satellite Systems:
GPS, GLONASS, Galileo, and more. Springer.
Huckle, T. and Schneider, S. (2006). Numerische Meth-
oden: Eine Einf
¨
uhrung f
¨
ur Informatiker, Naturwis-
senschaftler, Ingenieure und Mathematiker. Springer
Berlin Heidelberg, 2nd edition.
Joerer, S., Segata, M., Bloessl, B., Cigno, R. L., Som-
mer, C., and Dressler, F. (2012). To crash or not
to crash: Estimating its likelihood and potentials of
beacon-based IVC systems. IEEE Vehicular Network-
ing Conference (VNC), pages 25–32.
Kaplan, E.D. and Hegarty, C.J. (2005). Understanding GPS:
Principles and Applications. Artech House mobile
communications series, Artech House.
Kluge, T. (2011). Library for Cubic Spline in-
terpolation in C++. online: http://kluge.in-
chemnitz.de/opensource/spline/. accessed:
06.11.2015.
Lytrivis, P., Thomaidis, G. and Amditis, A. (2008). Co-
operative path prediction in vehicular environments.
In 11th International Conference on Intelligent Trans-
portation Systems (ITSC), pages 803–808.
Madas, D., Nosratinia, M., Keshavarz, M., Sundstrom, P.,
Philippsen, R., Eidehall, A. and Dahlen, K. M. (2013).
On path planning methods for automotive collision
avoidance. In Intelligent Vehicles Symposium (IV),
pages 931–937.
Misra, P. and Enge, P. (2001). Global positioning system:
signals, measurements, and performance. Ganga-
Jamuna Press.
Navipedia (2015). The collaborative GNSS encyclopae-
dia. online: http://www.navipedia.net. accessed:
06.11.2015.
Riley, G. F. and Henderson, T. R. (2010). The ns-3 Network
Simulator. In Wehrle, K., G
¨
unes, M., and Gross, J.,
editors, Modeling and Tools for Network Simulation,
pages 15–34. Springer Berlin Heidelberg.
M. Rondinone et al (2013). iTETRIS: A modular simulation
platform for the large scale evaluation of cooperative
ITS applications. In Simulation Modelling Practice
and Theory 34, pages 99–125.
Roscher, K., Bittl, S., Gonzalez, A. A., Myrtus, M., and
Jiru, J. (2014). ezCar2X: Rapid-Prototyping of Com-
munication Technologies and Cooperative ITS Appli-
cations on Real Targets and Inside Simulation Envi-
ronments. In 11th Conference Wireless Communica-
tion and Information, pages 51 – 62.
Roscher, K., Jiru, J., Gonzalez, A., and Heidrich, W. (2013).
ezCar2X: A Modular Software Framework for Rapid
Prototyping of C2X Applications. In 9th ITS Euro-
pean Congress.
Sharp, G., Lin, P.-C., and Komsuoglu, H. (2003).
Ground Truth Measurement System. online:
http://www.sourceforge.net/projects/gtms. accessed:
01.10.2015.
Sommer, C., German, R., and Dressler, F. (2011). Bidi-
rectionally coupled network and road traffic simula-
tion for improved IVC analysis. IEEE Transactions
on Mobile Computing, 10.1: pages 3–15.
B. Strasser et al. (2010). Networking of test and simula-
tion methods for the development of advanced driver
assistance systems (ADAS). In 4. Tagung Sicherheit
durch Fahrerassistenz.
Takasu, T. (2009). RTKLIB: Open Source Program Package
for RTK-GPS, FOSS4G.
Stiller, C., Frber, G. and Kammel, S. (2007). Cooperative
cognitive automobiles. In IEEE Intelligent Vehicles
Symposium, pages 215–220.
Streit, R. L., and Luginbuhl, T. E. (1995). Probabilistic
multi-hypothesis tracking. Naval Underwater Systems
Center Newport RI.
Tan, H.-S., and Huang, J. (2006). DGPS-based vehicle-
to-vehicle cooperative collision warning: Engineering
feasibility viewpoints. IEEE Transactions on Intelli-
gent Transportation Systems, 7.4: pages 415–428.
Voigtl
¨
ander, P. (2008). ADTF: Framework for Driver Assis-
tance and Safety Systems. In FISTA World Automotive
Congress.
Wegener, A., Pi
´
orkowski, M., Raya, M., Hellbr
¨
uck, H., Fis-
cher, S. and Hubaux, J.-P. (2008). TraCI: An Inter-
face for Coupling Road Traffic and Network Simula-
tors. 11th Communications and Networking Simula-
tion Symposium, pages 155–163.
Winner, H. and Hakuli, S. and Wolf, G. (2009). Hand-
buch Fahrerassistenzsysteme: Grundlagen, Kompo-
nenten und Systeme f
¨
ur aktive Sicherheit und Kom-
fort. ATZ/MTZ-Fachbuch, Vieweg+Teubner Verlag.
Yan, G., Olariu, S., and Weigle, M. C. (2008). Provid-
ing VANET Security through Active Position Detec-
tion. Computer Communications, Mobility Protocols
for ITS/VANET, 31(12):2883–2897.
Ziegler, J., Bender, P., Dang, T. and Stiller, C. (2014).
Trajectory planning for Bertha A local, continuous
method. In Intelligent Vehicles Symposium Proceed-
ings, pages 450–457.
VEHITS 2016 - International Conference on Vehicle Technology and Intelligent Transport Systems
224
