
Utilizing Plug-in Electric Vehicles for Peak Shaving and Valley
Filling in Non-residential Buildings with Solar Photovoltaic Systems
Konstantinos N. Genikomsakis
1
, Benjamin Bocquier
2
, Sergio Lopez
3
and Christos S. Ioakimidis
4
1
DeustoTech Energy, University of Deusto, Avenida de las Universidades 24, Bilbao, Spain
2
Icam Nantes, 35 Avenue du Champ de Manoeuvre, Carquefou, France
3
Department of Industrial Technologies, University of Deusto, Avenida de las Universidades 24, Bilbao, Spain
4
ERA Chair Holder ‘Net-Zero Energy Efficiency on City Districts’, Research Institute for Energy, University of Mons,
56 Rue de l'Épargne, Mons, Belgium
Keywords: Forecasting, Non-residential Building, Peak Shaving, Photovoltaic, Plug-in Electric Vehicle, Solar Power,
Valley Filling.
Abstract: This paper examines the concept of utilizing plug-in electric vehicles (PEVs) and solar photovoltaic (PV)
systems in large non-residential buildings for peak shaving and valley filling the power consumption profile,
given that the energy cost of commercial electricity customers typically depends on both actual
consumption and peak power demand within the billing period. Specifically, it describes a hybrid approach
that combines an artificial neural network (ANN) for solar irradiance forecasting with a MATLAB/Simulink
model to simulate the power output of solar PV systems, as well as the development of a mathematical
model to control the charging/discharging process of the PEVs. The results obtained from simulating the
case of the power consumption of a university building, along with experimental parking occupancy data
from a university parking lot, demonstrate the applicability and effectiveness of the proposed approach.
1 INTRODUCTION
Despite the fact that the high use of private cars,
combined with low vehicle occupancy, is known to
have negative impact on the quality of life and cause
serious environmental and social problems (Katzev,
2003; Wolfler Calvo et al., 2004), passenger cars are
still the dominant mode of transportation on land
across the EU, representing some 79.9% of all
passenger kilometres in 2012 (European
Commission, 2014). On the one hand, with the
renewed interest in electro-mobility, the
reintroduction of electric vehicles (EVs) in the
market has the potential to significantly reduce the
environmental impact of transportation activities. On
the other hand, passenger cars are largely
underutilized with respect to their primary purpose.
Kempton and Tomić (2005) estimate that personal
vehicles are typically used for less than 5% of the
time for transportation, hence plug-in electric
vehicles (PEVs) are potential candidates for
secondary applications in electricity markets while
parked, such as provision of peak power, spinning
reserves, and regulation to the grid through the
vehicle-to-grid (V2G) concept. Towards the
realization of the vision of the future smart grid
(Güngör et al., 2011), PEVs play a key role as an
energy storage resource to the grid and intelligently
interact with the electric utilities (Cheng et al.,
2014).
In this direction, the potential of the PEVs to
serve as a dispatchable load and provide power
system services, such as valley filling and peak load
reduction, has received particular attention in the
scientific literature (Brooks et al., 2010; Tie and Tan
2013). Indicative examples include an intelligent
charging scheme for PEVs to significantly reduce
the power system cost (Valentine et al., 2011), a
protocol for coordinating the charging of PEVs with
the electric grid (Zhang et al., 2014), as well as a
strategy based on a V2G control algorithm for peak
shaving and valley filling of grid power (Wang and
Wang, 2013). In this regard, the large scale
deployment of PEVs can leverage the penetration of
renewable energy sources (RES) into the power
system (Gerbelová et al., 2013; Mwasilu et al.,
Genikomsakis, K., Bocquier, B., Lopez, S. and Ioakimidis, C.
Utilizing Plug-in Electric Vehicles for Peak Shaving and Valley Filling in Non-residential Buildings with Solar Photovoltaic Systems.
In Proceedings of the 5th International Conference on Smart Cities and Green ICT Systems (SMARTGREENS 2016), pages 179-188
ISBN: 978-989-758-184-7
Copyright
c
2016 by SCITEPRESS – Science and Technology Publications, Lda. All rights reserved
179
2014).
At building level, in particular in residential or
small commercial ones, the integration of RES and
PEVs with capability to exchange electricity bi-
directionally (i.e., charge and discharge) has been
shown to allow for more efficient energy
management decisions (Genikomsakis et al., 2013;
Ioakimidis et al., 2014b). In this respect, forecasting
of the RES output ahead of time (e.g., with a time
horizon of 24 h), either in the form of solar power
(Ioakimidis et al., 2013), wind power (Ioakimidis et
al., 2014a; Ioakimidis et al., 2015) or both, is
beneficial for the home energy management systems
of the so-called electricity “prosumers”, which are
capable of not only consuming, but also producing
and storing electricity (Grijalva and Tariq, 2011).
This paper considers the case of valley filling
and peak reduction services by integrating PEVs and
RES in large non-residential buildings in the context
of vehicle-to-building (V2B), as a representative
example of a commercial electricity customer where
the energy cost depends on the actual usage
(consumption), as well as on the peak power demand
within the billing period. To this end, the present
work combines an artificial neural network (ANN)
with a MATLAB/Simulink model to forecast the
output of a solar photovoltaic (PV) system and
describes the development of a mathematical model
for peak shaving and valley filling the consumption
profile under the presence of PEVs, using as a case
study the consumption characteristics of a university
building, along with parking occupancy data from a
university parking lot. In this context, the main
contribution of this paper is to provide the integrated
framework for the simulation of the system under
study and the optimization of its operation, as well
as to examine a number of scenarios representing
different system configurations and assess the
potential output by applying the proposed approach
on real-world data from field measurements and
consumption profiles.
2 METHODOLOGY
This section presents the methodology followed to
develop the mathematical model for peak shaving
and valley filling the building’s consumption profile,
starting from the solar irradiance forecasting model,
which provides input to a MATLAB/Simulink
model to simulate the output of solar PV modules.
2.1 Forecasting of Solar Irradiance
As an intermediate step of forecasting the power
output of solar PV systems, the present work
employs the ANN proposed by Ioakimidis et al.
(2013) in order to forecast the solar irradiance for
the next 24 h. The reason for considering this
specific model for forecasting solar irradiance is
three-fold: i) it is suitable both for sunny and cloudy
days, ii) it combines forecasting accuracy with
computational efficiency, and iii) it is validated with
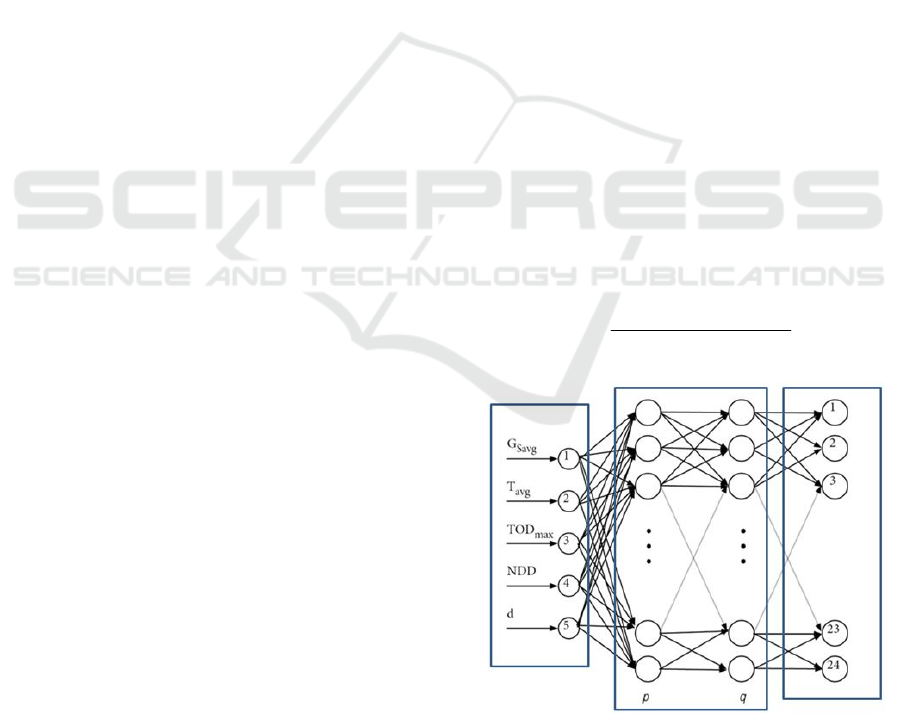
field measurement data. The key characteristic of
this approach is the use of statistical feature
parameters in the multilayer perceptron (MLP). The
structure of the feed-forward ANN employed
includes 2 hidden layers (Figure 1), with p=12 and
q=16 neurons respectively, while the input vector
consists of the following factors: (i) the average
solar irradiance G
Savg
in the last 24 h, (ii) the average
temperature T
avg
in the last 24 h, (iii) the maximum
of the third order difference of solar irradiance
TOD
max
, (iv) the normalized discrete difference
NDD between the surface and extraterrestrial
irradiance, and (v) the day of the year d. The output
layer is a vector of 24 components representing the
forecasted solar irradiance for the next 24 h.
The datasets for training the ANN are
normalized in the interval [-1,1] using equation (1),
where y
min
equals -1, y
max
equals 1, while x
max
and
x
min
are the maximum and minimum values in each
dataset.
min
max min
min
max min
yyxx
yy
xx
(1)
Figure 1: Structure of the ANN-based model for solar
irradiance forecasting.
The forecast of solar irradiance for a period of 6
SMARTGREENS 2016 - 5th International Conference on Smart Cities and Green ICT Systems
180

days (using a resolution of 24 hourly values) in the
area under study in Bilbao, Spain, is illustrated in
Figure 2.
2.2 Simulation Model of PV Output
For the purposes of this work, the simulation of the
solar PV output is based on the model proposed by
Pandiarajan and Muthu (2011). More specifically, a
PV cell is represented with the equivalent electrical
circuit in Figure 3, thus its output current I is given
in equation (2).
ph d sh
II I I
(2)
where I
ph
is the cell photocurrent, I
d
is the diode
current and I
sh
is the shunt current. The relation
between the cell parameters, output current I and
output voltage V is expressed in the characteristic
equation (3).
0
()
exp 1
p
ss
sh
h
qV IR V IR
nkT
I
R
II
(3)
where I
0
is the reverse saturation current, q is the
elementary charge, R
s
is the series resistance, n is the
diode ideality factor, k is the Boltzmann's constant, T
is the absolute temperature, and R
sh
is the shunt
resistance.
PV cells are combined together to form PV
modules, while the latter are inter-connected in
larger assemblies to form PV panels. In this work,
the model that describes the operation of an
assembly of N
p
cells in parallel and N
s
cells in series
is mathematically expressed in equations (4)-(7).
Specifically, equation (4) expresses the module
photocurrent I
PH
:
( 298)
1000
PH SCr i
IIKT
(4)
where I
SCr
is the PV module short-circuit current (at
25 °C and 1000 W/m
2
), K
i
is the short-circuit current
temperature co-efficient at I
SCr
, and λ is the PV
module illumination.
Equation (5) expresses the module reverse
saturation current I
RS
:
exp 1
SCr
RS
S
oc
I
I
qV
NkAT
(5)
where V
oc
is the open-circuit voltage and A is an
ideality factor.
Figure 2: Example output of forecasted solar irradiance
with the ANN-based model.
Figure 3: Equivalent circuit of a PV cell.
Equation (6) expresses the module saturation
current I
0
:
0
3
0
11
()exp
g
RS
rr
qE
T
II
TBkTT
(6)
where E
g0
is the band gap for silicon (= 1.1 eV), T
r
is
the reference temperature (= 298 °K), and B is an
ideality factor.
The module output current I
PV
is given in
equation (7):
0
exp 1
PV PV S
PV P PH P
S
qV I R
ININI
NAkT
(7)
where V
PV
is the output voltage and R
S
is the series
resistance of the PV module.
The aforementioned equations that describe the
operation of a PV module were modelled in
MATLAB/Simulink, as proposed by Pandiarajan
and Muthu (2011), with basic modifications to adapt
the model according to the specifications and
requirements of the present work. Indicatively,
Figure 4 illustrates the high-level representation of a
PV system model in MATLAB/Simulink, while
Figure 5 shows the output power of a single PV
module with N
P
= 1 cell and N
S
= 50 cells.
Utilizing Plug-in Electric Vehicles for Peak Shaving and Valley Filling in Non-residential Buildings with Solar Photovoltaic Systems
181
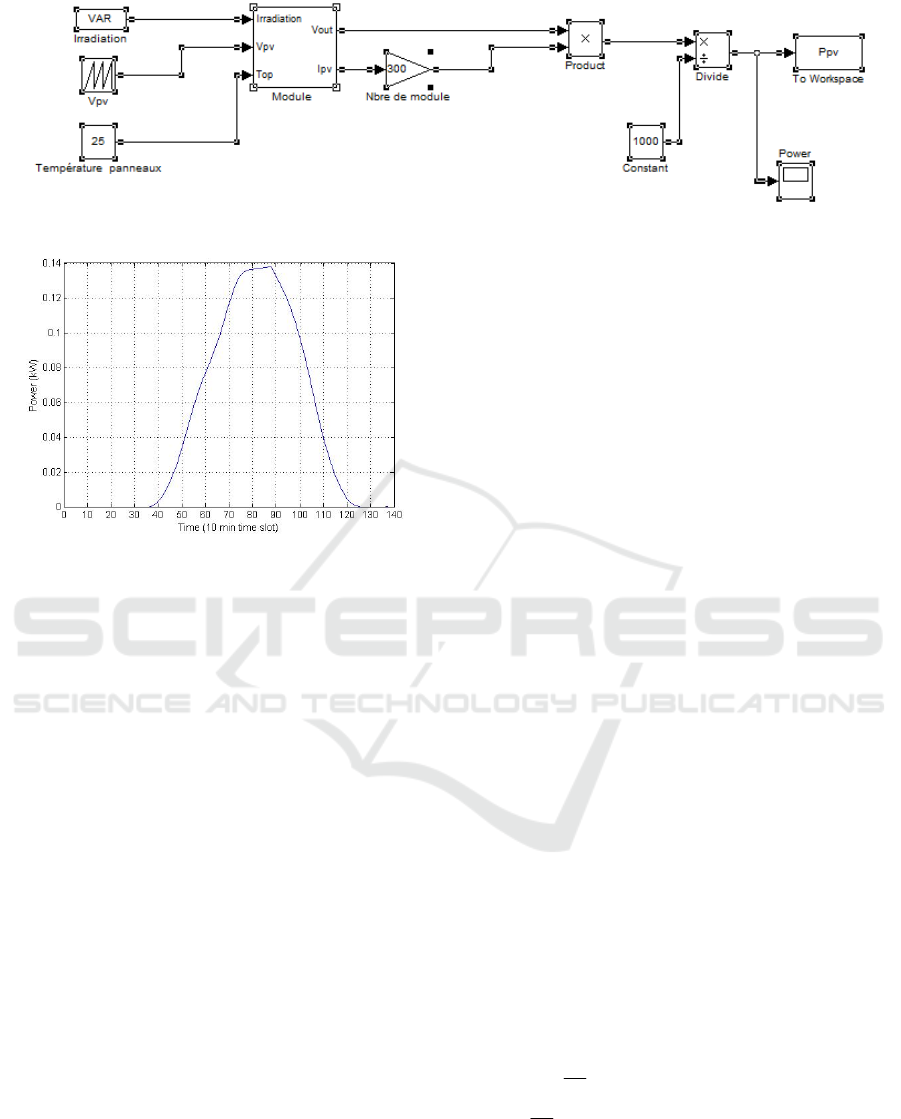
Figure 4: Model of PV system in MATLAB/Simulink.
Figure 5: Power output of 1 PV module.
2.3 Mathematical Model for Peak
Shaving and Valley Filling of
Power Consumption using PEVs
This subsection considers the charging and
discharging process of PEVs for a period of 1 day,
divided evenly in N intervals, based on the approach
proposed by He et al. (2012). The interval length τ is
chosen equal to 10 min, while the charging or
discharging power in each interval i is assumed to be
constant. Let also m denote a vehicle in the set of
vehicles M charging and discharging over the day.
By convention, it is assumed that the charging or
discharging power x
mi
, for each m
M and i
N, is
negative during discharging and positive during
charging of the PEV battery. Assuming a slow
charging process, the constraint imposed by the
charging station on the maximum charging or
discharging power p
max
is expressed in (8).
max max
,
mi
pxp mM
(8)
A PEV m may charge and discharge during a
period T
m
, defined by the time of arrival t
m
arr
and
time of departure t
m
dep
to/from the parking lot of the
building. To this end, the presence of the PEV is
denoted by f
mi
as defined in equation (9).
1 if interval is in period
0otherwise
m
mi
iT
f
(9)
Let y
i
be the load of charging/discharging the
PEVs in interval i, as given in equation (10).
imimi
mM
y
xf
(10)
Moreover, let E
m
ini
be the initial energy of the
PEV battery, E
m
cap
be its capacity (assumed equal to
24 kWh), and E
Tm+1
be the battery energy required
for the next trip of the PEV (assumed to be provided
by the user of the vehicle). The final energy of the
PEV battery E
m
fin
at the end of the charging period
T
m
is expressed in (11).
1
, ,
fin ini
m m mi mi T
m
iN
E
ExfEmMiN
(11)
In addition, the lower and upper bounds of the
energy during the charging/discharging process of
the PEV battery are expressed in (12), i.e. the battery
energy cannot be less than 0 and cannot exceed its
capacity (He et al., 2012), where Q(i) denotes the set
of intervals prior to interval i.
()
0 , ,
ini cap
mmkmkm
kQi
E
xf E m M i N
(12)
The constraint in (13) specifies that the energy
charged to the PEV battery at the end of the period
T
m
is at least equal to that discharged from the
battery during T
m
, while the constraint in (14)
ensures that the energy exchange takes place only
when PEVs are present (parked).
0,
mi mi
iN
x
fmM
(13)
0 , ,
mi mi
x
fmMiN
(14)
where
mi
f
is the binary complement of f
mi
.
Furthermore, it is assumed that Pu
i
denotes the
power consumption of the building in the interval i,
and C is the constant defined in equation (15).
SMARTGREENS 2016 - 5th International Conference on Smart Cities and Green ICT Systems
182
max( ) min( ) / 2
ii
CPuPu
(15)
Mathematically, the objective of peak shaving
and valley filling the curve of the building’s power
consumption, while taking into the load y
i
from the
charging/discharging process of the PEVs and the
power output Ppv
i
from the PV system in each
interval i, is formulated in (16). For the purposes of
this work, this optimization problem is solved in
MATLAB using the fmincon solver.
2
Minimize ( )
iN
ii i
zPuyPpvC
(16)
3 SIMULATION AND RESULTS
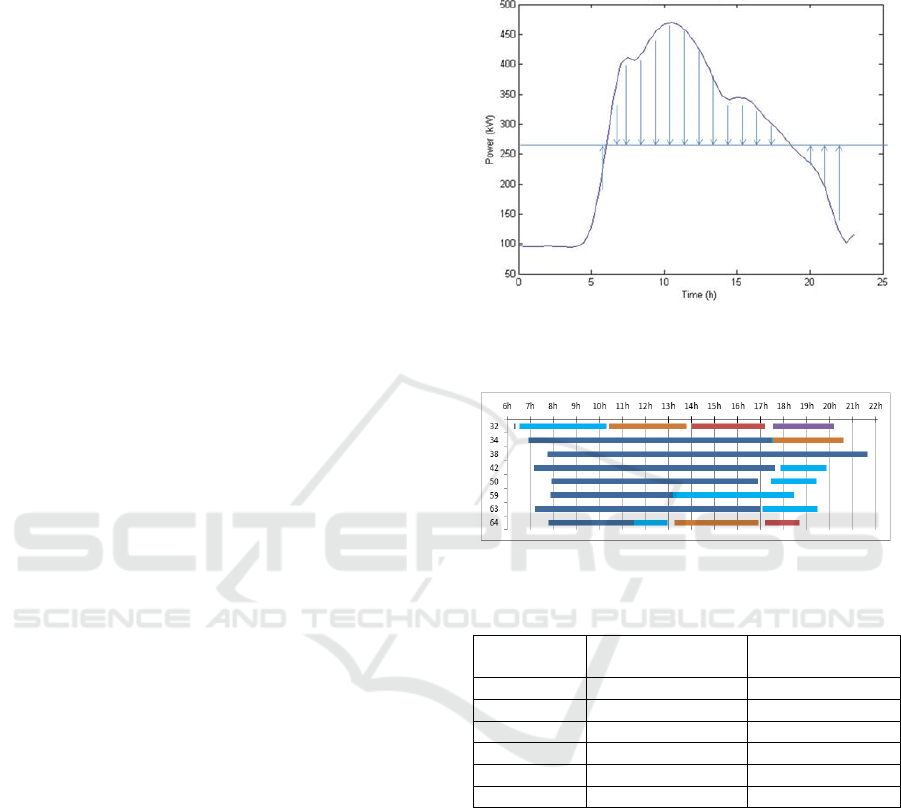
As a case study, the present work considers the
power consumption curve of a building at the
campus of University of Deusto, Spain. The aim is
to simulate the impact of controlling the
charging/discharging process of (potentially parked)
PEVs in order to flatten the power consumption
curve, as shown in Figure 6, by taking into account
real-world profiles of parking occupancy from
conventional cars at a university parking lot.
3.1 Simulation Setting and Scenarios
The developed model is employed to examine six
scenarios for different number of PEVs and PV
modules. Table 1 shows the configuration of the six
scenarios under study.
The required data for the parking occupancy of
PEVs were obtained from a field experiment, where
a team of participants recorded the parking spot
(place) and time of (conventional) cars at a specific
parking lot of the university campus, having a
capacity of 65 cars (Genikomsakis et al., 2015).
Indicatively, the occupancy of the 8 (randomly
chosen) parking spots employed for scenarios 1 and
2 is illustrated in Figure 7, where the colored bars
denote the time of presence of the different vehicles
(horizontal axis) at each parking spot (vertical axis).
3.2 Simulation Results
The simulations were carried out in MATLAB on
the basis of the scenarios defined in the previous
subsection. As already pointed out, it is assumed that
the PEVs can discharge their battery to provide
power to the building and reduce its power
consumption, whereas they add extra load to the
power consumption of the building when they
charge their battery. Figures 8 and 9 illustrate the
obtained results of the scenarios 1 and 2
respectively.
Figure 6: Power consumption curve of the building under
study for a typical winter day.
Figure 7: Occupancy of 8 randomly chosen parking spots.
Table 1: Overview of the six simulated scenarios.
Scenario Number of parking
spots
Number of PV
modules
1 8 300
2 8 600
3 35 300
4 35 600
5 65 300
6 65 600
As a first observation, the results of scenarios 1
and 2 indicate that the impact of the available PEVs
at the 8 parking spots on the power consumption
curve of the building is rather low. Nevertheless,
there is a more pronounced effect when considering
both the contribution of PEVs and the PV
production. As expected, the contribution of the PV
system becomes higher during midday hours when
the PV production reaches its peak.
Figure 9 shows that the power consumption
curve of the building is peak shaved between 7:00
am and 12:00 pm. After this period, the charging of
PEVs causes the red curve representing the final
power consumption to cross the green curve
representing the building power consumption minus
Utilizing Plug-in Electric Vehicles for Peak Shaving and Valley Filling in Non-residential Buildings with Solar Photovoltaic Systems
183
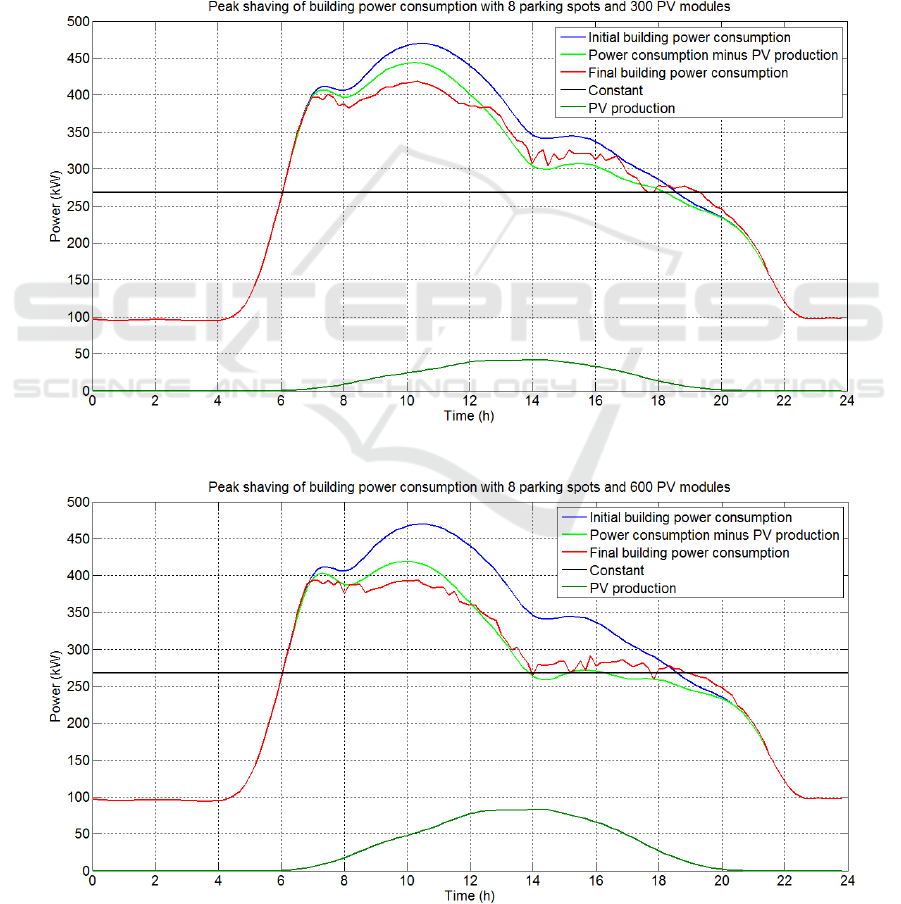
the photovoltaic power production. Moreover, the
final power consumption curve does not cross the
initial power consumption curve (in blue color) until
6:30 pm, indicating that the PV production is enough
to cover the charging of the PEVs for this period. At
the end of the day, after 6:30 pm, the final
consumption is slightly higher or equal to the initial
consumption.
Figures 10 and 11 illustrate the results obtained
for scenarios 3 and 4, where the number of available
parking spots for charging/discharging the PEVs
amounts to 35, while the number of simulated PV
modules is 300 and 600 units respectively. The
increase of the available PEVs flattens the power
consumption curve of the building, approaching the
target constant as a result of the improved valley
filling and peak shaving. The majority of the PEVs
discharge at peak power consumption and charge
when the building’s power consumption is at lower
levels.
When the PV production is doubled (Figure 11),
the valley filling effect becomes more intense.
Moreover, the effect of lowering the power
consumption curve of the building takes place
mostly between noon and 3:00 pm (compared to
scenario 3), where the PV production is at its highest
Figure 8: Scenario 1 results.
Figure 9: Scenario 2 results.
SMARTGREENS 2016 - 5th International Conference on Smart Cities and Green ICT Systems
184
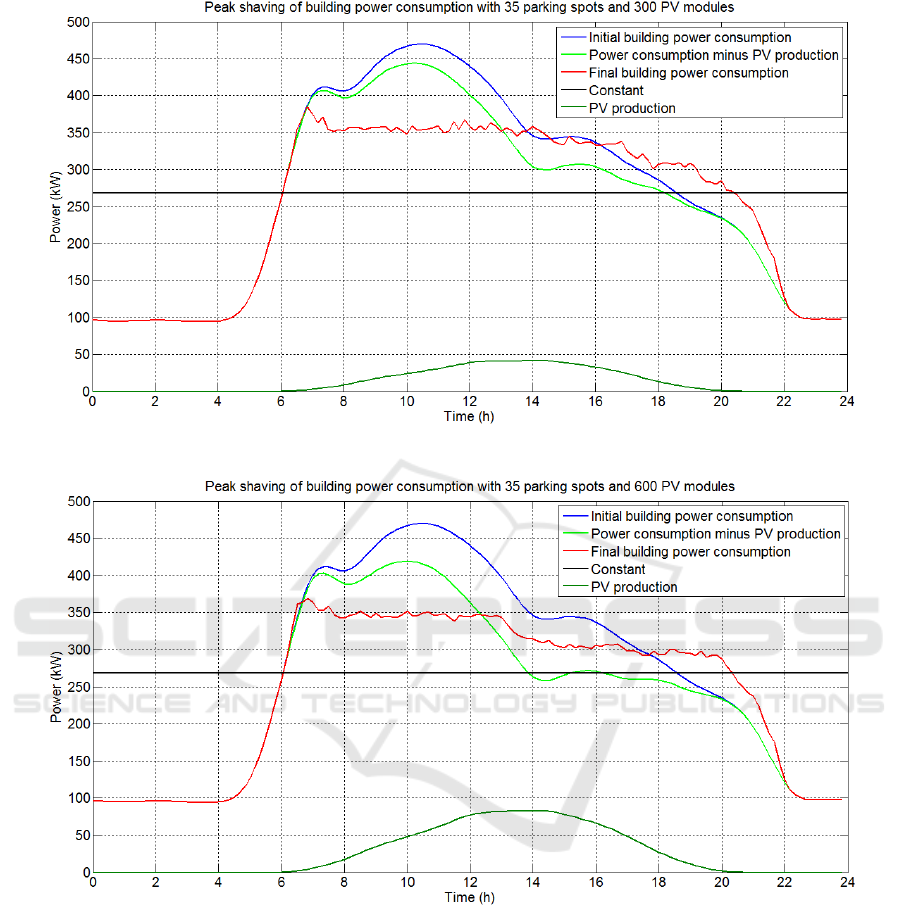
Figure 10: Scenario 3 results.
Figure 11: Scenario 4 results.
level. The roughness of the final consumption curve
is mainly due to the randomness of the
charging/discharging process of the PEVs.
The results of scenarios 5 and 6 are depicted in
Figures 12 and 13. Specifically, the last two
scenarios consider 65 available parking spots for
charging/discharging of PEVs. In both cases, the
results reveal that the number of PEVs is high
enough to regulate by themselves the power
consumption of the building, with the PV production
contributing to a lesser extent to the smoothing of
the final consumption curve. It is obvious that in
scenarios 5 and 6, the final curve of the building
consumption is almost flat, resulting in effective
peak shaving and valley filling. In particular, it
remains almost at the same level from 6:00 am until
8:00 pm by shifting the charging of the PEVs, more
notably after 4:00 pm, where the initial power
consumption curve of the building would decrease
further.
In Figure 13, which illustrates the simulation
results for the last scenario considering 600 PV
modules, the pattern of the final consumption curve
presents no significant changes (compared to
Utilizing Plug-in Electric Vehicles for Peak Shaving and Valley Filling in Non-residential Buildings with Solar Photovoltaic Systems
185
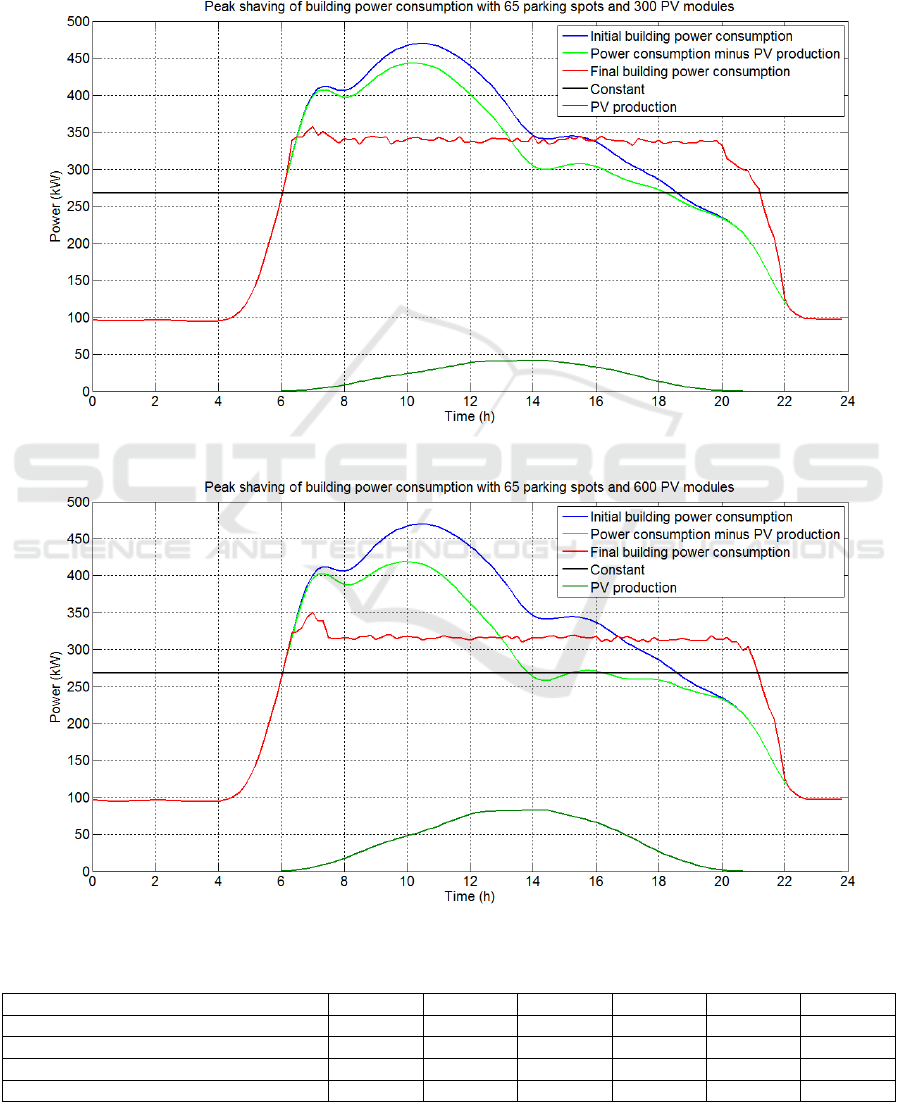
scenario 5), despite the fact that the increased PV
production reduces further the final power
consumption.
Table 2 summarizes the main findings of this
work. As expected, the highest peak shaving occurs
under scenario 6. The high number of available
PEVs at the 65 parking spots in combination with
the high additional energy contribution of the 600
PV modules, offers enough flexibility to the system
resulting in more than 25% peak shaving compared
to the initial power consumption of the building. In
addition, it is noted that the power gap with the
Figure 12: Scenario 5 results.
Figure 13: Scenario 6 results.
Table 2: Comparative simulation results.
Parking spots 8 8 35 35 65 65
PV modules 300 600 300 600 300 600
Final peak consumption (kW) 420 395 380 370 355 350
Decrease compared to initial peak (%) 10.1 15.4 18.6 20.8 24.0 25.1
Gap with constant C (kW) 152 127 112 102 87 82
SMARTGREENS 2016 - 5th International Conference on Smart Cities and Green ICT Systems
186

reference flat consumption, i.e. constant C, becomes
smaller as the number of available PEVs and PV
modules increases.
4 CONCLUSIONS
This paper examines the impact of PEVs and PV
production as a means of providing peak shaving
and valley filling services in the context of V2B.
More specifically, it employs the profiles of power
consumption and parking occupancy from a building
and a parking lot at University of Deusto, Spain, in
order to provide the required input to the proposed
model and simulate a number of scenarios for the
envisaged system.
To this end, the present paper initially described
the integration of an ANN-based solar irradiance
forecasting model with a MATLAB/Simulink model
to simulate the output of solar PV modules. Next, a
mathematical model was developed and solved in
MATLAB in order to examine and quantitatively
analyze the impact of connected PEVs and PV
production on the power consumption of the
building.
As confirmed also by the simulation results, the
higher the number of available PEVs and PV
modules, the closer the achievable load curve of the
building comes to the target (flat) curve. On the one
hand, the results demonstrate the feasibility of the
peak shaving and valley filling approach proposed in
this paper, and on the other hand, they highlight the
importance of the number of connected vehicles on
its effectiveness.
As a concluding remark, it is noted that this work
employed a deterministic approach to model the
consumption of the building, the presence of PEVs
at the parking lot and the energy of their battery both
in the initial and final state. Hence, directions for
future work include incorporating the uncertainties
in the arrival and parking duration of the PEVs, the
initial and final energy of their battery, as well as the
consumption profile of the building.
REFERENCES
Brooks, A., Lu, E., Reicher, D., Spirakis, C., Weihl, B.,
2010. Demand dispatch. IEEE Power and Energy
Magazine 8(3), pp. 20-29.
Cheng, X., Hu, X., Yang, L., Husain, I., Inoue, K., Krein,
P., Lefevre, R., Li, Y., Nishi, H., Taiber, J.G., Wang,
F.-Y., Zha, Y., Gao, W., Li, Z., 2014. Electrified
vehicles and the smart grid: The ITS perspective.
IEEE Transactions on Intelligent Transportation
Systems 15(4), pp. 1388-1404.
European Commission, 2014. EU transport in figures:
Statistical Pocketbook 2014, pp. 1-138.
Genikomsakis, K. N., Angulo Gutierrez, I., Thomas, D.,
and Ioakimidis, C.S., 2015. Simulation and Design of
a Fast Charging Battery Station in a Parking Lot of an
e-Carsharing System. In Proceedings of the 4th
International Conference on Renewable Energy
Research and Applications, ICRERA 2015.
Genikomsakis, K. N., Ioakimidis, C. S., Eliasstam, H.,
Weingraber, R., Simic, D., 2013. A non-myopic
approach for a domotic battery management system. In
Proceedings of the 39th Annual Conference of the
IEEE Industrial Electronics Society, IECON 2013, pp.
4522-4527.
Gerbelová, H., Genikomsakis, K. N., Ioakimidis, C. S.,
2013. Electric vehicles charging under a G2V and
V2G approach: The case of the portuguese power
system. In Proceedings of the 26th International
Conference on Efficiency, Cost, Optimization,
Simulation and Environmental Impact of Energy
Systems, ECOS 2013.
Grijalva, S., Tariq, M. U., 2011. Prosumer-based smart
grid architecture enables a flat, sustainable electricity
industry. IEEE PES Innovative Smart Grid
Technologies Conference Europe, ISGT Europe.
Güngör, V. C., Sahin, D., Kocak, T., Ergüt, S., Buccella,
C., Cecati, C., Hancke, G.P., 2011. Smart grid
technologies: Communication technologies and
standards. IEEE Transactions on Industrial
Informatics 7(4), pp. 529-539.
He, Y., Venkatesh, B., Guan, L., 2012. Optimal
scheduling for charging and discharging of electric
vehicles. IEEE Transactions on Smart Grid 3(3), pp.
1095-1105.
Ioakimidis, C. S., Genikomsakis, K. N., Dallas, P. I.,
Lopez, S., 2015. Short-term wind speed forecasting
model based on ANN with statistical feature
parameters. In Proceedings of the 41st Annual
Conference of the IEEE Industrial Electronics Society,
IECON 2015, pp. 971-976.
Ioakimidis, C. S., Lopez, S., Genikomsakis, K. N.,
Rycerski, P., Simic, D., 2013. Solar production
forecasting based on irradiance forecasting using
artificial neural networks. In Proceedings of the 39th
Annual Conference of the IEEE Industrial Electronics
Society, IECON 2013, pp. 8121-8126.
Ioakimidis, C. S., Oliveira, L. J., Genikomsakis, K. N.,
2014a. Wind power forecasting in a residential
location as part of the energy box management
decision tool. IEEE Transactions on Industrial
Informatics 10(4), pp. 2103-2111.
Ioakimidis, C. S., Oliveira, L. J., Genikomsakis, K. N.,
Dallas, P. I., 2014b. Design, architecture and
implementation of a residential energy box
management tool in a SmartGrid. Energy 75, pp. 167-
181.
Katzev, R., 2003. Car Sharing: A New Approach to Urban
Transportation Problems. Analyses of Social Issues
Utilizing Plug-in Electric Vehicles for Peak Shaving and Valley Filling in Non-residential Buildings with Solar Photovoltaic Systems
187

and Public Policy 3(1), pp. 65-86.
Kempton, W., Tomić, J., 2005. Vehicle-to-grid power
fundamentals: Calculating capacity and net revenue.
Journal of Power Sources 144(1), pp. 268-279.
Mwasilu, F., Justo, J. J., Kim, E.-K., Do, T. D., Jung, J.-
W., 2014. Electric vehicles and smart grid interaction:
A review on vehicle to grid and renewable energy
sources integration. Renewable and Sustainable
Energy Reviews 34, pp. 501-516.
Pandiarajan, N., Muthu, R., 2011. Mathematical modeling
of photovoltaic module with Simulink. In Proceedings
of the 2011 1st International Conference on Electrical
Energy Systems, ICEES 2011, pp. 258-263.
Tie, S. F., Tan, C. W., 2013. A review of energy sources
and energy management system in electric vehicles.
Renewable and Sustainable Energy Reviews 20, pp.
82-102.
Valentine, K., Temple, W. G., Zhang, K. M., 2011.
Intelligent electric vehicle charging: Rethinking the
valley-fill. Journal of Power Sources 196(24), pp.
10717-10726.
Wang, Z., Wang, S., 2013. Grid power peak shaving and
valley filling using vehicle-to-grid systems. IEEE
Transactions on Power Delivery 28(3), pp. 1822-1829.
Wolfler Calvo, R., de Luigi, F., Haastrup, P., Maniezzo,
V., 2004. A distributed geographic information system
for the daily car pooling problem. Computers and
Operations Research 31(13), pp. 2263-2278.
Zhang, L., Jabbari, F., Brown, T., Samuelsen, S., 2014.
Coordinating plug-in electric vehicle charging with
electric grid: Valley filling and target load following.
Journal of Power Sources 267, pp. 584-597.
SMARTGREENS 2016 - 5th International Conference on Smart Cities and Green ICT Systems
188
