
Detection of Raindrop with Various Shapes on a Windshield
Junki Ishizuka and Kazunori Onoguchi
Hirosaki University, 3 Bunkyo-cho, Hirosaki, Aomori, Japan
Keywords:
ITS, Edge Ratio, Texture Analysis.
Abstract:
This paper presents the method to detect raindrops with various shapes on a windshield from an in-vehicle
single camera. Raindrops on a windshield causes various bad influence for video-based automobile applica-
tions, such as pedestrian detection, lane detection and so on. Therefore, it’s important to understand the state
of the raindrop on a windshield for a driving safety support system or an automatic driving vehicle. Although
conventional methods are considered on isolated spherical raindrops, our method can be applied to raindrops
with various shapes, e.g. a band-like shape. In the daytime, our method detects raindrop candidates by exam-
ining the difference of the blur between the surrounding areas. We uses the ratio of the edge strength extracted
from two kinds of smoothed images as the degree of the blur. At night, bright areas whose intensity does not
change so much are detected as raindrops.
1 INTRODUCTION
Recently, a vehicle equipped with a video camera is
increasing to support safe driving. Since this camera
is usually installed behind the front windshield of a
vehicle, raindrops on a windshield disturbs the visibil-
ity and causes false detection in various video-based
automobile applications. For example, it’s difficult
to detect the preceding vehicle in Fig.1 because this
vehicle blurs by adherent raindrops on a windshield.
For this reason, it’s important to detect raindrops on a
windshield for a driving safety support system or an
autonomous vehicle.
A person can recognize raindrops on a windshield
easily in spite of a background. However, it’s difficult
problem to understand the state of the raindrop from
an image taken through a windshield since a raindrop
mixes with a texture in a background. Moreover, a
raindrop on a windshield blurs because a camera usu-
ally focuses on a background. This makes raindrop
detection more difficult.
Garg and Nayer (Garg and Nayar, 2007) proposed
the method to detect rain streaks in video sequences
using intensity property of rain streaks for the first
time. Since then, various methods containing snow
detection (Barnum et al., 2010) have been proposed.
However, these methods cannot be applied to a rain-
drop on a windshield because they model falling rain-
drops. Although the device which detects a raindrop
on a windshield by an IR sensor has been produced
to activate a windshield wiper automatically, it some-
times makes a wiper malfunction since the detection
region covered by an IR sensor is too narrow to cover
driver’s visibility.
Several methods using a video camera have been
proposed to detect a raindrop on a windshield since
a video camera has wide detection region. Kurihata
et al. (Kurihata et al., 2005) used a subspace method
to extract raindrops. This method created a raindrop
template, so called eigendrops, by PCA from images
and showed good results only in the area with few
textures, such as in the sky. They improved the per-
formance in the high textured area by matching de-
tection result between several frames (Kurihata et al.,
2007). Halimeh et al. (Halimeh and Roser, 2009) pro-
posed the method based on a geometric-photometric
model that described the refractive property of a rain-
drop on a windshield. Although this model assumed
that the shape of a raindrop on a windshield was a
section of a sphere, Sugimoto et al. (Sugimoto et al.,
2012) extended this assumption to a spheroid section.
Liao et al. (Liao et al., 2013) detected raindrops on a
windshield based on three characteristics that a rain-
drop exists in the video frames for a period of time, its
shape is close to an ellipse and it is bright. Nashashibi
et al. (Nashashibi et al., 2010) detected unfocus rain-
drops using the similar characteristics. Eigen et al.
(Eigen et al., 2013) removed small dirt or raindrops
from a corrupt image by predicting a clean output
by convolutional neural network. You et al. (You et
al., 2013) detected a small round area, in which the
Ishizuka, J. and Onoguchi, K.
Detection of Raindrop with Various Shapes on aWindshield.
DOI: 10.5220/0005796004750483
In Proceedings of the 5th International Conference on Pattern Recognition Applications and Methods (ICPRAM 2016), pages 475-483
ISBN: 978-989-758-173-1
Copyright
c
2016 by SCITEPRESS – Science and Technology Publications, Lda. All rights reserved
475
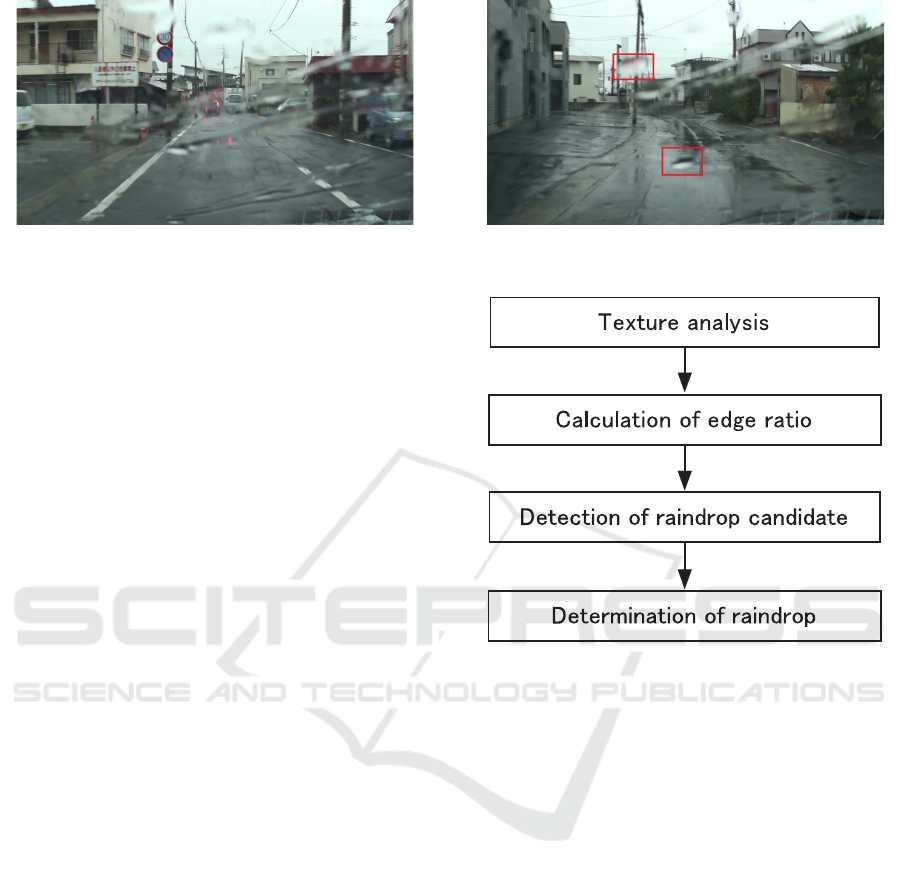
Figure 1: Raindrops on a front windshield of a vehicle.
brightness change was small and the motion was slow,
as a raindrop. Conventional methods described above
are considered on isolated spherical raindrops. How-
ever, when it rains hard, raindrops are connected on a
windshield and show various shapes even if a wind-
shield wiper is activated. As shown in Fig.1, band-
like shapes may appear on a windshield because of
wiping. In this paper, we proposes the method to de-
tect raindrops with various shapes on a windshield in
the daytime and at night. This paper is organized as
follows. Section 2.1 describes the detail for detect-
ing raindrops on a windshield in the daytime. Section
2.2 describes the detail for detecting raindrops on a
windshield at night. Section 3 discusses experimental
results performed to several road scenes. Conclusions
are presented in Sect. 4.
2 RAINDROP DETECTION
METHOD
Different algorithms are used in the daytime and at
night since the appearance of a raindrop is quite dif-
ferent. Our method judges the day or night by the
intensity level of the whole image or an in-vehicle il-
luminance sensor.
2.1 Raindrop Detection in the Daytime
Our method assumes that a raindrop in the daytime
has the bellow characteristics.
1. When the texture of the background is strong,
a raindrop on a windshield blurs more than its
neighbourhood, as shown in the upper red rect-
angle of Fig.2.
2. When the texture of the background is weak, a
raindrop has stronger texture than its neighbour-
hood, as shown in the lower red rectangle of Fig.2,
because an intensity change occurs in the bound-
ary of a raindrop.
Figure 2: Raindrops on textured background and non-
textured background.
Figure 3: Outline of the proposed method.
Our method detects a raindrop by examining the
degree of the blur between a raindrop area and its sur-
rounding area. Figure 3 shows the outline of raindrop
detection method in the daytime. At first, an input im-
age is divided into strong textured areas and weak tex-
tured areas. Next, the ratio of edge strength extracted
from two kinds of smoothed images is calculated as
the degree of the blur. Raindrop candidates are de-
tected from the change of edge ratio. Finally, mis-
detection areas are removed from raindrop candidates
using the characteristic that raindrops on a windshield
don’t move so much. The details of each step are de-
scribed below.
2.1.1 Texture Analysis
An input image is divided into grid blocks B(u, v)
(1 ≤ u ≤ N, 1 ≤ v ≤ M). Texture analysis based on the
edge strength is conducted in each block. In experi-
ments, the image size is 640 × 360 pixels and the size
of each block B(u, v) is 10×10 pixels. Sobel operator
is applied for edge detection and the total of the edge
strength E(u, v) is calculated in each block B(u, v).
B(u, v) is classified into a textured block when E(u, v)
ICPRAM 2016 - International Conference on Pattern Recognition Applications and Methods
476
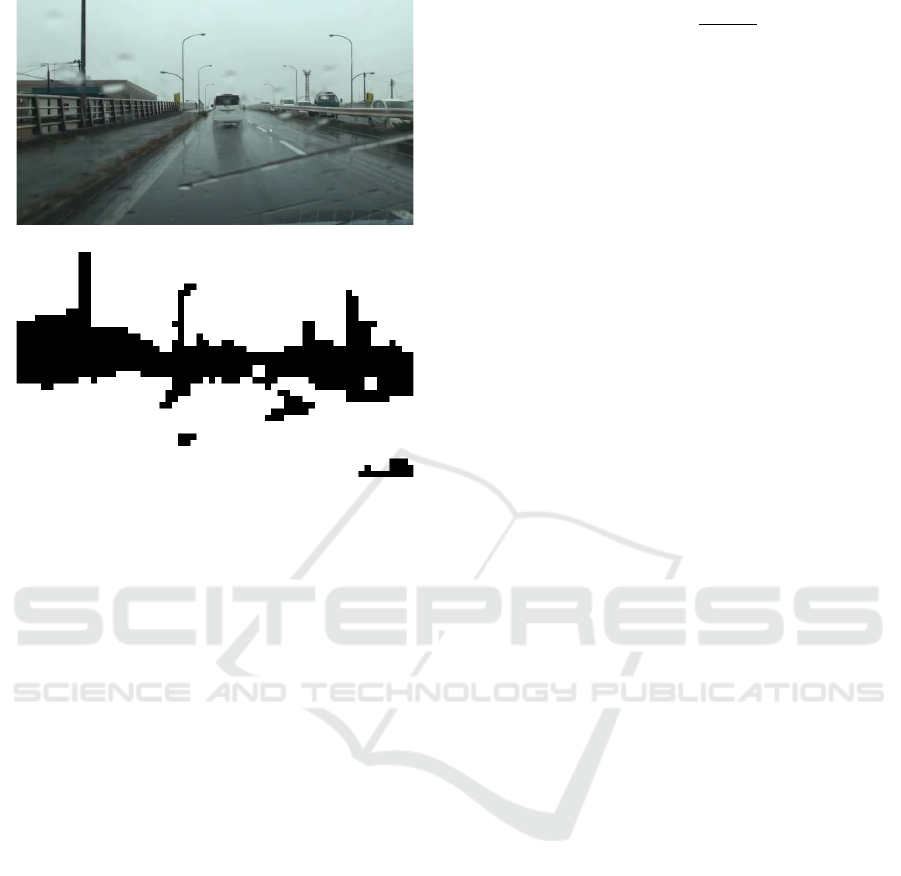
(a) Input image.
(b) Segmentation result.
Figure 4: Textured block and non-textured block.
is larger than T
E
. Otherwise, B(u, v) is classified into
a non-textured block when E(u, v) is smaller than T
E
.
The threshold T
E
is determined so that a road surface
may be included in a non-textured block. Figure 4(b)
shows the example classifying each block into a tex-
tured block and non-textured block. A black block
shows a textured block and a white block shows a
non-textured block.
2.1.2 Detection of Raindrop Candidate
Our method detects raindrop candidates using the
characteristic that the degree of the blur is different
between a raindrop region and its neighbourhood. In
order to measure the degree of the blur without de-
pending on the texture of the background, the ratio of
edge strength extracted from two kinds of smoothed
images is calculated. An input image I(i, j) (1 ≤ i ≤
W, 1 ≤ j ≤ H) is smoothed by the Gaussian filter. Let
I
s1
(i, j) denote an image smoothed by the Gaussian
filter whose variance is σ
1
and let I
s2
(i, j) denote an
image smoothed by the Gaussian filter whose vari-
ance is σ
2
. σ
2
is larger than σ
1
. Edge strength im-
ages I
e1
(i, j) and I
e2
(i, j) are created by applying the
Sobel operator to I
s1
(i, j) and I
s2
(i, j). Edge strength
greatly changes by smoothing in the area where the
texture is clear. On the other hand, the change of the
edge strength is small in the area where the texture
blurs. The degree of the blur D
b
(i, j) at the pixel (i, j)
is defined by
D
b
(i, j) =
I
e1
(i, j)
I
e2
(i, j)
(1)
D
b
(i, j) is small at the pixel where the degree of
the blur is severe, but it’s large at the pixel where
the degree of the blur is light. Therefore, D
b
(i, j)
of a raindrop is smaller than that of neighbouring
regions when the background has clear strong tex-
ture and D
b
(i, j) of a raindrop is larger than that of
neighbouring regions when the background is homo-
geneous. The raster scanning is conducted in D
b
(i, j)
(1 ≤ i ≤ W, 1 ≤ i ≤ H) and raindrop candidates are
detected using two following conditions.
1. The pixel (i, j) is included in the non-textured
block.
The pixel (i, j) is chosen as a raindrop candidate
when there are one or more neighbourhood pixels
(k, l) (i − 1 ≤ k ≤ i + 1, j − 1 ≤ l ≤ j + 1) satisfy-
ing D
b
(i, j) − D
b
(k, l) > T
n
.
2. The pixel (i, j) is included in the textured block.
The pixel (i, j) is chosen as a raindrop candidate
when there are one or more neighbourhood pixels
(k, l) (i − 1 ≤ k ≤ i + 1, j − 1 ≤ l ≤ j + 1) satisfy-
ing D
b
(k, l) − D
b
(i, j) > T
t
.
In experiments, T
n
and T
t
are set to 0.78 and 2.1.
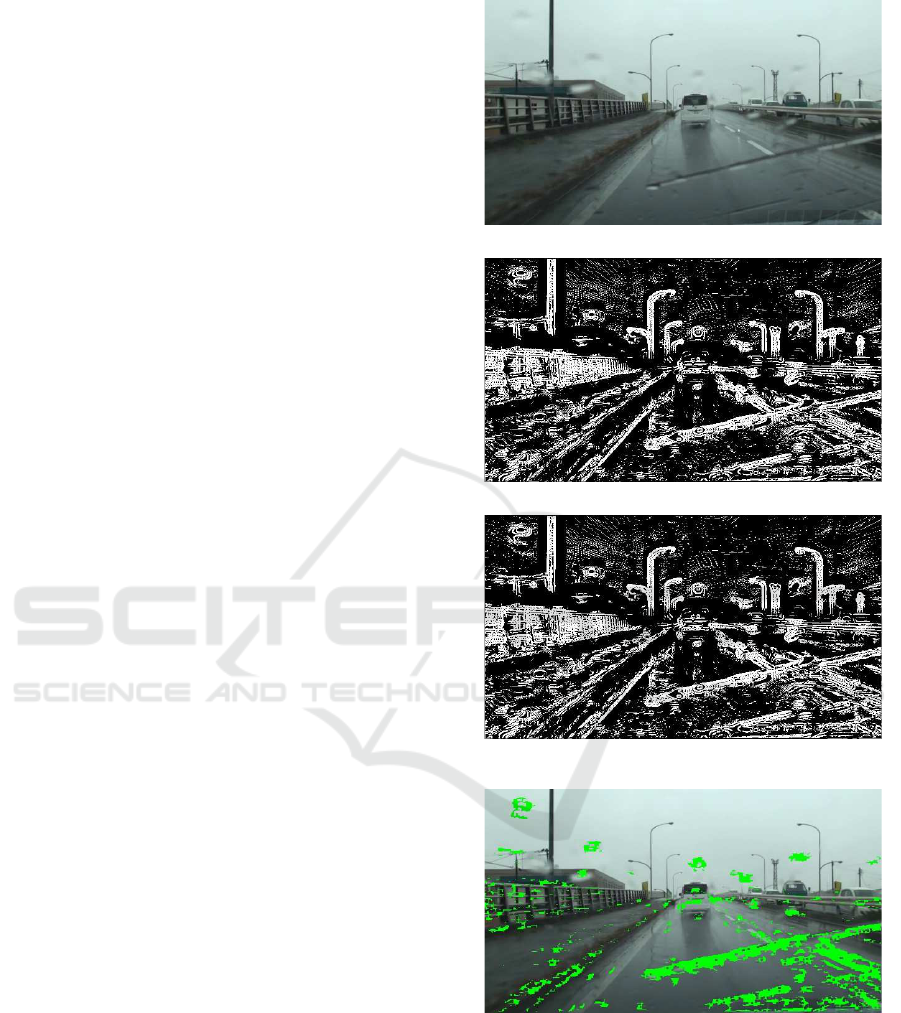
In Fig.5(b), pixels satisfying these conditions are indi-
cated by white points. The neighbourhood pixel (k, l)
satisfying | D
b
(i, j) − D
b
(k, l) |< T
c
is added to rain-
drop candidates until a new raindrop candidate is not
detected. In experiments, T
c
is set to 0.1. Figure 5(c)
shows the final result of raindrop candidates.
2.1.3 Determination of Raindrop
Raindrop candidates contain some false areas, such
as edge areas in surrounding structures. Our method
removes these areas by integrating the detection re-
sults of several frames since the motion of a back-
ground is large but that of a raindrop on a wind-
shield is small in an image. At first, the binary im-
age R
t
(i, j) (1 ≤ i ≤ W, 1 ≤ j ≤ H) in which rain-
drop candidates are set to 1 is created in each frame
t. Next, an integration image SR(i, j) is created by
adding R
t−n+1
(i, j), R
t−n+2
(i, j), ··· , R
t
(i, j). SR(i, j)
is binarized by the predetermined threshold T
r
. In ex-
periments, n and T
r
are set to 3 and 2 respectively.
When a vehicle moves along a road, some areas
on the straight line toward the vanishing point, such
as on the guardrail, the railing of the bridge or the
boundary of the wall, may be detected wrongly be-
cause the similar texture appears continuously. In or-
der to remove these areas, the direction of the optical
flow is examined in raindrop candidates. The motion
detected on the lane marker and so on converges at
Detection of Raindrop with Various Shapes on aWindshield
477
the vanishing point. On the other hand, the motion
detected in a raindrop is unstable. For this reason, our
method detects the optical flow in the raindrop candi-
date and calculates the variance of the flow direction
in the block whose center is the pixel of interest for
15 frames. In experiments, the block size is 11 × 11.
Figure 6 (a)-(c) show the example of the optical flow
detected in the raindrop candidate shown in Fig.5(c).
Figure 6 (d) shows the histogram of the flow direc-
tion in the raindrop (blue circle) and Fig. 6(e) shows
the histogram of the flow direction in the lane marker
(green circle). The direction of the optical flow in
the background is similar in the surrounding area and
does not change so much for several frames. On the
other hand, flow vectors detected in the raindrop have
various directions. For this reason, a pixel in the rain-
drop candidate is removed when the variance of the
flow direction is small.
The closing process is applied to the binary image
SR
b
(i, j) and the final result is obtained after remov-
ing small regions from SR
b
(i, j).
Figure 5(d) shows final raindrop areas obtained
from raindrop candidates of Fig.5(c).
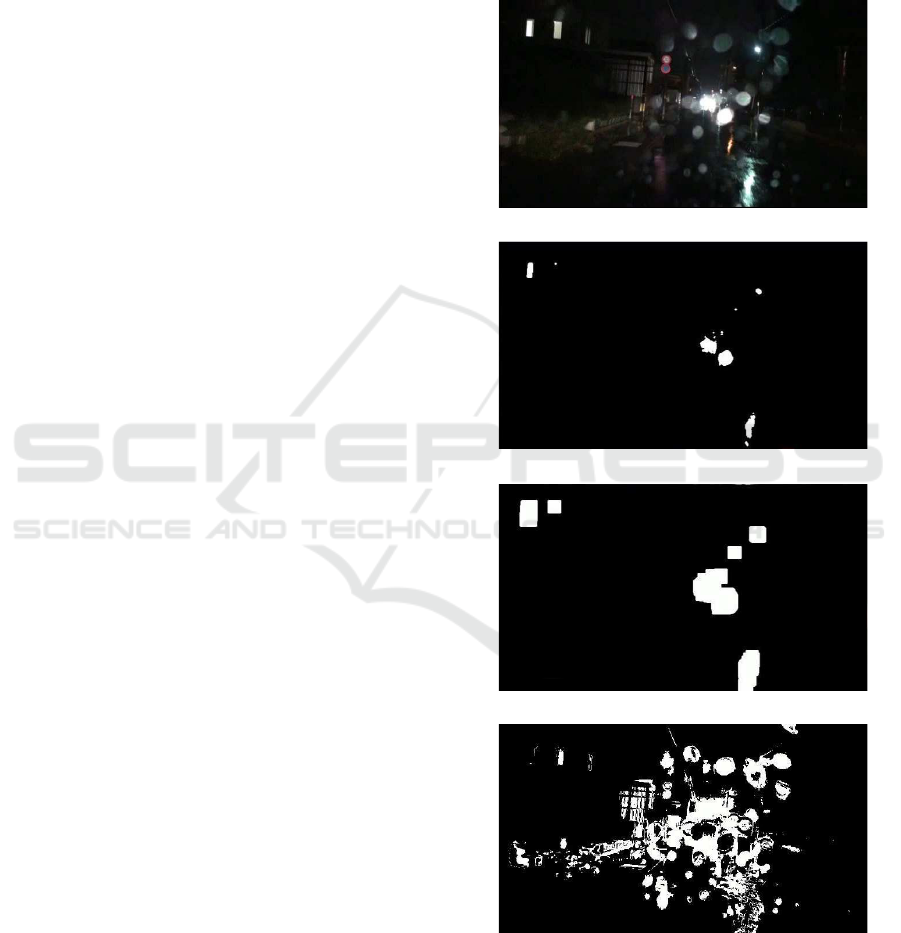
2.2 Raindrop Detection at Night
At night, only the raindrop lit up by a headlight or the
surrounding light source appears on a windshield as
shown in Fig.7(a). When the light source moves in
an image, the intensity near the light source greatly
changes. However, the intensity away from the light
source does not change so much. For this reason, in an
image except for the surrounding of the light source, a
bright area where temporal change of the intensity is
small is detected as a raindrop. The light source area
R
light
is estimated by simple binarization because it
shows high intensity in an image. The surrounding
area R
near
is obtained by applying dilation processing
to R
light
. Figure 7 (b) and (c) show R
light
and R
near
.
Based on the following condition (2), the frame differ-
ential image FD
t
(i, j) is created from two consecutive
images I
t−1
(i, j) and I
t
(i, j) in which R
near
is masked.
FD
t
(i, j) =
1 i f I
t
(i, j) > T
dark
and
| I
t
(i, j) − I
t−1
(i, j) |< T
di f
0 otherwise
(2)
T
dark
is the threshold to delete a dark background
from a processing region and T
di f
is the threshold to
detect a pixel where the frame differential value is
small. In experiments, T
dark
and T
di f
are set to 30
and 20 respectively.
An integration image SFD
t
(i, j) is created by
adding FD
t−m+1
(i, j),
(a) Input image.
(b) Raindrop candidates.
(c) Raindrop candidates after neighbourhood points are
added.
(d) Raindrop areas.
Figure 5: Raindrop detection in the daytime.
FD
t−m+2
(i, j), ··· , F
t
(i, j). SFD
t
(i, j) is binarized by
the predetermined threshold T
s f d
.
In experiments, both m and T
s f d
are set to 3.
The labeling processing is applied to the binarized
SFD
t
(i, j). Final raindrop areas are detected after re-
moving labeled areas that satisfy at least one of the
following conditions.
ICPRAM 2016 - International Conference on Pattern Recognition Applications and Methods
478
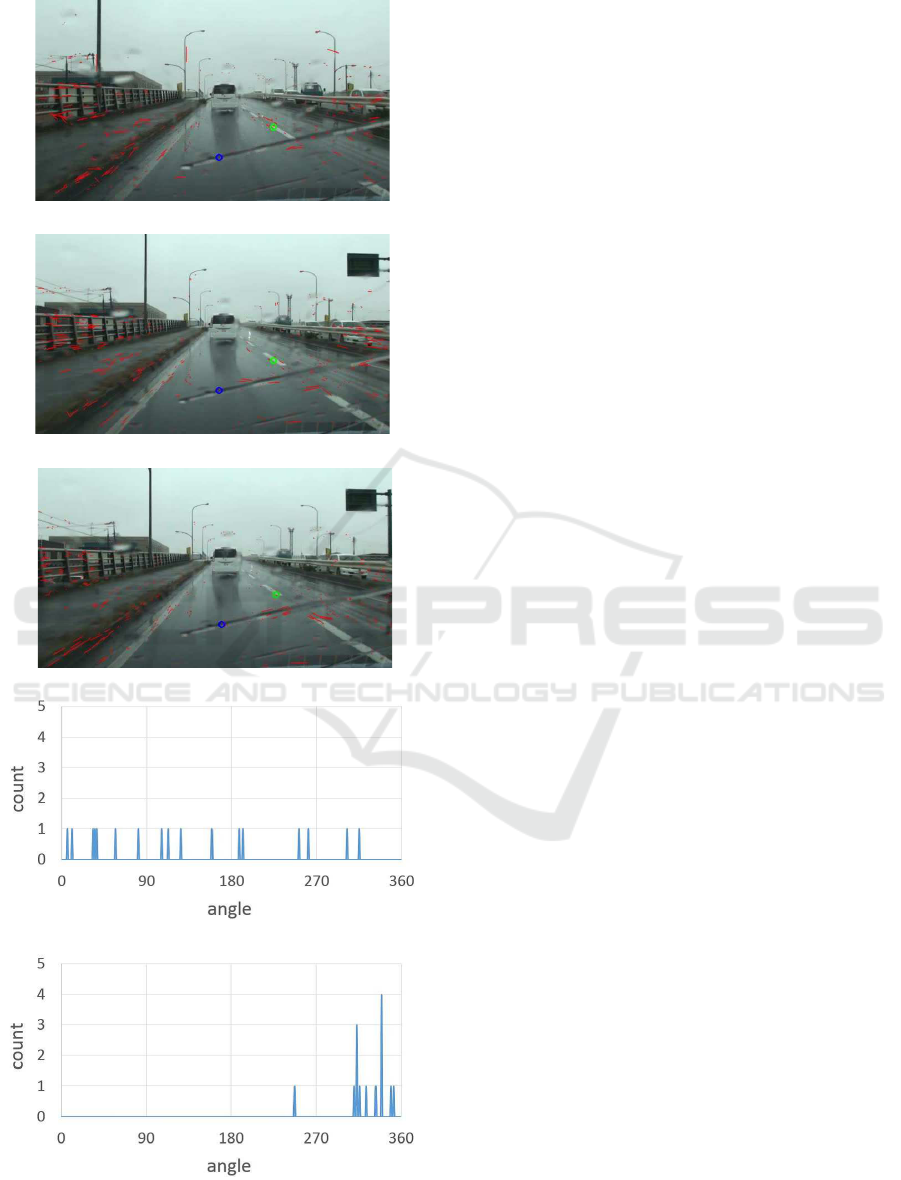
(a) Optical flow (Scene 1).
(b) Optical flow (Scene 2).
(c) Optical flow (Scene 3).
(d) Histogram created in a raindrop (blue circle).
(e) Histogram created in a lane marker (green circle).
Figure 6: The direction of the optical flow.
1. R
near
is contained in the circumscribed rectangle.
2. The size is small.
Figure 7 (d), (e), (f) and (g) show FD
t−2
, FD
t−1
,
FD
t
and SFD
t
(i, j). Figure 7(h) shows the final result
of raindrop detection.
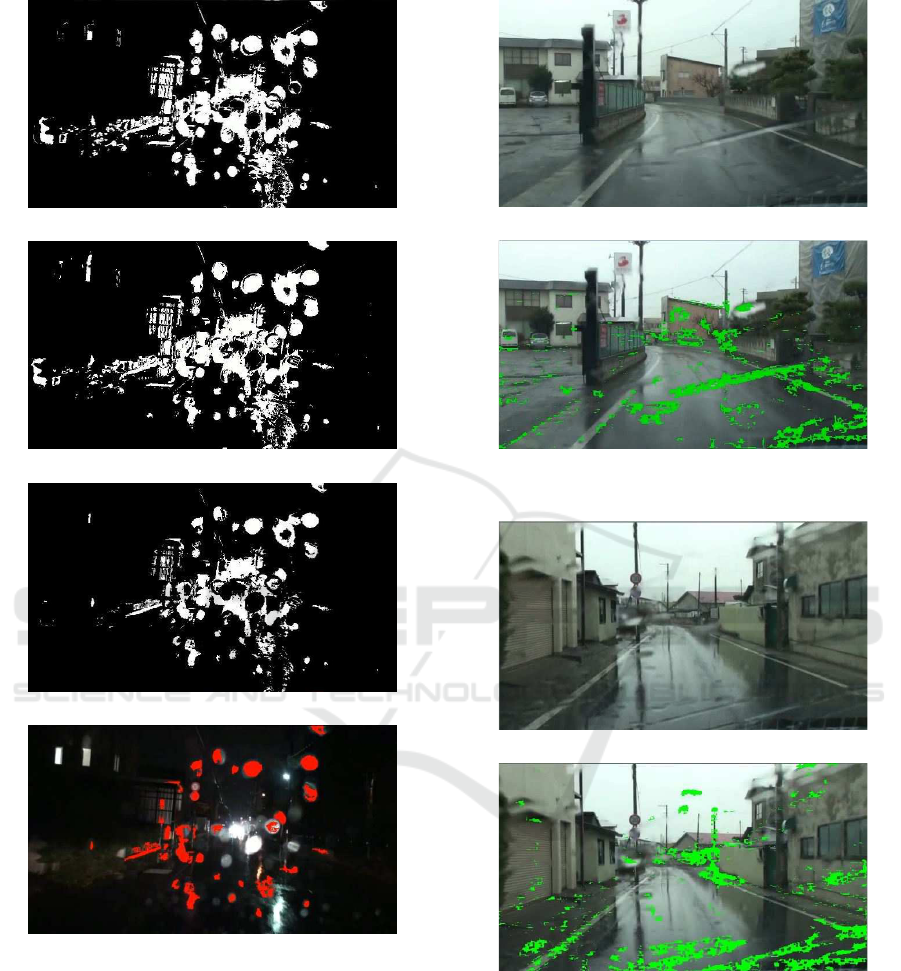
3 EXPERIMENTS
We conducted experiments to detect raindrops on a
windshield by an in-vehicle video camera. The image
size is 640×360 pixels. Eight video sequences whose
length are about two minutes respectively are used
for daytime experiments and six ones are used for
night experiments.Various backgrounds in the main
road and the community road are included in these
video sequences.These video sequences also contains
various rain conditions from heavy rain to light rain.
In each video sequences, same parameters were used.
Figures 8-11 show examples of detection results in
the daytime. Raindrops are indicated in green. Rain-
drops with various shapes, e.g. a band-like shape, ap-
pear on various backgrounds, such as a road surface,
a building, a tree, sky and so on. Since the proposed
method detects a raindrop every pixel and it uses the
ratio of edge strength to detect raindrop candidates,
most of raindrops with various shapes were detected
regardless of a background. Some of raindrops in the
sky were not detected since our method uses fixed
thresholds determined by experiments. We will de-
velop the method to decide the threshold dynamically
in the next step. The current processing time in the
daytime is 10 f ps on PC with Xeon 3.2GHz CPU.
However, the video rate processing would be possible
by the parallelization of the process and optimization
of the software.
Figures 12-14 show examples of detection results
at night. Raindrops are indicated in red. Most of rain-
drops except for the surrounding of the light source
were detected. Since the brightness of the raindrop
near the light source changes intensely as the light
source moves in an image, it’s difficult to distinguish
them from reflected light on the road surface. Al-
though the present method excludes the surrounding
of the light source from a detection area, we will im-
prove the method in future so that a raindrop near the
light source can be detected. The processing time at
night is more than 30 f ps on the same PC.
4 CONCLUSION
This paper proposed the method to detect raindrops
Detection of Raindrop with Various Shapes on aWindshield
479
on a windshield from an in-vehicle single camera.
When it rains hard, raindrops are connected on a
windshield and show various shapes even if a wind-
shield wiper is activated. The proposed method can be
applied to raindrops with various shapes, e.g. a band-
like shape. In the daytime, raindrops are detected by
examining the difference of the blur between the sur-
rounding area. At night, bright areas where tempo-
ral change of the intensity is small are detected as
raindrops in an image except for the surrounding of
the light source. Experimental results obtained from
some real streets show the effectiveness of the pro-
posed method. In the future, we aim at reducing false
detection and realizing video-rate processing on the
in-vehicle CPU. We are going to create the database
for raindrop detection and evaluate the performance
quantitatively.
REFERENCES
K. Garg and S. K. Nayar, “Vision and Rain” International
Journal of Computer Vision, Vol.75, Issue 1, pp.3-27,
2007.
P. C. Barnum, S. Narashimhan and T. Kanade, “Analysis
of Rain and Snow in Frequency Space” International
Journal of Computer Vision, vol.86, Issue 2-3, pp.256-
274, 2010.
H. Kurihata et al., “Rainy Weather Recognition from In-
Vehicle Camera Images for Driver Assistance” Pro-
ceedings of IEEE Intelligent Vehicles Symposium,
pp.205-210, 2005.
H. Kurihata et al., “Detection of Raindrops on a Windshield
from an In-Vehicle Video Camera” International Jour-
nal of Innovative Computing, Information and Con-
trol, Vol.3, No.6(B), pp.1583-1591, 2007.
J. C. Halimeh and M. Roser, “Raindrop Detection on Car
Windshields Using Geometric-Photometric Environ-
ment of Construction and Intensity-Based Correla-
tion” Proceedings of IEEE Intelligent Vehicles Sym-
posium, pp.610-615, 2009.
M. Sugimoto, N. Kakiuchi, N. Ozaki and R. Sugawara,
“A Novel Technique for Raindrop Detection on a
Car Windshield using Geometric-Photometric Model”
Proceedings of ITSC, pp.740-745, 2012.
H. Liao, D. Wang, C. Yang and J. Shine, “Video-based Wa-
ter Drop Detection and Removal Method for a Mov-
ing Vehicle” Information Technology Journal, Vol.12,
No.4, pp.569-583, 2013.
F. Nashashibi, R. de Charette and A. Lia, “Detection of Un-
focused Raindrops on a Windscreen using Low Level
Image Processing” Proceedings of International Con-
ference on Control, Automation, Robotics and Vision,
pp.1410-1415, 2010.
D. Eigen, D. Krishnan and R. Fergus, “Restoring An Image
Taken Through a Window Covered with Dirt or Rain”
Proceedings of ICCV, pp.633-640, 2013.
S. You, R. T. Tan, R. Kawakami and K. Ikeuchi, “Adherent
Raindrop Detection and Removal in Video” Proceed-
ings of CVPR, pp.1035-1042, 2013.
APPENDIX
(a) Input image.
(b) Light source R
light
.
(c) R
near
.
(d) FD
t−2
(i, j).
Figure 7: Raindrop detection at night.
ICPRAM 2016 - International Conference on Pattern Recognition Applications and Methods
480
(f) FD
t−1
(i, j).
(g) FD
t
(i, j).
(h) SFD
t
(i, j).
(i) Raindrop areas.
Figure 7: Raindrop detection at night (cont.).
(a) Input image.
(b) Detection result.
Figure 8: Experimental results in the day time (Scene 1).
(a) Input image.
(b) Detection result.
Figure 9: Experimental results in the day time (Scene 2).
Detection of Raindrop with Various Shapes on aWindshield
481
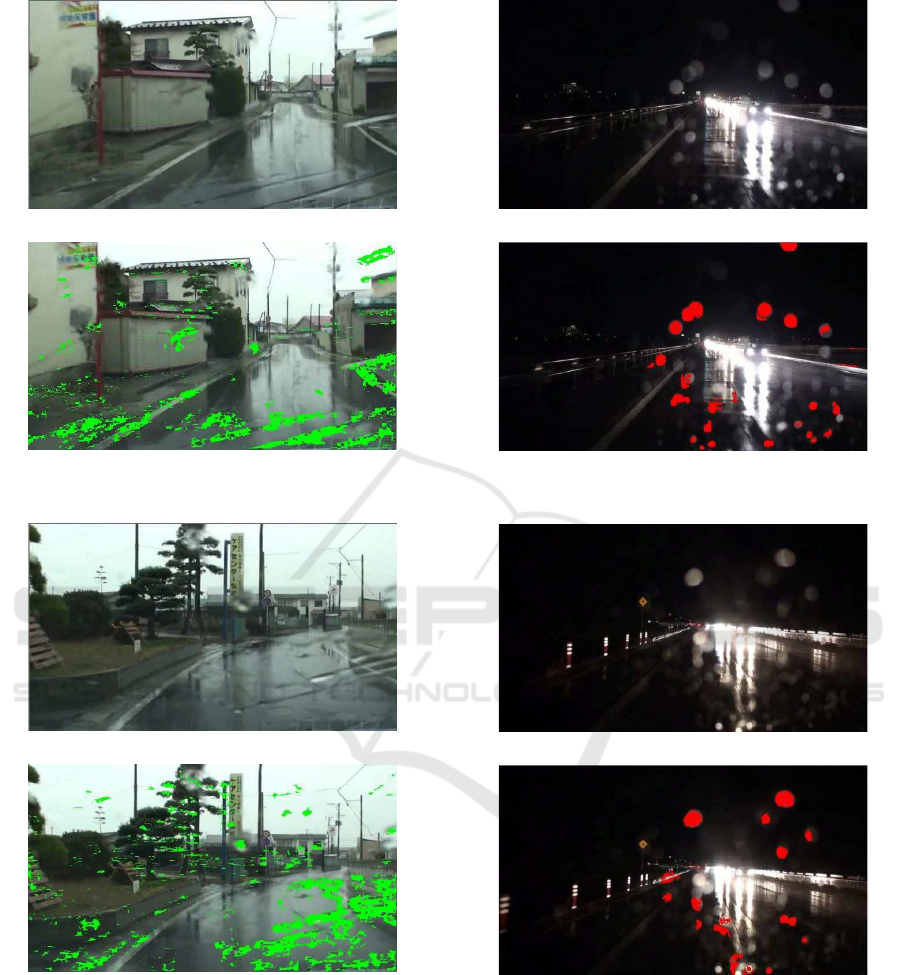
(a) Input image.
(b) Detection result.
Figure 10: Experimental results in the day time (Scene 3).
(a) Input image.
(b) Detection result.
Figure 11: Experimental results in the day time (Scene 4).
(a) Input image.
(b) Detection result.
Figure 12: Experimental results at night (Scene 5).
(a) Input image.
(b) Detection result.
Figure 13: Experimental results at night (Scene 6).
ICPRAM 2016 - International Conference on Pattern Recognition Applications and Methods
482
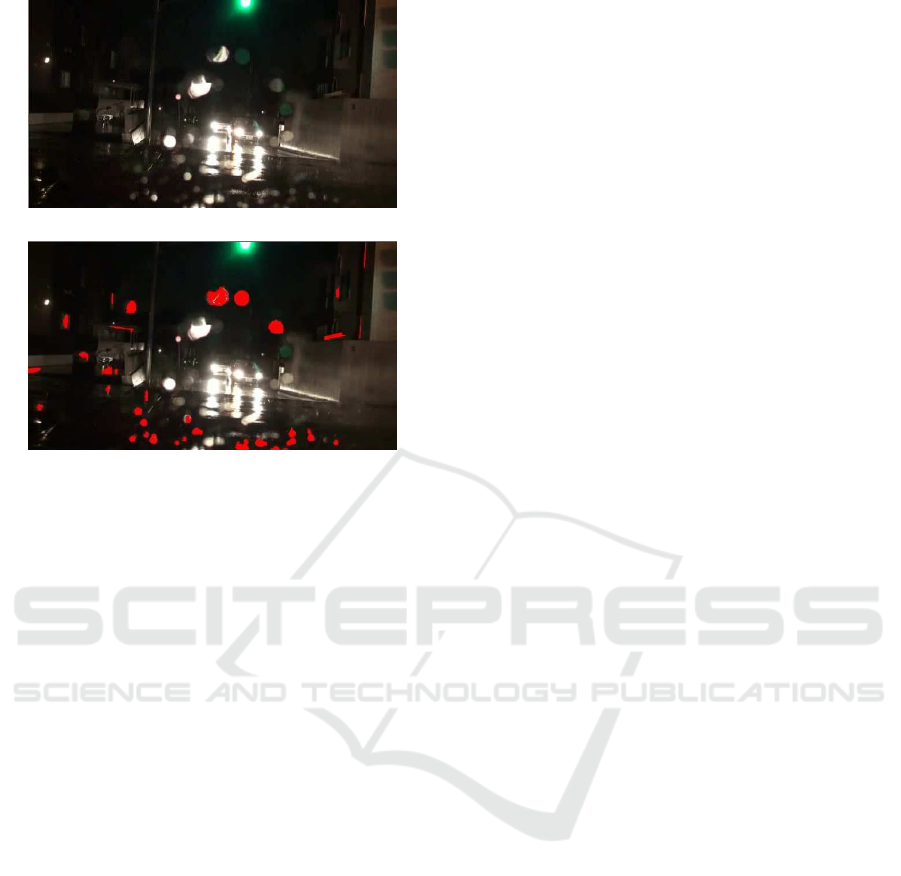
(a) Input image.
(b) Detection result.
Figure 14: Experimental results at night (Scene 7).
Detection of Raindrop with Various Shapes on aWindshield
483
