
Photovoltaic Integration in Smart City Power Distribution
A Probabilistic Photovoltaic Hosting Capacity Assessment based on
Smart Metering Data
Vasiliki Klonari
1
, Jean-François Toubeau
1
, Jacques Lobry
2
and
François Vallée
1
1
Electrical Engineering Department, University of Mons, 31 Boulevard Dolez 7000, Mons, Belgium
2
General Physics Department, University of Mons, 9 Rue de Houdain 7000, Mons, Belgium
Keywords: Smart Cities Power Distribution, Low Voltage, Hosting Capacity, Smart Meters, Photovoltaic, Probabilistic
Analysis.
Abstract: Maximizing the share of renewable resources in the electric energy supply is a major challenge in the design
of smart cities. Concerning the smart city power distribution, the main focus is on the Low Voltage (LV) level
in which distributed Photovoltaic (PV) units are the mostly met renewable energy systems. This paper
demonstrates the usefulness of smart metering (SM) data in determining the maximum photovoltaic (PV)
hosting capacity of an LV distribution feeder. Basically, the paper introduces a probabilistic tool that estimates
PV hosting capacity by using user-specific energy flow data, recorded by SM devices. The probabilistic
evaluation and the use of historical SM data yield a reliable estimation that considers the volatile character of
distributed generation and loads as well as technical constraints of the network (voltage magnitude, phase
unbalance, congestion risk, line losses). As a case study, an existing LV feeder in Belgium is analysed. The
feeder is located in an area with high PV penetration and large deployment of SM devices. The estimated PV
hosting capacity is proved to be much higher than the one obtained with a deterministic worst case approach,
considering voltage margin (magnitude and unbalance).
Table 1: Abbreviations.
MV/LV Medium Volta
g
e/Low Volta
g
e
PV Photovoltaic
DER Distributed Energy Resource
DSO Distribution System Operator
SM Smart Meter
CDF Cumulative Distribution Function
HC Hosting Capacity
P
overvoltage
Probability of exceeding upper voltage limit
P
undervoltage
Probability of exceeding lower voltage limit
P
unbalance
Probability of exceeding voltage unbalance
limit
V
i,j
Grid voltage at node i, phase j
V
nom
Nominal voltage in the feeder
P
rated,l,i
Installed PV power at node i, considered in
iteration l in case it is a future PV node
P
rated,tot
Installed PV power in whole feeder
P
step
Increase step of the installed PV power at a
node
f
i
Reference factor
1 INTRODUCTION
A major challenge in the design of smart cities is to
maximize the share of renewable resources in their
electric energy supply. The principal objective is to
increase the self-sufficiency of a city, based on local
resources, while responding to the climate change.
The smart city power distribution mainly concerns the
Low Voltage (LV) electric network. Photovoltaic
(PV) generation is the mostly met Distributed Energy
Resource (DER) in such systems.
So far, the biggest share of distributed PV units
came with no strategic design or reinforcement of the
network while monitoring data in the small-usage
(residential or small business) sector were absent
almost everywhere in Europe. Given the lack of
controllability in common LV networks, the
uncoordinated integration of PV units often leads to
distinct power quality issues. Moreover, it slows
down the increase of renewable energy share. Thus,
the growing volatility of electricity consumption and
generation in the distribution network urges the
166
Klonari, V., Toubeau, J-F., Lobry, J. and Vallee, F.
Photovoltaic Integration in Smart City Power Distribution - A Probabilistic Photovoltaic Hosting Capacity Assessment based on Smart Metering Data.
In Proceedings of the 5th International Conference on Smart Cities and Green ICT Systems (SMARTGREENS 2016), pages 166-178
ISBN: 978-989-758-184-7
Copyright
c
2016 by SCITEPRESS – Science and Technology Publications, Lda. All rights reserved
adoption of a streamlined planning approach for the
future smart cities.
In this evolving framework, Distribution System
Operators (DSOs) are called to safeguard a stable and
secure power supply in all possible demand
conditions while fostering the massive integration of
DER generation. In cost-efficiency terms, this fact
highlights the necessity of leaving behind
deterministic worst case planning approach. This
traditionally applied approach focuses on the least
favourable network operation states, which are very
rare. Naturally, it leads to very restrictive decisions in
terms of PV hosting capacity or to costly network
reinforcements.
Given the current uncertainty of DSO costs and
revenues, new planning tools are required for
considering the constant variability of the energy
network (EDSO, 2015). In a smart city vision, this
argument becomes even more solid in view of the
upcoming integration of electric vehicles and the
development of flexibility services. As a matter of
fact, both are seen as basic components of the future
smart cities. The large deployment of smart metering
(SM) devices in the residential and commercial sector
will drastically enlarge the potential of cost-effective
planning approach. Indeed, user-specific data will
result in a better insight of the smart city power
distribution system.
Considering the above facts and the probabilistic
character of the EN 50160 technical standard
(EN50160, 2012; Antoni Klajn, 2013) (which
addresses the LV network) this paper presents a
feeder- and user- specific probabilistic methodology
that estimates the DER hosting capacity of an LV
feeder. Practically it introduces a probabilistic tool
that uses user-specific energy flow data recorded by
SM devices, installed in the studied feeder. The
probabilistic evaluation and the use of historical SM
data yield a reliable estimation that considers the
volatile character of distributed generation and loads
as well as network operational criteria.
Section 2 of this paper presents literature review
regarding this subject and the drivers for developing
the proposed analysis tool. Section 3 presents the
overall structure of the developed algorithm and
Section 4 thoroughly describes the important role of
user-specific SM measurements in this development.
Section 5 explains the computation process of the
maximum acceptable PV hosting capacity.
In Section 6, a real LV feeder in Belgium is
analysed. The feeder is located in an area with high
PV penetration and large deployment of SM devices.
When the probabilistic character of EN 50160
standard’s voltage limits is considered, the estimated
PV hosting capacity is proved to be much higher than
the one obtained with a deterministic approach, based
on worst case energy flow profiles. Moreover, the use
of long term SM measurements verifies the
computation of technical metrics that can only be
considered with a deterministic approach (violation
of the maximum current capacity of the lines).
2 CURRENT FRAMEWORK
Slow or over rigid hosting capacity review processes
hamper DER integration in many regions worldwide.
Very often, users who want to invest and play an
active role in managing their energy usage are
increasingly unable, in expediency and cost-
efficiency terms, to do so. In this context, a stream-
lined approach together with the expansion of
allowable DER integration approvals seem to be a
necessity (Solar City Grid Engineering, 2015).
For increasing penetration levels while shortening
the application review timeline, DSOs should
incorporate automated DER hosting capacity
analyses. A process flow for incorporating such
analysis into the DER integration review process is
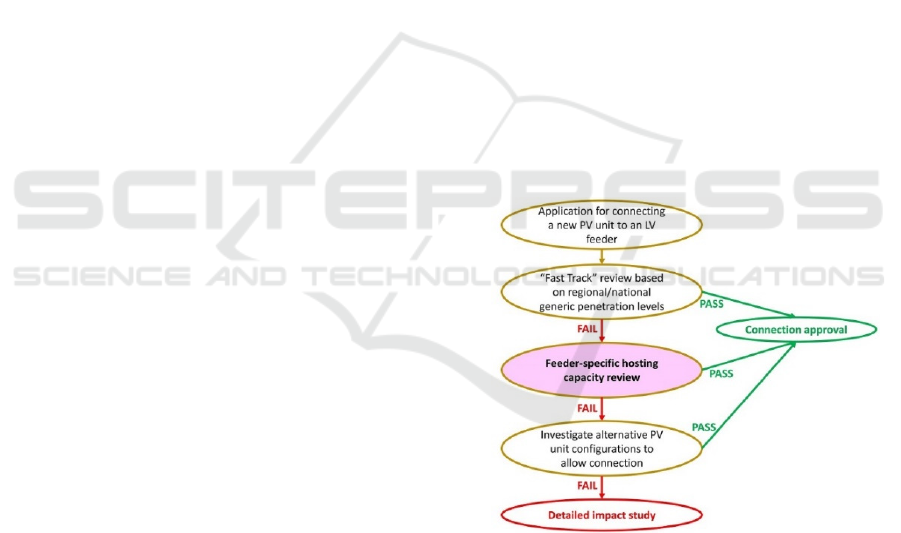
outlined in Figure1.
Figure 1: Process flow for incorporating hosting capacity
analysis into the DER integration process.
Recently, many energy utilities are adapting their
DER hosting capacity review so as to remove or
update restrictive maximum allowable limits (Noone,
2013). As far as the fast track analysis part is
concerned (second step in Figure 1), the Electric
Power Research Institute (EPRI) presents a set of
models that could be used by DSOs or electric utilities
(Smith, 2015; Electric Power Research Institute,
2012). These feeder-based methodologies are very
Photovoltaic Integration in Smart City Power Distribution - A Probabilistic Photovoltaic Hosting Capacity Assessment based on Smart
Metering Data
167

solid computation examples that take account of all
steady state operational criteria.
Focusing on PV hosting capacity, EPRI
recommends stochastic analysis as a highly
appropriate tool for determining PV hosting capacity
in distribution feeders (Smith, 2015; Electric Power
Research Institute, 2012). The stochastic deployment
concerns the position and size of future PV units
while the steady state estimation of the feeder is done
with deterministic approach.
In the same vein, a set of studies addressing the
European framework and the EN 50160 standard
highlight the efficiency of stochastic and probabilistic
analysis in determining hosting capacity or otherwise
the impact of PV generation in LV feeders (Bollen
and Hassan, 2011; Conti and Raiti, 2007; Conti et al.,
2003; Hernandez et al., 2013; Ruiz-Rodriguez et al.,
2012; Billinton and Bagen, 2006; Billinton and Karki,
2003). Meanwhile, the European Photovoltaic
Industry Association (EPIA) and the technical
standard EN 50160 suggest that distribution networks
should be designed on a probabilistic basis. For
example, EN 50160 standard deals with the voltage
characteristics of LV feeders in probabilistic terms. It
gives recommendations that, for a percentage of
measurements (e.g. 95%) over a given time, the
voltage value must be within specified limits.
Most of the existing methodologies deploy the
stochastic analysis regarding the size and position of
PV units and not the load/generation profiles of users.
However, the ongoing integration of SM devices in
LV networks enlarges the potential of using feeder-
specific or even user-specific data for modelling
energy flows. According to (Bollen and Hassan,
2011) , deploying long-term measurements in the LV
network is highly valuable, not only for estimating the
maximum PV hosting capacity, but also for voltage
coordination of the network in general.
The EPRI’s report (Electric Power Research
Institute, 2012) estimates PV hosting capacity using
feeder-specific data to create either absolute worst
case scenarios (maximum recorded generation-
minimum recorded load) or load/PV time-of-day
coincident worst case scenarios. As previously
mentioned, although feeder-specific data are used, the
steady state estimation of the feeder is still done with
a deterministic approach. Indeed, this approach does
not consider the fact that the time-of-day in which
worst case values apply for a specific user does not
necessarily coincide with the one of other users
connected to the same feeder. Nevertheless, the
operational criteria of the feeder are determined both
by the individual user’s demand and by the
simultaneous demands of other network users. Since
the demands of every user and the degree of
coincidence between them constantly varies, so does
the operation of the feeder (Antoni Klajn, 2013).
The above argument demonstrates that although
user-specific SM data are primordial for creating
reliable network models, there is another challenge
that needs to be addressed. The latter lies in the fact
that users follow volume-wise (kWh) or capacity-
wise (kW) an almost stable daily pattern. However,
this pattern does not necessarily remain the same on
the time axis. In long term decision making, profiles
should be based on the recorded ones considering all
possible deviations. Those deviations could be
inserted either as random statistical errors or by
making random possible combinations of the
recorded values or by combining both approaches.
Therefore, reliable models that take into account
load/PV time- and user-variability are necessary for a
less conservative and more cost-effective hosting
capacity review. Probabilistic and particularly Monte
Carlo approach are very suitable to address this
modelling challenge.
3 THE PV HOSTING CAPACITY
COMPUTATION TOOL
This paper presents a tool that uses probabilistic state
estimation (Vallee et al., 2013; Klonari et al., 2015),
15-min user-specific SM data and feeder-specific
technical parameters to estimate the PV hosting
capacity of a given LV feeder. Hosting capacity is
defined as the maximum amount of PV that can be
accommodated in the feeder without impacting
system operation (reliability, power quality, etc.)
under existing control and infrastructure
configurations (Electric Power Research Institute,
2012).
The proposed methodology aims to address the
central block of Figure 1 by providing a detailed
feeder- and user-specific DER hosting capacity
analysis. The analysis takes into account the EN
50160 standard operational criteria (EN 50160, 2012;
Antoni Klajn, 2013). The focus is on voltage
magnitude and unbalance which are the primary
technical concerns in LV feeders with distributed PV
generation. The maximum line capacity is also
considered so as to address important reverse power
flows due to high PV injection.
Apart from steady state constraint management,
there are other considerations that could be accounted
for, such as transformer aging factor, grid losses, etc.
Such criteria are included in cost-benefit analysis
SMARTGREENS 2016 - 5th International Conference on Smart Cities and Green ICT Systems
168
(CBA) but they are not addressed by the EN 50160
standard. Depending on the country and the applied
DSO tariff methodology (“cost-plus”, “revenue cap”,
etc.), DSOs are incentivised to reduce certain
operation costs that can or cannot be integrated in
their tariffs. Thus, the impact of such criteria on
decision making, varies in function of the distribution
utility. Consequently, this paper determines PV
hosting capacity based on commonly adopted EN
50160 standard criteria and line capacity issues,
however line losses are also determined by the
probabilistic analysis.
3.1 Overview of the Simulation Tool
As previously said, this chapter presents a
probabilistic algorithm that determines the PV
hosting capacity of an LV feeder by elaborating
feeder-specific SM measurements. The SM
measurements are the necessary input for performing
a reliable steady-state analysis of various possible
energy flow scenarios in the studied feeder. The
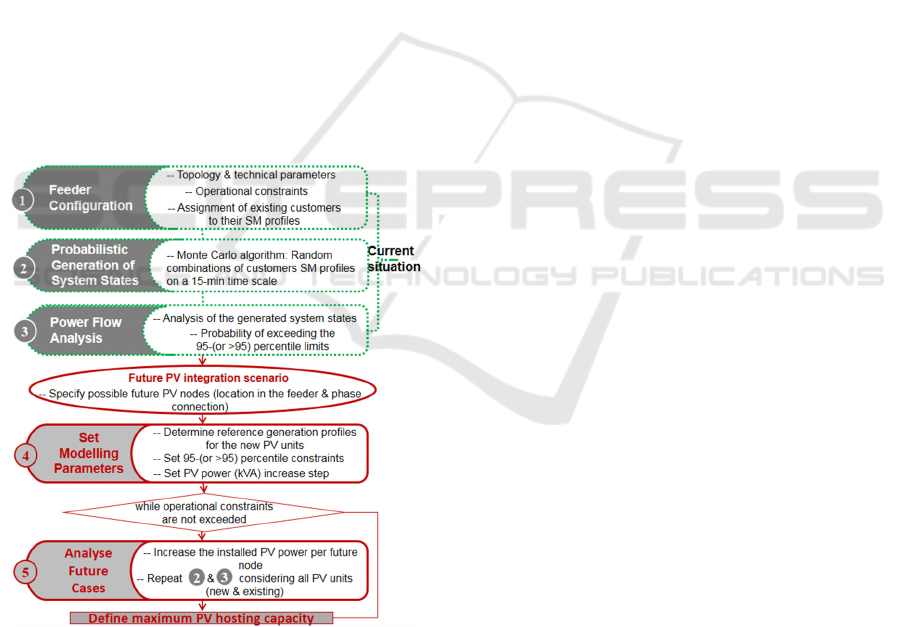
flowchart in Figure 2 presents the structure of the
simulation algorithm, which is entirely developed in
MATLAB®.
Figure 2: Flowchart of the PV hosting capacity computation
tool.
The energy exchange scenarios are generated by a
Monte Carlo algorithm sampling from the historic
SM data of the feeder (Vallee et al., 2013; Klonari et
al., 2015). The power flow analysis is performed with
the three-phase algorithm that is presented in
Appendix A. Both balanced and unbalanced
situations can be considered in this study.
3.2 Feeder Model
The feeder model is constructed based on the
technical parameters of the lines, the position of the
users, the installed PV power per node, the voltage at
the MV/LV transformer secondary output and the
respective set points and bandwidths in case voltage
control algorithms are integrated. The feeder model
also assigns the load/PV generation SM datasets to
the respective users. This necessary information is
directly available to the DSO.
Regarding the PV hosting capacity computation,
the possible future locations of the PV units have to
be specified in the feeder model. This analysis is not
based on stochastic random distribution of PV units
along the feeder. A set of scenarios regarding the
positions of future PV nodes is specified and each one
of them is studied separately so as to focus on its
specific impact on the feeder.
The technical constraints that must be respected
for the current situation and for future scenarios are
the ones specified in local, regional or national
directives. However, these operational constraints
can be determined in a more restrictive manner,
depending on the case. In the EU framework, the
steady-state constraints are set by the EN 50160
standard. Regarding voltage magnitude and
unbalance, 95-percentile limits are suggested. Based
on this standard, the simulation tool verifies that the
following criteria apply for the whole system (in
current and future installed PV power scenarios):
,
1.10∙
0.05
(1.a)
,
0.90∙
0.05
(1.b)
2%
0.05
(1.c)
where
,
and
represent
respectively the probability of having an
overvoltage, an undervoltage or exceeding the phase
voltage unbalance limit at any node over a number M
of simulated network states. In
,
, i stands for nodes
1 to N (total number of nodes in the feeder) and j
stands for phase a, b or c.
The thermal limits of the cables are also
considered in the computation. The current carrying
capacities of the lines should not exceed the DSO
requirements or the recommended values in technical
standards such as (IEC).
The load flow analysis of each system state is
performed with the three-phase algorithm that is
Photovoltaic Integration in Smart City Power Distribution - A Probabilistic Photovoltaic Hosting Capacity Assessment based on Smart
Metering Data
169

presented in (Klonari et al., 2016).
4 THE USE OF SM
MEASUREMENTS
4.1 User Profiles and Feeder State
Modelling based on Historic SM
Datasets
The load/ PV profiles of existing users are created by
using their respective SM recorded datasets. The
generation of the system states is practically based on
a very large number of random combinations of
users’ energy flow values. The methodology for
creating the energy flow profiles and for generating
the system states under analysis are thoroughly
explained in (Vallee et al., 2013; Klonari et al., 2015).
Longer recording periods of SM readings result in
more reliable estimation of the PV impact on the
feeder.
The probabilistic deployment of this simulation
tool relies on the principle that load/PV generation
profiles of users are highly time-varying. This time-
variability induces another variability that concerns
the time coincidence of the load profiles of various
users. Both arguments are very important when
assessing the impact of PV generation on a LV
network. Indeed, the consideration of this variability,
both in the time axis and regarding users coincidence,
makes more realistic the simulation of the network
operation. Such an approach can lead to less
restrictive and more cost-effective decisions that do
not rely on rare extreme cases but on the most
frequent ones.
4.2 Generation Profiles of Future PV
Nodes
A key component in accurately assessing the impact
of future PV units is reliably representing their
generation profiles. Based on the findings of several
studies, geographically close customers are entirely
correlated as far as their PV generation profiles are
concerned (Shedd et al., 2012; Vallée et al., 2015).
For this reason, this study considers that the
generation profiles of future PV customers will be
very similar, along the time axis, to the ones of the
existing PV units.
As previously explained, the load/PV generation
profiles of customers with SM devices are made of 96
Cumulative Distribution Functions (CDFs) of
probability built with the 15-min recorded datasets.
Concerning PV generation, such CDFs are apparently
not available for the future PV units. For this reason,
the available SM datasets are used in this case to
create a reference CDF, based on the 15-min
generation SM datasets of the existing PV owners
(Lefebvre, 2015), which is used to simulate the time-
variability of PV generation at the future PV nodes.
In reality, customers that are connected to the
same LV feeder can have different PV units’ sizes.
Assuming an equivalent statistical distribution of
their PV power profiles due to geographical
proximity, the principle is to create a standardized
reference CDF for PV generation in the specific
feeder, based on the measurements of the available
SM devices (Rousseaux et al., 2015). Initially, the
CDF for the 15-min PV energy generation E
inj,pv,j,q
of
each existing PV node j is normalized by applying the
following relation, for each time step q:
,,,
,,,
,
,, for j = 1:N
SM
(2)
where N
SM
is the number of users in the feeder that
are equipped with an SM device,
,,,
values are
the normalized 15-min energy generation values of
customer j during time step q,
,,,
values are the
recorded 15-min energy generation values of
customer j during time step q and
,
is the total
yearly PV energy generation of customer j.
Once this is done, the 15-min CDFs of every user
are aggregated in order to create one reference CDF
that can represent all PV owners in the specific
feeder. For creating the CDF of each particular future
PV owner, this reference CDF should be normalised
in function of his annual PV generation. For existing
PV owners, such information is usually available to
the DSO even if the customer is not monitored by an
SM device. In case of future PV nodes, such
information is apparently not available since no PV
unit is connected. Consequently, the reference CDF is
normalised with the annual PV generation of an
existing PV unit (in the feeder or in proximity)
multiplied by a reference factor f, as explained in the
following section.
5 PV HOSTING CAPACITY
COMPUTATION
Practically, the algorithm starts with the probabilistic
analysis of the current situation (existing PV units),
by simulating a large number M of possible system
states. One should note that although system states are
based on 15-min resolution data, each one of them is
SMARTGREENS 2016 - 5th International Conference on Smart Cities and Green ICT Systems
170

considered as a possible instantaneous state of the
system. Thus, the accuracy and reliability of the
computation increases with the number of treated
system states.
The probabilities P
overvoltage
, P
undervoltage
and
P
unbalance
are computed at every node, based on the
analysis results. Compliance with the conditions set
by (1.a, 1.b, 1.c) is verified for the whole feeder. In
case the conditions are respected, the algorithm
increases the installed PV power at the future
(specified by the user) PV nodes by the defined
increase step. Therefore, an LV feeder is simulated
considering a total number N of PV nodes. Some of
the simulated N nodes may be currently existing PV
nodes while the rest of them are the considered future
PV nodes. If the total number of future PV nodes is
equal to K (K ≤ N), the new installed power at each
future PV node i is computed as follows:
,,
,,
,
,
1:nodes
(3)
where
,
is the new installed PV power at node
i in the current configuration l that will be analysed
by the algorithm (in step 5, Figure2),
,,
is the
installed PV power at node i that was analysed (and
accepted in terms of impact on the technical
constraints) in configuration l-1 and
is the
increase step (defined by the user). A small
value (≈ 0.5-1kVA for residential or small
commercial users) is recommended so as to make a
more precise computation. In several countries, the
maximum admissible installed power per distributed
PV unit in the LV network, concerning residential and
small-business users, is equal to 10kVA. In such
cases, the condition
,,
10kVAshould be
integrated in step 5 of the algorithm.
Once relation (2) is applied, the new installed PV
power
,,
is defined at every new PV node
before the algorithm performs the next “hosting
capacity review” iteration (step 5, Figure2). However,
the reference CDF that represents the time-variability
of generation at the new PV nodes needs to be scaled
in function of
,
at each node. As previously
highlighted, since the annual PV generation of new
PV units cannot be available, the reference CDF is
normalised with the annual PV generation of an
existing PV unit (in the feeder or in proximity). Then,
a reference factor f is introduced for scaling the
normalised CDF in function of
,
. The factor f
i
is computed as follows:
,,
,
, i=1: K
(4)
where
,
is the installed PV power of the
existing PV unit that has been used to normalize the
reference CDF.
Once the generation profiles have been set up for
the future PV nodes, the algorithm repeats steps 2 and
3 for analyzing the current configuration l. At this
point, it is important to clarify that each “hosting
capacity review” iteration l practically performs the
power flow analysis of configuration l by applying a
full MC simulation, similar to the one of step 2. This
means that each “hosting capacity review” iteration l
runs the same large number of MC iterations M that
was analysed in step 2. Thus, in every iteration l, a
very large number of system states is analysed
(=M·96) so that the values of P
overvoltage
, P
undervoltage
and P
unbalance
converge. Thanks to this procedure, the
verification of compliance with equations (1.a, 1.b,
1.c) for each configuration l is assumed to be reliable.
If the analysis of M system states, in configuration l,
demonstrates that the operational constraints are not
violated, the installed PV power is again increased at
each future node. Then, the algorithm passes again to
steps 4 and 5.
The described iterations stop as soon as the
operational constraints are for the first time exceeded
at least at one of the nodes. Therefore, the PV size of
some units could probably increase even more, given
that the operational constraints at their PCC are not
violated. However, this study treats the LV feeder as
a whole since the violation of limits at one node is
always affected by the energy flow at all nodes. The
,,
that is applied in the last iteration l, which led
to a violation of acceptable limits, is the one
considered as the maximum admissible hosting
capacity per node.
The aggregated PV hosting capacity of the feeder
is computed by adding
,,
(existing and new)
along the feeder:
,
,,
(5)
where N is the total number of PV nodes in the feeder.
In order to make a more detailed computation,
different increase steps could be applied per node in
function of its position in the feeder. The voltage
limits are usually more easily violated at the end of
the line. Consequently, the PV power steps could be
bigger for the nodes at the head of the line. However,
this strategy could eventually result to an earlier (in
terms of PV size) violation of the limits at the last
nodes, which does not tally with a common welfare
among end-users.
Photovoltaic Integration in Smart City Power Distribution - A Probabilistic Photovoltaic Hosting Capacity Assessment based on Smart
Metering Data
171
6 CASE STUDY: AN LV FEEDER
IN BELGIUM
6.1 Description of the Simulation
This section describes the application of the
previously described analysis tool for computing the
PV hosting capacity of an LV feeder in Flobecq.
Flobecq is a municipal area in Belgium with high
penetration of distributed PV generation (≈25% of
Flobecq LV grid users) and large deployment of SM
devices. Thanks to an official research fellowship
between the local DSO and the authors’ affiliation,
the technical parameters of the feeder and SM
datasets of the respective users have been
communicated strictly for research purposes. The
datasets cover a total period of one year (2013).
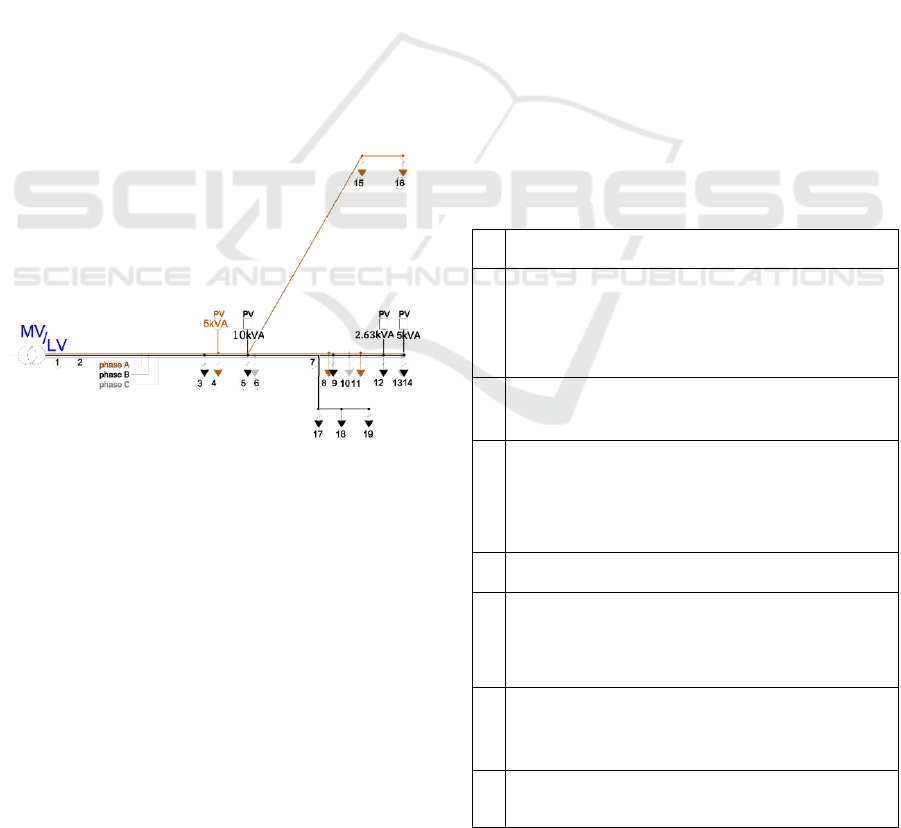
The topology of the simulated three-phase feeder
is presented in Figure 3. Currently, four PV units are
installed in the feeder which supplies a total of 19
residential users. These PV units are located at nodes
4,5,12 and 14, by means of single-phase inverters,
and their installed PV power is respectively 5kVA,
10kVA, 2.63kVA and 5kVA.
Figure 3: The simulated LV feeder of the power distribution
network of Flobecq (conductors colour code as in IEC
60446 standard).
A spatial correlation study had already been
performed for the specific feeder and the generation
profiles of the users were proved to be entirely
correlated (Vallée et al., 2015). This consideration is
taken into account in this analysis, regarding also
future PV nodes. Practically, this means that for every
simulated system state, the randomly sampled
probability for defining the respective PV generation
value is common for all PV units.
Concerning operational constraints, the ones of
EN 50160 standard have been considered in the
simulation. Therefore, compliance with the group of
equations (1.a, 1.b, 1.c) has been verified for each
system state, as far as voltage magnitude and
unbalance are concerned. The maximum current
capacity of the lines has been determined based on
table (IEC). The PV size increase step is defined
equal to 1kVA and the power factor of all PV
inverters is considered equal to 1, unless reactive
power control is considered in the simulation.
A set of different scenarios have been simulated
regarding the position and phase connection of future
PV units as well as the action of voltage control
schemes. The analysed scenarios are listed in Table 2.
Concerning the scenarios A-D, only the on-off
control scheme is considered, which is currently
implemented by most DSOs in Europe. This control
scheme enables a total cut-off of the PV unit (in most
cases during 3 minutes) as soon as the voltage limit
has been locally exceeded for a period longer than 10
minutes. This analysis considers each simulated state
as instantaneous. Therefore each violation of the 95-
percentile limit of EN 50160 standard is counted in
the probabilities even though in reality it might had
lasted less than 10 minutes. This means that the
computed maximum PV hosting capacity is possibly
slightly lower than the one that the feeder can really
support, considering voltage margin.
Table 2: The simulated PV hosting capacity scenarios.
No Description
A
12 new PV units at nodes 2, 3, 6, 7, 8, 10, 11, 13, 15,
16, 17, 18, 19. The PV units at nodes 8, 11, 17, 18, 19
are connected to phase A, the PV unit at node 3 is
connected to phase B and the PV units at nodes 2, 6,
7, 10, 13, 15 are connected to phase C.
B
12 new PV units at nodes 2, 3, 6, 7, 8, 10, 11, 13, 15,
17, 18, 19. All new PV units connected to phase B,
except from PV unit at node 15 (phase A).
C
12 new PV units at nodes 1, 2, 3, 6, 8, 10, 11, 13, 15,
16, 17, 18. The PV units at nodes 1, 8, 11, 15, 16 are
connected to phase A, the PV units at nodes 3, 17 and
18 are connected to phase B and the PV units at nodes
2, 6, 10, 13 are connected to phase C.
D
1 new PV unit connected to node 16 (phase A).
E
Similarly to scenario A but considering 100-
percentile limits. Practically the PV hosting capacity
is not increased as soon as voltage and VUF limits are
exceeded at least once in the feeder.
F
Similarly to scenario A but considering the action of
three-phase damping control integrated in the new PV
inverters. In this case, the new PV units need to be
connected b
y
means of three-
p
hase PV inverters.
G
Similarly to scenario A but considering the action of
reactive power control of (CEI, 2012)
SMARTGREENS 2016 - 5th International Conference on Smart Cities and Green ICT Systems
172
The control scheme applied in scenario F is the
three-phase damping control scheme which behaves
resistively towards the negative- and zero-sequence
voltage component, without modifying the injected
power, so as to eliminate phase voltage unbalance
(Meersman et al., 2011). This control scheme requires
a three-phase PV inverter, it is very promising in
terms of voltage magnitude and unbalance mitigation.
It is actually implemented in a EU pilot program (FP7
INCREASE Project). The third control scheme is
reactive power control in the way it is implemented
in the Italian distribution system (CEI, 2012)
concerning new PV units in the LV network. These
voltage control schemes are integrated in the
simulation tool as explained in (Klonari et al., 2016).
6.2 Comparing with a Deterministic
Approach
One of the main purposes of this study is to
investigate, up to which extent, a probabilistic method
based on user specific data leads to a less restrictive
computation of PV hosting capacity, compared to a
deterministic approach. For this purpose, a
deterministic approach has been implemented
simulating worst case energy flow profiles. The load
profiles of all users and the PV generation profiles of
existing PV units have been also based on SM
recorded data. The deterministic steady state analysis
has been conducted for scenarios A-D, F, G. Scenario
E is not mentioned because, in a deterministic
framework, it coincides with deterministic scenario
A. The following load/ PV generation profiles have
been considered:
I. Maximum PV power per node (installed PV
power) – Minimum recorded load per node;
absolute values, irrespective of time
coincidence among users
II. Maximum PV power recorded in the feeder –
Coincident PV generation/load values for the
other nodes.
III. Minimum recorded load in the feeder during PV
injection hours – Coincident PV
generation/load values for the other nodes.
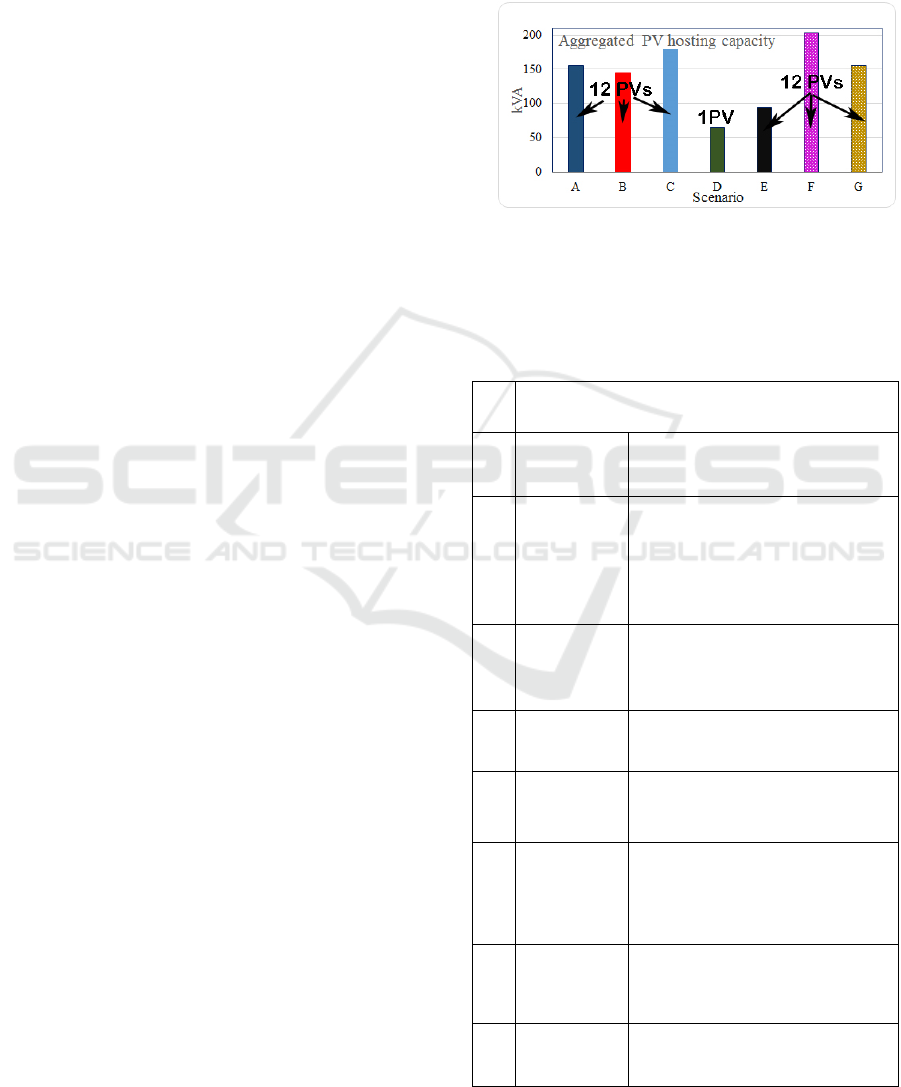
6.3 Results and Discussion
The probabilistic hosting capacity review results are
illustrated in Figure 4 and analytically listed in Table
3. The aggregated maximum admissible PV hosting
capacity in the feeder, considering only voltage
margins (magnitude and unbalance), is presented in
the second column for each individual scenario. The
third column presents the violation due to which PV
hosting capacity could not be further increased for the
respective scenario. The aggregated PV hosting
capacity obtained with deterministic analysis is
presented in Figure 5 and Table 4 for all scenarios and
worst case load/ PV generation profiles (§6.2).
Figure 4: The computed aggregated PV hosting capacity of
the feeder for scenarios A-G. The number of new PV units
is also indicated.
Table 3: Aggregated maximum PV hosting capacity
considering only EN 50160 voltage margins (Probabilistic
Simulation).
No Voltage margin consideration (EN 50160 standard)
Aggregated
HC
Violation
A
154.63kVA
(11kVA per
new PV)
-- P
overvoltage
at nodes 18 and 19
(phase (B)) resulted 5.7% and
6.4% respectively (> 5%, which is
the value accepted by the EN
50160 standard)
B 144.63kVA
-- P
overvoltage
at nodes 13,14,15
(phase (C), resulted 5.4%, 6.16%
and 6.18% respectively
C 178.63kVA
-- P
overvoltage
at nodes 13, 14
resulted 6.78% and 6.77%
ti l
D 65.63kVA
-- P
overvoltage
at node 19
(phase (B)) resulted 5.15%
E 94.63kVA
-- P
overvoltage
at nodes 13,14,
(phase (C)), resulted 0.0001% in
both cases (> 0%, which is the
condition in scenario E)
F 202.63kVA
-- P
overvoltage
at nodes 2-19 (at all
three phases) resulted from 5.5%
to 28%
G 154.63kVA
-- P
overvoltage
at node 19 (phase
(B)) resulted 5.17%
Photovoltaic Integration in Smart City Power Distribution - A Probabilistic Photovoltaic Hosting Capacity Assessment based on Smart
Metering Data
173
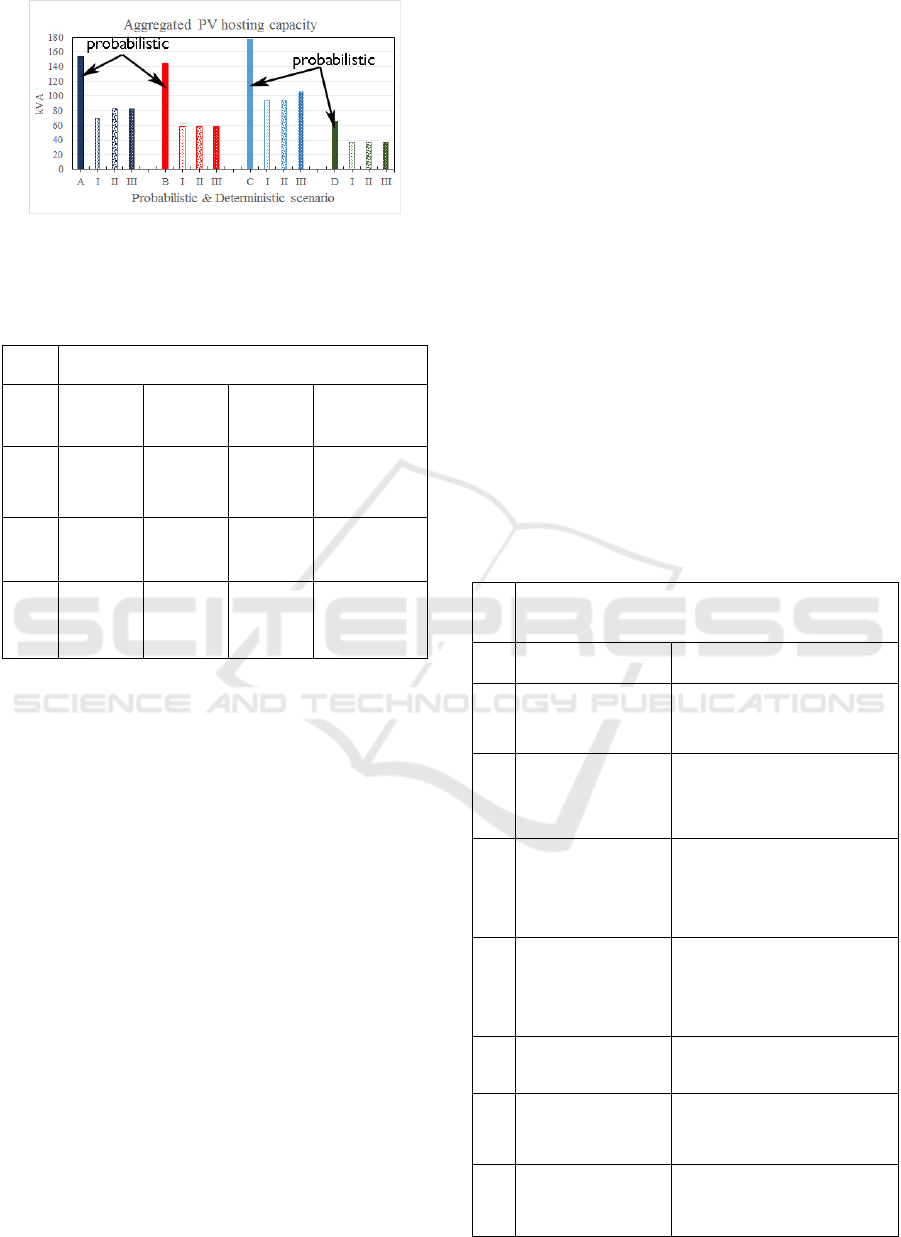
Figure 5: Aggregated PV hosting capacity of the feeder for
probabilistic & deterministic scenarios (A to D).
Table 4: Aggregated maximum PV hosting capacity for
each simulated scenario (Deterministic Approach).
No Aggregated PV Hosting Capacity (kVA)
A 70.63kVA 82.63kVA 82.63kVA
OV at all new
PV nodes
B 58.63kVA 58.63kVA 58.63kVA
OV at all new
PV new PV
nodes
C 94.63kVA 94.63kVA 106.63kVA
OV at all new
PV nodes
D 43.63kVA 49.63kVA 52.63kVA
OV at all new
PV new PV
nodes
Considering only voltage margin as a constraint (both
magnitude and unbalance), one should note that the
result of scenario E (applying 100-percentile limits)
is close to the ones of the deterministic scenarios A.I,
A.II and A.III which analyse the same topology as
scenario A but with a deterministic approach. Based
on this remark, it can be reasonably assumed that the
probabilistic computation covers (samples and
analyses) almost the whole range of possible system
states, including the ones recorded in reality (the
combination of coincidently recorded values) which
are treated in the deterministic scenarios A.II and
A.III.
However, accounting for voltage margins, the
restrictive condition of scenario E according to which
voltage limits must never be exceeded (in none of the
simulated states), results in a quite lower admissible
PV hosting capacity compared to scenario A (same
topology as scenario E). Basically, in scenario E, PV
hosting capacity could not further increase because
the computed P
overvoltage
resulted equal to 99.99%
(>95% is the condition in EN 50160). Therefore, if
the admissible PV hosting capacity does not exceed
94.63kVA, the operational limits will most probably
never be violated in the feeder, based on the
elaboration of the available historic data. Otherwise,
if the admissible PV hosting capacity increases up to
154.63kVA, as in scenario A, voltage limits’
violation will only take place in less than 5% of total
system states. Even with such an increase of the
aggregated PV hosting capacity, the temporary cut-
offs of the PV units due to overvoltage will be very
rare. Scenario A takes advantage of the probabilistic
character of EN 50160 standard (limits violation
allowed during 5% of week time), which is not the
case in scenario E or in the deterministic approach.
Investigating congestion risk for all scenarios, PV
hosting capacity results much lower than in case only
voltage margins are considered. For a more rigorous
view, statistical distributions of current values of all
line segments have been constructed based on the
total number of simulated states. In all cases, the
violation of maximum line capacity took place in
segment 6-7 (Table 5). For this reason, the
configuration in scenario A was reordered in order to
address this remark by examining scenario C.
Table 5: Aggregated maximum PV hosting capacity
considering both EN 50160 voltage margins and maximum
line capacity.
No
Maximum current capacity and voltage margins
consideration
Aggregated HC Violation
A
70.63kVA (4kVA/
per new PV)
I
max
of line 6-7: 13% deviation
(13% higher than the maximum
current capacity of the lines)
B
58.63kVA (3kVA/
per new PV)
I
max
of line 6-7: 50% deviation
(50% higher than the maximum
current capacity of the lines)
C
94.63kVA (6kVA/
per new PV)
I
max
of line 6-7: 0.18% deviation
(10.5% higher than the
maximum current capacity of
the lines)
D
37.63kVA (15kVA/
per new PV)
I
max
of line 6-7: 6.2% deviation
(6.2% higher than the
maximum current capacity of
the lines)
E
70.63kVA (4kVA/
per new PV)
I
max
of line 6-7: 13% deviation
F
70.63kVA (4kVA/
per new PV)
I
max
of line 6-7: 11% deviation
G
70.63kVA (4kVA/
per new PV)
I
max
of line 6-7: 11% deviation
SMARTGREENS 2016 - 5th International Conference on Smart Cities and Green ICT Systems
174
Practically, scenario C considers the same number
and phase configuration of scenario A but new PV
units are distributed at different nodes aiming to
reduce current flows in line segment 6-7. Indeed, the
analysis of scenario C, taking into account congestion
risk, resulted in an improved hosting capacity
compared to scenario A (94.63kVA > 70.63kVA).
Considering voltage margin, scenario C also led to
higher hosting capacity (178,63kVA > 154.63kVA).
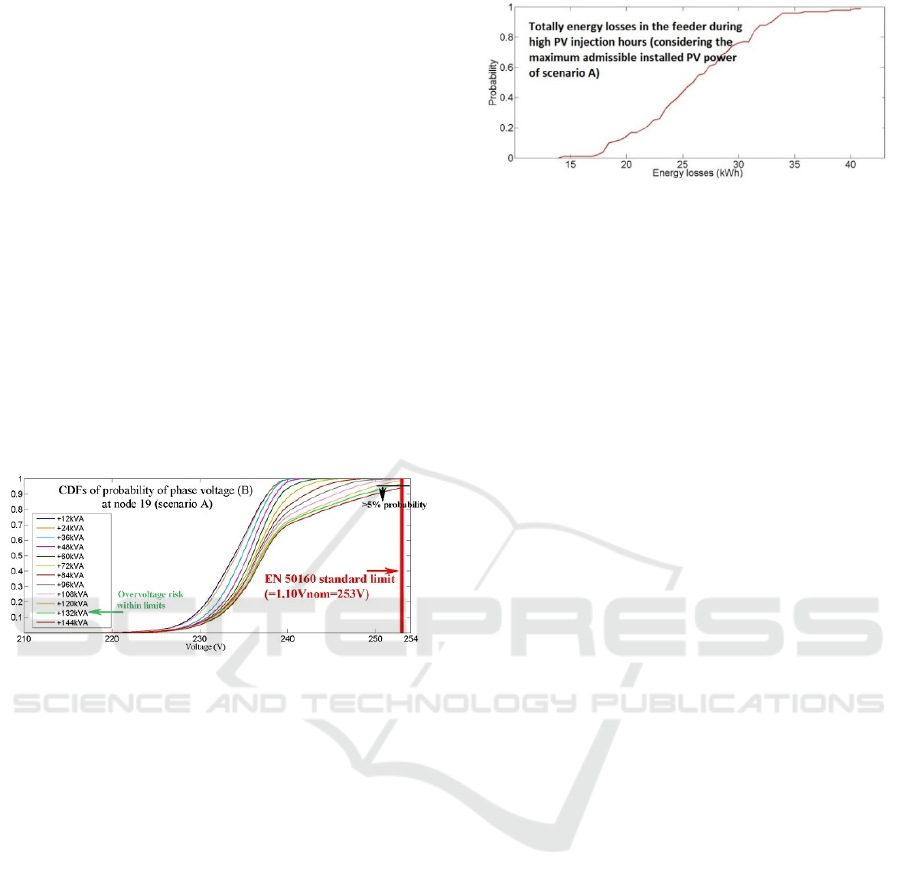
In Figure 6 the probabilistic consideration of
overvoltage is illustrated with the evolution of the
CDF of probability of phase voltage (B) at node 19
while the total installed PV power increases (scenario
A). If total installed PV power increases by 144kVA
(12kVA per new PV unit), phase voltage (B) at node
19 respects the defined limits in 94.6% of the
simulated states (< 95% is the EN 50160 limit). Thus,
the maximum PV power that can be added to the
feeder, considering this configuration, is 132kVA
(11kVA per new PV unit).
Figure 6: CDFs of probability for phase voltage (B) at node
19, for each increase step of the total installed PV power in
the feeder (scenario A).
The above arguments should be considered in a cost-
benefit analysis (CBA) that compares network
operational costs, eventual penalties for low DER
integration, and potential revenue loss for users and
energy utilities. For highlighting the cost-
effectiveness of deploying long-term measurements
in the LV network and analysing it with a
probabilistic approach, a more detailed computation
of line losses in the feeder was performed. Assuming
that the computed maximum admissible PV power is
installed (=154,63kVA if one considers only voltage
margin in scenario A), the study focuses on the total
energy losses along the lines of the feeder during
hours of high PV injection in a typical day (this period
varies with the month).
The worst case approach considers only one
system state which will more likely take place during
hours with the highest PV injection. Based on the
available historic data for the feeder, this period is
between 12:00AM and 18:30PM on a typical July
day. The sum of energy losses has been computed
Figure 7: CDF of probability of total energy losses in the
feeder during high PV injection hours in a typical July day,
considering the maximum admissible installed PV power
(scenario A).
along the feeder for the considered period, for each
simulated day. Figure 7 illustrates the statistical
distribution (CDF of probability) of the computed
daily line losses, obtained with the probabilistic
approach.
The probabilistic approach and the consideration
of the SM measurements demonstrated that total
energy losses in the feeder vary significantly,
depending on the system state. Consequently, in 95%
of the simulated days, total energy losses during high
PV injection hours (12:00AM to 18:30PM) do not
exceed 35kWh in a day. In the deterministic approach
which assumes the worst case scenario taking place
all along the high PV injection period, the respective
energy losses result equal to 148kWh. This important
difference highlights that the probabilistic approach
considers the extremely low frequency of worst case
scenarios to take place simultaneously for all feeder
users. Considering such probabilities, the DSO could
manage a less conservative and more cost-effective
long-term strategy.
Undoubtedly, the computed PV hosting capacity
values depend on the load profiles of the customers
that are located in the feeder. However, the results
clearly indicate in relative terms, that smaller
distributed PV units have a much smoother impact
than the bigger ones concentrated in one small area of
the feeder. This fact is demonstrated by the
comparison of scenario A to scenario D. Moreover,
as previously mentioned, in certain countries the
maximum admissible installed power per PV unit
connected to the LV network is equal to 10kVA. In
such cases, scenario D might not be appropriate based
on the probabilistic simulation results. As a matter of
fact, the admissible total installed power would have
to limit to 32.63kVA although the network would be
able to support 37.63kVA. The difference between
the PV hosting capacity computed with the
probabilistic and the deterministic approach for these
cases (considering only voltage margin) is not as big
as for scenarios A and B. Indeed, in scenarios A and
Photovoltaic Integration in Smart City Power Distribution - A Probabilistic Photovoltaic Hosting Capacity Assessment based on Smart
Metering Data
175

B, the volatile character and the extremely rare
coincidence of worst case values for 12 units cannot
be reliably represented by a deterministic model.
Regarding the distribution of units among phases,
the comparison of scenarios A and B shows that the
existing phase unbalance affected the computation.
Indeed, the violated parameter in this case is voltage
magnitude of phase (C) although all new PV units are
connected to phase (B). Therefore, the unfair
distribution of new PV units among phases did not
directly affect P
unbalance
but it had an impact on the
voltage magnitude of phase (C). Considering voltage
limits, the aggregated PV hosting capacity for
scenario B resulted equal to 144.63kVA, if one
considers only voltage constraints. However, the
connection of most new PV units at phase (B) resulted
in very high current values so that the maximum
current capacity was exceeded by 50%.
In scenario F, the connection of new PV units by
means of three-phase inverters integrating three-
phase damping control can increase the aggregated
hosting capacity by 36%, considering voltage margin.
Thanks to the resistive behaviour of this control
scheme towards the zero- and negative-sequence
voltage component, the deviation of voltage
magnitude and unbalance becomes much smoother
compared to the currently applied on-off control.
Thus, the risk of exceeding the defined limits is
reduced and a bigger share of PV generation can be
integrated. Applying this control in scenario C would
definitely lead to even higher PV hosting capacity.
Based on the results of scenario G, reactive power
control does not result in higher PV hosting capacity
compared to scenario A (on-off control). Voltage
profile in the feeder is however improved compared
to scenario A. As a matter of fact, voltage limits are
not violated in scenario G whereas the maximum
current capacity limit is exceeded for the same
amount of PV integration compared to scenario A.
In the first two cases (scenarios A and B),
comparing the probabilistic simulation results to the
respective ones of the deterministic approach, an
important difference in the aggregated admissible
hosting capacity is observed. One should notice that
the violated parameter in the deterministic
approaches is mainly the voltage magnitude and
secondly the maximum current capacity of the lines.
The deterministic approach led to 58-146% lower
aggregated PV hosting capacity (compared to the one
computed with the probabilistic approach) due to a
violation that according to the probabilistic
elaboration of the historic SM dataset took place for
much less than 6% of the simulated system states.
Indeed, based on figure 8, the addition of 12 new PV
units of 4kVA each (deterministic scenario A.I)
generated an overvoltage risk that is lower than 1%.
The studied feeder currently hosts 22.63kVA of
distributed PV generation and supplies 19 residential
customers. The analysis of the current conditions
(based on the historic SM datasets) demonstrated that
both voltage violation risk and congestion risk are
very low. Moreover, the above probabilistic load-
flow analysis proved that congestion and voltage
problems will only appear if 48kVA and 132kVA
respectively of distributed PV generation (scenario
A) are further integrated. This remark highlights the
cost-efficiency of designing distribution networks
based on the most frequent system states and on well-
studied future scenarios. Such probabilistic approach
can lead to customised solutions and help to avoid
over-dimensioning and costly initial investments for
the DSO.
Finally, a general remark concerns the self-
sufficiency potential of the feeder. Based on the
available user specific data, the annual generated PV
energy in the feeder is in the range of 22400kWh
corresponding to 22.63kVA of currently installed PV
generation. The annual aggregated load for all users
is in the range of 87200kWh. Given that PV users are
entirely correlated regarding their PV profiles, the
potential annual PV generation in the whole feeder
has been roughly estimated for each analysed
scenario s as follows:
,,,
,
∙
(6)
where
,
isthe reference factor introduced in (3)
applied for the total installed PV generation in
scenario s and
is the total annual generated PV
energy in the feeder at present (≈22400kWh). The
estimation demonstrated that the annual potential PV
generation in scenarios A, C, F and E would
correspond to 80 to 107% of the annual load in the
feeder (with hosting capacity considering both
voltage margin and line capacity). This is only an
orders of magnitude observation. For determining the
self-sufficiency of the feeder, further studies should
be deployed, including congestion risk or other
technical and economic issues that would have to be
encountered for storing the generated PV power
(Thirugnanam et al., 2015).
However, based on this rough estimation, certain
renewable integration scenarios could potentially
increase to an important extent the self-sufficiency of
feeders like the studied one. As a result, their
dependency on big conventional power plants,
connected at the transmission level, could be
efficiently reduced. However, big conventional plants
SMARTGREENS 2016 - 5th International Conference on Smart Cities and Green ICT Systems
176

are important for maintaining grid stability. In a high
DER integration scenario, without large and reactive
storage facilities and/or flexibility services, the
amount of RES should be carefully reviewed. To this
end, costs induced by the use of grid services,
including insurance against periods when it is not
possible to consume own generated electricity, should
be considered and reflected in the bill of generator
owners (EDSO 2015). Reliable feasibility studies and
comprehensive CBAs are necessary for evaluating
various strategies in the decision making process.
7 CONCLUSIONS
This paper addresses the problem of determining the
maximum PV hosting capacity that can be
accommodated in a LV distribution feeder, while
respecting local technical standards. To this purpose,
a probabilistic simulation tool that uses as input user-
specific SM energy flow data and feeder-specific
parameters is presented. A PV hosting capacity
review for a municipal area in Belgium is used as a
case study for evaluating the usefulness and reliability
of the proposed tool. The study outcome
demonstrates that it is to the interest of the DSO and
of the grid users to deploy probabilistic analysis that
considers the time-variability of load/PV generation,
both in the time axis and between different users’
profiles. This variability of network state can be taken
into account thanks to the deployment of long-term
SM measurements. Consequently, the further
deployment of SM devices is strongly recommended
for a more cost effective long-term planning and
coordination of the LV network.
ACKNOWLEDGEMENTS
The authors of this chapter acknowledge the support
of ORES, the DSO who manages the electricity and
natural gas distribution grids in 193 communes in
Wallonia (Belgium), in terms of funding and SM data
supply, both indispensable elements for conducting
this research work.
REFERENCES
Antoni Klajn, M.B.-P., 2013. Application Note Standard
EN50160 Voltage Characteristics of Electricity
Supplied by Public Electricity Networks. , (March).
Billinton, R. & Bagen, 2006. Generating capacity adequacy
evaluation of small stand-alone power systems
containing solar energy. Reliability Engineering and
System Safety, 91(4), pp.438–443.
Billinton, R. & Karki, R., 2003. Reliability/cost
implications of utilizing photovoltaics in small isolated
power systems. Reliability Engineering and System
Safety, 79(1), pp.11–16.
Bollen M.H.J. & Hassan, F., 2011. Integration of
Distributed Generation in the Power System IEEE
Press., Wiley. Available at: http://site.ebrary.com/
id/10494547.
CEI, C.E.I., 2012. Reference technical rules for the
connection of active and passive users to the LV
electrical utilities,
Conti, S. et al., 2003. Integration of multiple PV units in
urban power distribution systems. Solar Energy, 75(2),
pp.87–94.
Conti, S. & Raiti, S., 2007. Probabilistic load flow using
Monte Carlo techniques for distribution networks with
photovoltaic generators. Solar Energy, 81(12),
pp.1473–1481.
EDSO, 2015. European Distribution System Operators for
Smart Grids Adapting distribution network tariffs to a
decentralised energy future,
Electric Power Research Institute, 2012. Stochastic
Analysis to Determine Feeder Hosting Capacity for
Distributed Solar PV 1026640,
EN50160, 2012. Voltage characteristics of electricity
supplied by public electricity networks,
FP7 INCREASE Project, http://www.project-increase.eu/.
Hernandez, J.C., Ruiz-Rodriguez, F.J. & Jurado, F., 2013.
Technical impact of photovoltaic-distributed generation
on radial distribution systems: Stochastic simulations for
a feeder in Spain. International Journal of Electrical
Power and Energy Systems, 50(1), pp.25–32.
IEC, IEC, 60364-5-52 Table A5210.
Klonari, V. et al., 2015. Probabilistic Analysis Tool of the
Voltage Profile in Low Voltage Grids. In 23rd CIRED.
Klonari, V. et al., 2016. Probabilistic Assessment of a
Voltage Unbalance Mitigation Control Scheme. In
Energycon.
Lefebvre, S., 2015. Contribution à l’utilisation d’un outil
d’analyse technico-économique de réseaux de
distribution Basse Tension en l’absence de compteurs
électriques intelligents,
Meersman, B. et al., 2011. Three-phase inverter-connected
DG-units and voltage unbalance. Electric Power
Systems Research, 81(4), pp.899–906. Available at:
http://dx.doi.org/10.1016/j.epsr.2010.11.024.
Noone, B. (Australian P.A., 2013. PV Integration on
Australian distribution networks: Literature review,
Rousseaux, P. et al., 2015. A new formulation of state
estimation in distribution systems including demand
and generation states. In Powertech.
Ruiz-Rodriguez, F.J., Hernández, J.C. & Jurado, F., 2012.
Probabilistic load flow for photovoltaic distributed
generation using the Cornish-Fisher expansion. Electric
Power Systems Research, 89, pp.129–138.
Shedd, S. et al., 2012. A Statistical Characterization of
Solar Photovoltaic Power Variability at Small
Photovoltaic Integration in Smart City Power Distribution - A Probabilistic Photovoltaic Hosting Capacity Assessment based on Smart
Metering Data
177

Timescales Preprint. Workshop on Integration of Solar
Power into Power Systems Conference, (August).
Smith, J., 2015. Alternatives to the 15% Rule: Modeling
and Hosting Capacity Analysis of 16 Feeders,
Solar City Grid Engineering, 2015. Integrated Distribution
Planning: A holistic approach to meeting grid needs
and expanding customer choice by unlocking the
benefits of distributed energy resources,
Thirugnanam, K. et al., 2015. Battery Integrated Solar
Photovoltaic Energy Management System for Micro-
Grid. In ISGT ASIA.
Vallee, F. et al., 2013. Development of a probabilistic tool
using Monte Carlo simulation and smart meters
measurements for the long term analysis of low voltage
distribution grids with photovoltaic generation.
International Journal of Electrical Power & Energy
Systems, 53, pp.468–477. Available at: <Go to
ISI>://WOS:000325445600049.
Vallée, F. et al., 2015. Clustering of Photovoltaic
Generation for the Consideration of Time Changing
Geographical Correlation in Probabilistic Analysis of
Low Voltage Distribution Systems. In 5th Solar
Integration Workshop.
SMARTGREENS 2016 - 5th International Conference on Smart Cities and Green ICT Systems
178
