
Stereo Vision-based Local Occupancy Grid Map for Autonomous
Navigation in ROS
Pablo Mar
´
ın-Plaza, Jorge Beltr
´
an, Ahmed Hussein, Basam Musleh, David Mart
´
ın,
Arturo de la Escalera and Jos
´
e Mar
´
ıa Armingol
Intelligent Systems Lab (LSI) Research Group,
Universidad Carlos III de Madrid (UC3M), Leganes, Madrid, Spain
Keywords:
Occupancy Grid Map, Stereo Vision, Autonomous Navigation, ROS.
Abstract:
Autonomous navigation for unmanned ground vehicles has gained significant interest in the research com-
munity of mobile robotics. This increased attention comes from its noteworthy role in the field of Intelligent
Transportation Systems (ITS). In order to achieve the autonomous navigation for ground vehicles, a detailed
model of the environment is required as its input map. This paper presents a novel approach to recognize static
obstacles by means of an on-board stereo camera and build a local occupancy grid map in a Robot Operating
System (ROS) architecture. The output maps include information concerning the environment 3D structures,
which is based on stereo vision. These maps can enhance the global grid map with further details for the
undetected obstacles by the laser rangefinder. In order to evaluate the proposed approach, several experiments
are performed in different scenarios. The output maps are precisely compared to the corresponding global
map segment and to the equivalent satellite image. The obtained results indicate the high performance of the
approach in numerous situations.
1 INTRODUCTION
During the last decade, the number of mobile robots
in the market has rapidly grown, dealing with in-
creasingly complex tasks, such as autonomous nav-
igation. These tasks make necessary an extensive
knowledge of the surroundings. Nowadays, there
are several methods in order to obtain information
from the environment. From a point of view of
the sensor, it is possible to divide into two groups.
Firstly, there are plenty of algorithms based on laser
(Broggi et al., 2008) (Urmson et al., 2008), which
provide high precision measurements although they
do not supply, in most cases, enough information for
a correct classification of the elements in the environ-
ment. Furthermore, sensors based on computer vision
are information-rich systems, especially stereo vision
systems, at the expense of a worse precision. Stereo
vision algorithms are one of the key methods to detect
obstacles and free space ahead the vehicle (Bernini
et al., 2014); concretely, most authors represent this
information as the obstacle map and the free map
(Guo et al., 2009) (Soquet et al., 2007) (Musleh et al.,
2012). These maps are usually obtained from the uv-
disparity (Hu et al., 2005) (Labayrade and Aubert,
2003). Regarding autonomous navigation, the infor-
mation of the obstacles and free spaces in the sur-
roundings is usually displayed by means of an occu-
pancy grid map (Thrun, 2001) (Thrun, 2003).
It is essential to estimate the pose of the camera
with respect to the ground in order to obtain reliable
measurements of the environment. This camera pose
estimation has been performed in a variety of ways by
researchers. For instance, a calibration pattern can be
laid on the ground in front of the vehicle for an off-
line estimation (Hold et al., 2009b). However, this
method does not permit updating possible variations
of the camera pose while the vehicle is moving. This
disadvantage is surmounted by way of making use of
landmarks of the road (Hold et al., 2009a) (Li and Hai,
2011), such as traffic lines (De Paula et al., 2014),
calibration pattern or utilizing the geometry estima-
tion of the ground in front of the vehicle (Cech et al.,
2004) (Teoh et al., 2010) (Musleh et al., 2014). This
geometry estimation makes it possible to find out the
pose of the camera while avoiding the necessity of a
calibration pattern or landmarks.
The main contribution of this work proposes a
Marín-Plaza, P., Beltrán, J., Hussein, A., Musleh, B., Martín, D., Escalera, A. and Armingol, J.
Stereo Vision-based Local Occupancy Grid Map for Autonomous Navigation in ROS.
DOI: 10.5220/0005787007010706
In Proceedings of the 11th Joint Conference on Computer Vision, Imaging and Computer Graphics Theory and Applications (VISIGRAPP 2016) - Volume 3: VISAPP, pages 703-708
ISBN: 978-989-758-175-5
Copyright
c
2016 by SCITEPRESS – Science and Technology Publications, Lda. All rights reserved
703
method to obtain a robust and instant local occupancy
grid map. It is used for exploiting the good trade-
off between stereo vision information and embed-
ded ROS-based processes, in order to create an envi-
ronment domain knowledge for outdoor autonomous
navigation.
The remainder of this paper is organized as fol-
lows; Section 2 describes the platform used for the ex-
periments. Followed by Section 3, which introduces
the proposed algorithms to generate a grid map from
a stereo camera. Section 4 explains the experimental
results from different scenarios. Finally the conclu-
sions and future work are summarized in Section 5.
2 PLATFORM DESCRIPTION
For this work, the experiments took place in a project
of autonomous ground vehicle called iCab (Intelligent
Campus Automobile). It is an electric golf cart vehi-
cle, E-Z-GO model, which is modified mechanically
and electronically to satisfy the goal of autonomous
navigation from one point to another within campus
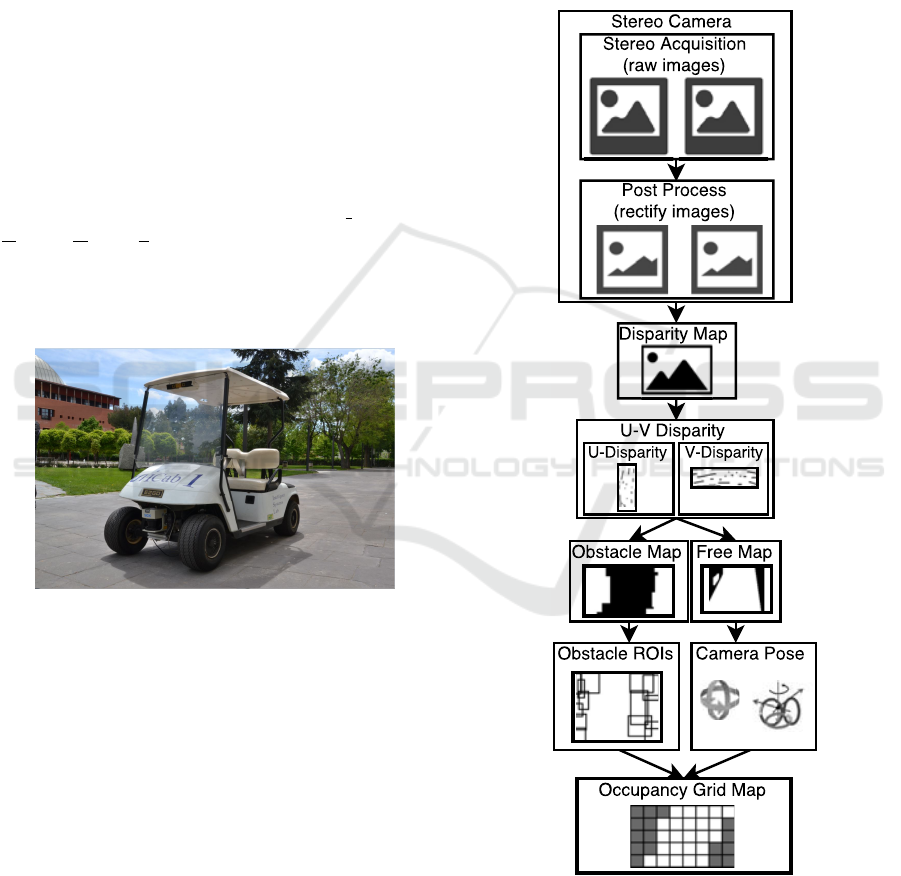
vicinity, as shown in Figure 1.
Figure 1: Research platform: iCab 1.
The vehicle has electronic actuators installed for
the translational and rotational motion. The throt-
tle paddle is deactivated and the traction electric mo-
tor of forward and backward motion is controlled by
means of a power amplifier circuit. In addition to
the steering wheel is removed and replaced by elec-
tric motor-encoder system for autonomous steering.
Moreover, the vehicle is equipped with multiple sen-
sors for the environment perception, such as laser
rangefinder ”SICK LMS 291” (Intelligence, 2006)
and a stereo vision binocular camera ”Bumblebee 2”
(Grey, 2012).
Furthermore, the vehicle has an on-board embed-
ded computer with Intel Core i7 processor, which
is running under Ubuntu operating system. All the
algorithms are implemented under Robot Operating
System (ROS) architecture, in order to communicate
the different processes and fuse multiple sensors data
with time stamp of different devices.
ROS has been selected among various middle-
ware such as; Player, YARP, Orocos, CARMEN,
Orca, MOOS, and Microsoft Robotics Studio. YARP
has similar features compared to ROS, nevertheless
ROS provides a standard method of dealing with the
localization and navigation problems, which are the
core issues for this project. The overall work-flow
scheme is shown in Figure 2.
Figure 2: ROS Work-flow Scheme.
3 ALGORITHM
The generation of the occupancy map uses the outputs
VISAPP 2016 - International Conference on Computer Vision Theory and Applications
704
of the stereo vision stage as input. These outputs cor-
respond to the camera pose estimation, on the one
hand, and the information about the obstacles and the
free spaces ahead the vehicle on the other hand.
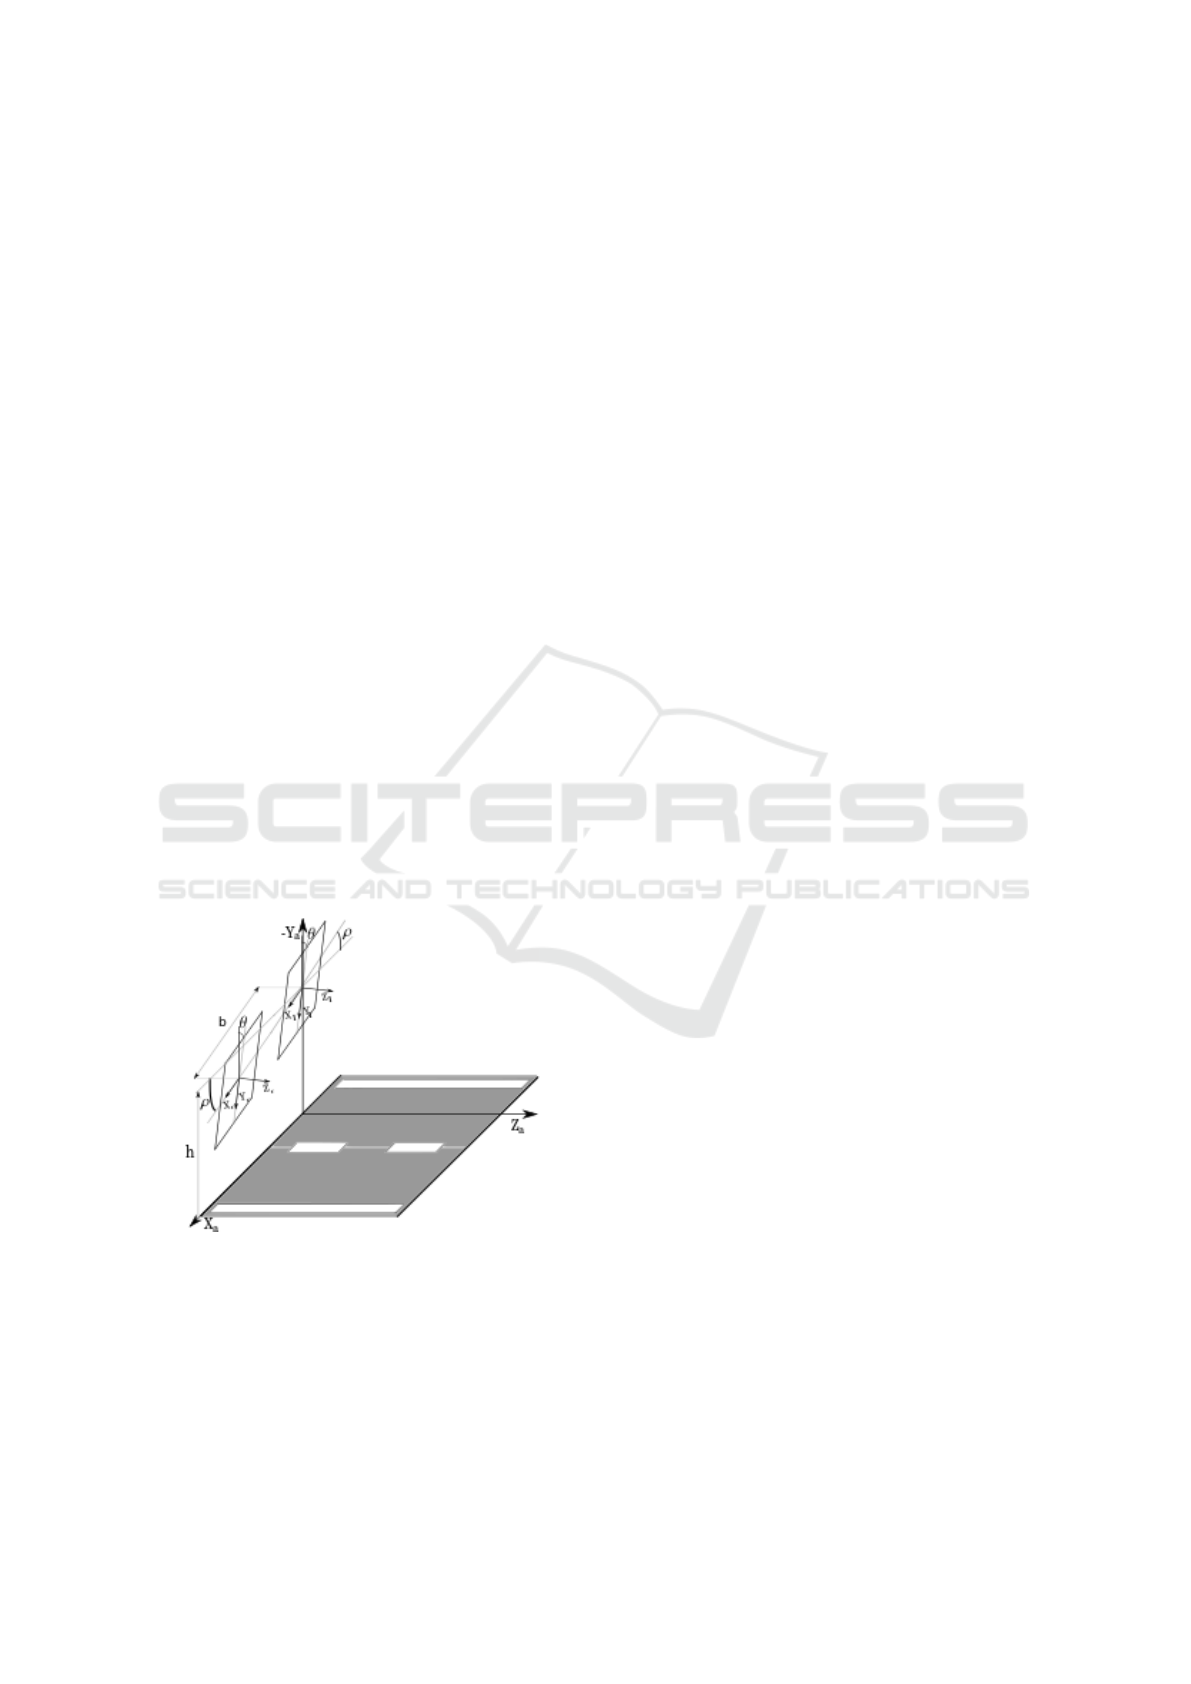
The camera pose estimation is based on obtaining
constantly the extrinsic parameters of the stereo sys-
tem with respect to the ground, as shown in Figure
3. In other words, estimating the values of the height
”h”, pitch angle ”θ” and roll angle ”ρ” at all times.
It is necessary to perform a prior calibration process
in order to obtain the values of the intrinsic param-
eters; baseline ”b”, focal length ”α” and optic center
”u
0
,v
0
”. The proposed method to estimate the camera
pose is the presented in (Musleh et al., 2014), which
is based on the geometry of the ground ahead of the
vehicle.
The obstacle and the free spaces detection are
computed with the proposed method presented in
(Musleh et al., 2012). This method creates the dis-
parity map by means of the stereo images, as shown in
Figure 2. This map contains the information about the
depth ”Z”, where the value of each pixel corresponds
to its disparity ”∆” level. Afterwards, it is possible to
compute the uv-disparity (Hu et al., 2005). Accord-
ingly, the u-disparity, that depicts with higher value
pixels corresponding to obstacles, can be thresholded.
Finally, the disparity map is traversed and the pixels
of each column with disparity value correspond to a
white pixel in the u-disparity belong to obstacle map.
Every other pixel with known disparity level is set as
free map.
Figure 3: Camera Pose Scheme.
3.1 Occupancy Map Generation
The grid map is generated, as soon as the free space
and obstacle maps are built, along with the extrinsic
parameters of the camera are computed. Taking into
consideration the obstacle segmentation is performed
following the same method in (Musleh et al., 2011),
by subtracting edges to the previously computed ob-
stacle map. Afterwards the mask is divided into sev-
eral Regions Of Interest (ROIs).
The bounding boxes are obtained for each ROI,
which indicates that the obstacles are easier to han-
dle. A single disparity value ”∆” is assigned to each
region. This value corresponds to the mode of the dis-
parity ”∆” values of each obstacle pixels.
Once obstacles are segmented and have an as-
sociated disparity value ”∆”, real world coordinates
are computed by using equations (1). More informa-
tion regarding the equations derivation is available in
(Musleh et al., 2014).
X = (b cos θ sin ρ(v − v
0
) + b cos ρ(u − u
0
)+
+ αbsinρsinθ)/∆
Y = − h + (bcosρcosθ(v − v
0
) − b sin ρ(u − u
0
)+
+ αbcosρsinθ)/∆
Z = (αb cos θ − b sin θ(v − v
0
))/∆
(1)
For each bounding box, the elevation in Y-
coordinate is computed from its bottom-left corner
and classified into one of two categories; on-road or
elevated. If the elevation of the obstacle is greater
than a specific threshold, which is close to zero, it is
considered on-road obstacle otherwise it is elevated
obstacle. This algorithm assumes all pixels of an ob-
stacle are at the same distance of the camera. There-
fore, those located closer to the sensor may be frag-
mented into different regions, due to their disparity
levels. Moreover, by applying the disparity mode ”∆”
as obstacle depth in the given equations at the bottom-
left coordinate, which might belong to a free-space
pixel, the output elevation may result a little bit bi-
ased even if the provided values correspond to under-
ground elevations. This limitation is the main rea-
son to use a threshold for obstacle classification; in-
stead of only considering those with Y = 0 as the ones
placed on the ground plane.
To maximize the impact of the implementation
and as a result of the arguments depicted in Section
2, the grid map generated in this work is built on top
of ROS message type OccupancyGrid. This is consid-
ered to be a standardized data type, due to the rapid
growth of ROS researchers community. Each pixel
of the map represents a certain area in the real world
with respect to the grid resolution, also it is associated
with a gray level that describes its probability of being
occupied by an obstacle using the convention shown
in Table 1.
Three levels of confidence are used for occupancy
representation, due to the reduction of the resolution
along the distance growth in the stereo-vision system.
Stereo Vision-based Local Occupancy Grid Map for Autonomous Navigation in ROS
705
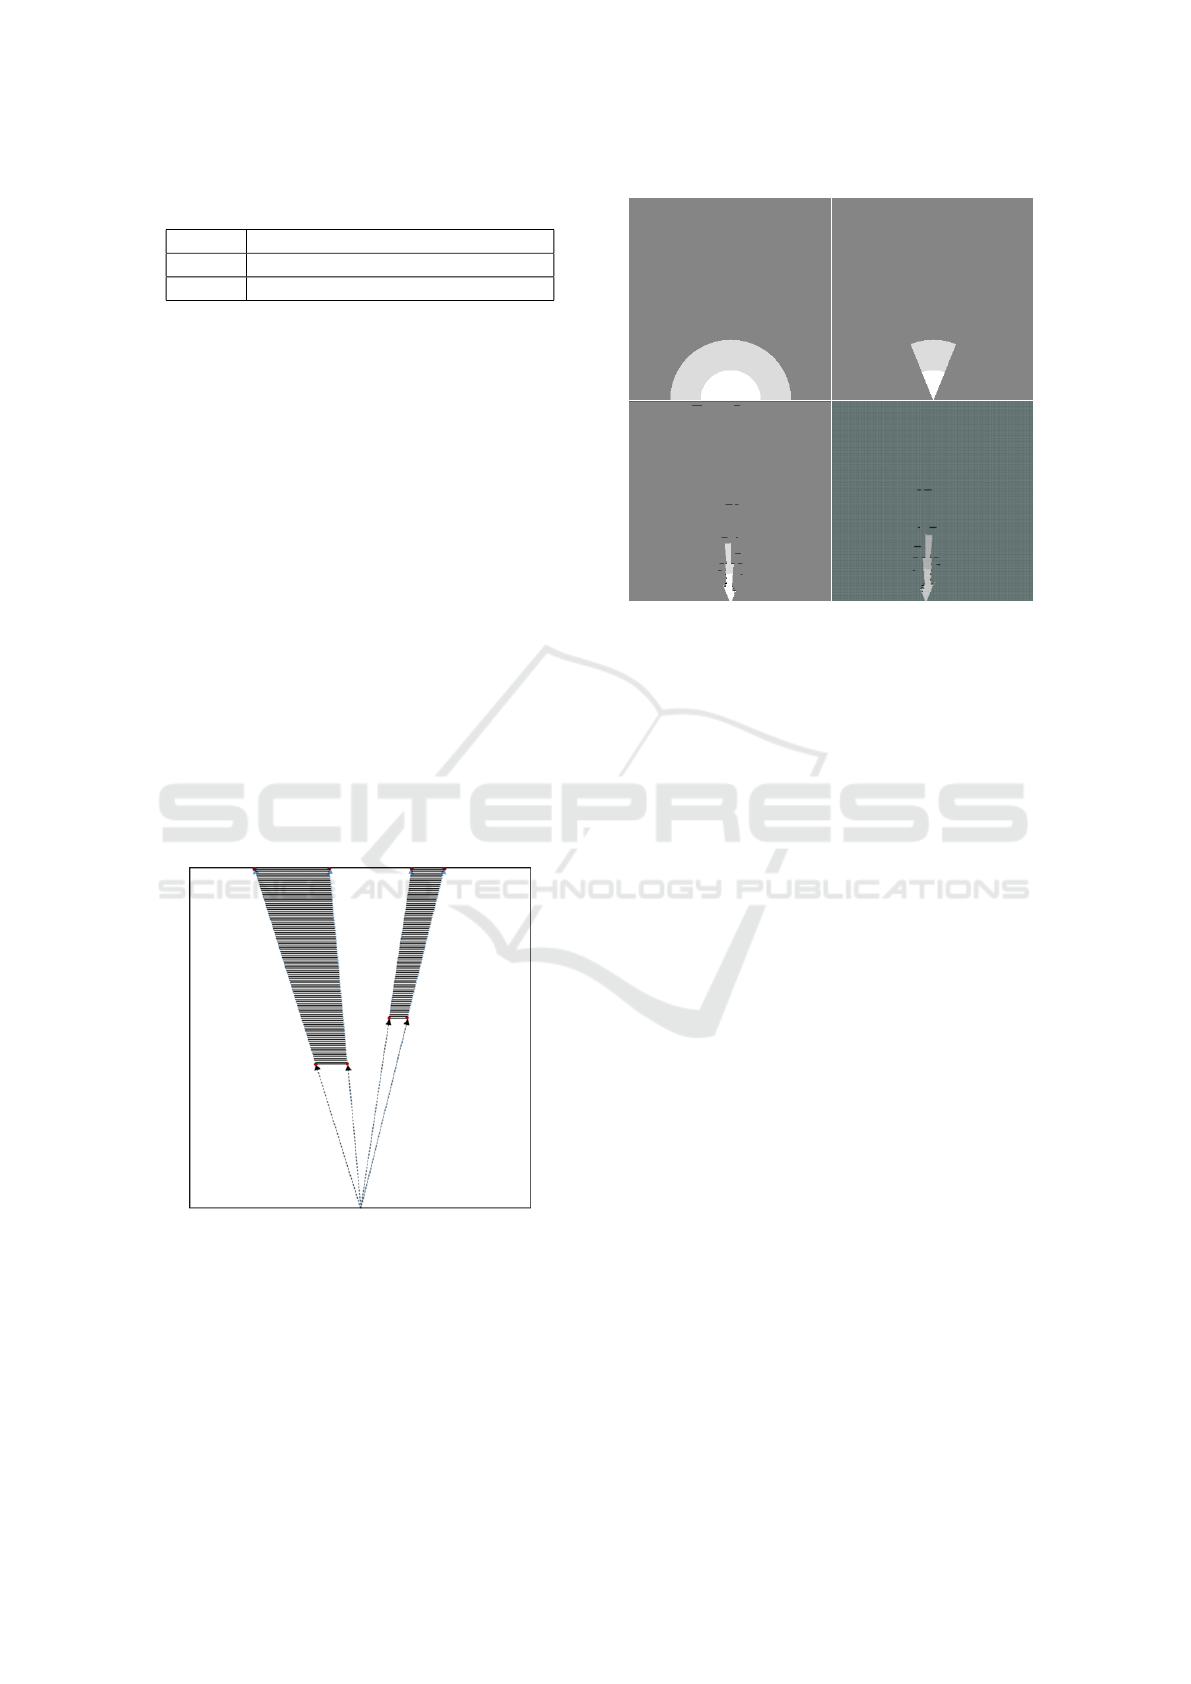
Table 1: Occupancy probability values.
Value Meaning
-1 Unknown space
0 - 100 Probability of being occupied
For the closest area around the camera, up to 22m,
the certainty of the sensor is good enough to be con-
sidered as free space pixels, which set their probabil-
ity to zero. However, in the range between 22m and
45m, the free space pixels probability is set to 14. If
any obstacle is detected, the probability is set to 100.
Before computing the location of obstacles in the
map, the grid is prepared to represent only points of
the world laying within camera’s visibility range. For
this purpose, the X and Y coordinates of the top cor-
ners of the disparity map are computed taking maxi-
mum depth ”∆ = 1”. Thus, map position of the right-
most and left-most points along the X axis are ob-
tained. After that, two lines are drawn from the cam-
era coordinates, at the bottom-center of the occupancy
grid, to those pixels and both pieces of map falling out
of the visible angle are marked as unknown.
After setting up the occupancy grid for the sensor
characteristics, obstacles and occlusions are drawn.
First, the X and Z coordinates (1) of the bottom ver-
tices of each ROI are calculated, which compute the
occluded areas. The algorithm for this process is
based on ray-tracing, as shown in Figure 4).
Figure 4: Ray-tracing algorithm for occlusion computation.
Accordingly, a ray is traced from the camera loca-
tion to each point, in order to obtain their line equa-
tions. Later, these equations compute the X coordi-
nate of the farthest points in the map, which enable
the elongation of the rays from the camera to the ob-
stacles vertices until the end of the map. Finally, the
area enclosed among the four points is set as unknown
and a line representing the obstacle is drawn between
Figure 5: From top-left to bottom-right, occupancy map at
each step of the building process.
its vertices. The result of the different steps of the
algorithm is shown in Figure 5.
4 RESULTS
In order to measure the overall quality of the gen-
erated occupancy grid map, it is necessary to com-
pare the results over a specific ground truth, such as a
satellite image from Google Maps with the appropri-
ate scale. Each cell of the grid map is 0.5x0.5m
2
, the
distance scale in the images is 5m and the correlation
is performed via visual analysis.
The experiments are carried out in different loca-
tions within the university campus vicinity. The first
scenario tests the grid map generation between two
walls with a 5m gap for calibration. While the sec-
ond scenario takes place near a building wall with a
low-height obstacle.
4.1 Calibration Scenario
Figure 6 shows the grid map on the left, the obsta-
cle ROIs image on the top-right and the grid map in
a real scenario overlapped with the satellite image on
bottom-right. The environment has been selected for
calibration purposes. The vehicle drives in hallway
of 5m width between two buildings walls. The lo-
cal occupancy grid map shows the obstacles as black
cells, the free space as white cells and the uncertain
space as gray cells. The walls appear as disconnected
obstacles, due to the limitations of the disparity map.
Moreover, the most left part of the map is detected as
VISAPP 2016 - International Conference on Computer Vision Theory and Applications
706
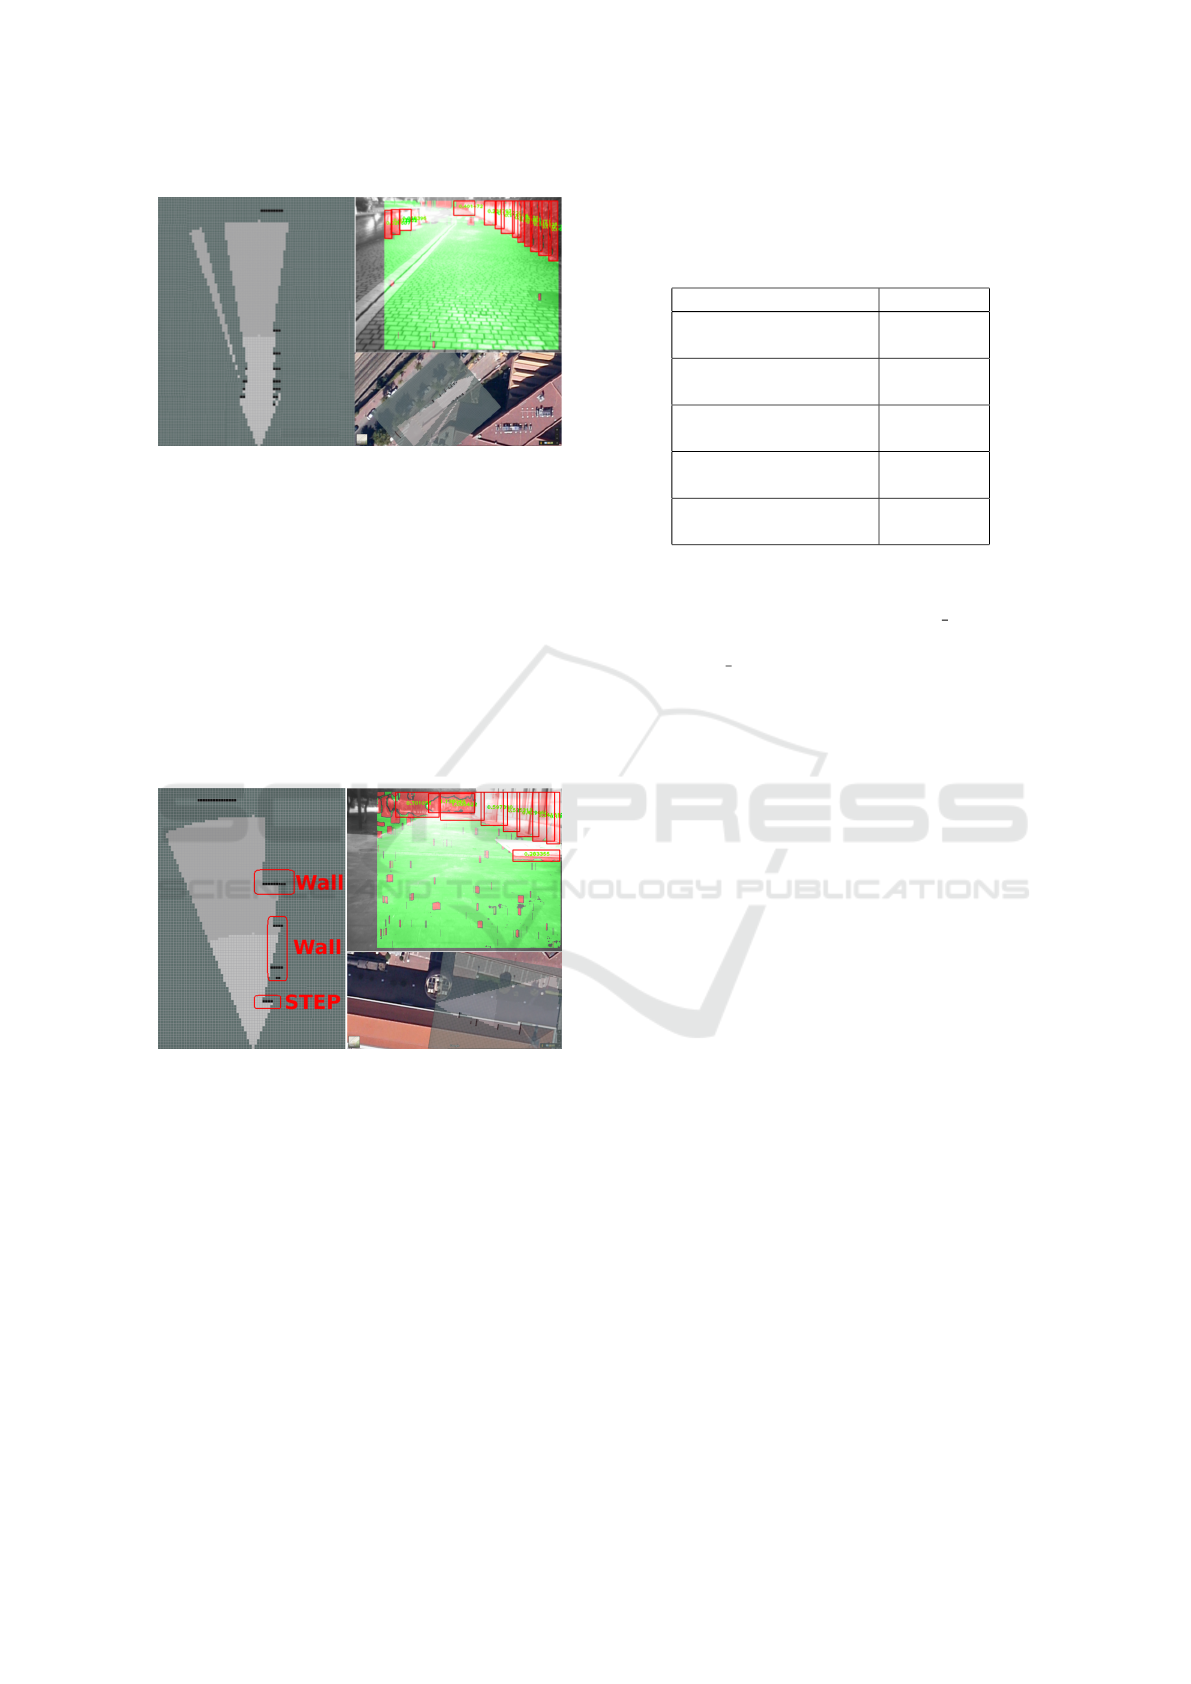
Figure 6: Calibration Scenario.
free-space, as a limitation of the algorithm while deal-
ing with the common area of the binocular camera.
4.2 Low-height Obstacle Scenario
The second scenario shows the importance of us-
ing visual occupancy grid map in order to add more
information to the map generated from the laser
rangefinder. At which, there is a non-navigable step
on the right of the vehicle position. Due to the laser
plane is higher than the step, the laser rangefinder
does not detect the obstacle, as shown in Figure 7.
Figure 7: Low-height Obstacle Scenario.
In this scenario, the occupancy grid map over-
lapped with satellite map is on the bottom-right cor-
ner. While the analysis of the obstacle ROIs is on the
top-right corner, which shows the low-height obstacle
marked in a red box over the free space map, marked
in green. This non-navigable step is included in the
local occupancy grid map, which is located on the left
part of the image.
4.3 Computational Time
The measured time for all the processes is shown in
Table 2. The total time starts from the beginning of
each callback until publishing the specific message
by topic. Free map, uv-disparity map and obstacle
ROIs are calculated in the same process, one after
each other in order to save time.
Table 2: Computational Time.
Process Time [ms]
Disparity
Map
68.3
Free Map, uv-disparity
and Obstacle ROIs
9.7
Camera
Pose
9.4
Local Occupancy
Grid Map
89.8
Total
Time
177.2
The messages used by all the processes are the
common standard messages in ROS. For the im-
ages with different codifications, sensor msgs Image
stamped is used. However, for the local occupancy
grid map nav msgs OccupancyGrid stamped is used.
The stereo camera images are publishing at a rate of
20Hz, one pair each 50ms and the average published
rate of the grid map is 17Hz.
5 CONCLUSIONS
In this article, local occupancy grid map is studied as a
complex and essential task for autonomous navigation
in outdoor environments. A reliable solution has been
proposed by using a stereo camera and a ROS-based
system for obtaining an instant local grid map for
an autonomous ground vehicle. The presented local
map enriches the environment with further informa-
tion in comparison with laser measurements, where
laser data provide only spot information of the obsta-
cle distances. Moreover, stereo vision provides unob-
servable information by laser measurements.
In comparison to the simple laser rangefinder ap-
proaches to generate a grid map, the presented sys-
tem extensively demonstrates its usefulness through
results under demanding circumstances; such as laser
outages or degraded reflected beams, while maintain-
ing the 3D information accuracy in outdoor scenar-
ios. This computer vision and ROS-based approach
can be applied, using moderate-cost available sen-
sors, in the forthcoming tasks of the autonomous ve-
hicles, which require reliable and instant local oc-
cupancy map in outdoor environments. These tasks
are, but are not limited to, autonomous cooperative
driving, automatic maneuver for pedestrian safety, au-
tonomous collision avoidance and autonomous navi-
gation, among others.
Stereo Vision-based Local Occupancy Grid Map for Autonomous Navigation in ROS
707

Future aspects of this work include working on a
region of interest for grouping and binding the obsta-
cles. This allow detecting all obstacles apart of the
perpendicular obstacles to the stereo camera plane.
Another future element to consider is to accumulate
the environment information from several frames, to
enrich the environment representation.
ACKNOWLEDGEMENTS
This work was supported by the Spanish Government
through the CICYT projects (TRA2013-48314-C3-1-
R) and Comunidad de Madrid through SEGVAUTO-
TRIES (S2013/MIT-2713).
REFERENCES
Bernini, N., Bertozzi, M., Castangia, L., Patander, M.,
and Sabbatelli, M. (2014). Real-time obstacle detec-
tion using stereo vision for autonomous ground vehi-
cles: A survey. In Intelligent Transportation Systems
(ITSC), 2014 IEEE 17th International Conference on,
pages 873–878. IEEE.
Broggi, A., Cappalunga, A., Caraffi, C., Cattani, S., Ghi-
doni, S., Grisleri, P., Porta, P., Posterli, M., Zani, P.,
and Beck, J. (2008). The passive sensing suite of the
terramax autonomous vehicle. In Intelligent Vehicles
Symposium, 2008 IEEE, pages 769–774. IEEE.
Cech, M., Niem, W., Abraham, S., and Stiller, C. (2004).
Dynamic ego-pose estimation for driver assistance in
urban environments. In Intelligent Vehicles Sympo-
sium, 2004 IEEE, pages 43–48. IEEE.
De Paula, M., Jung, C., et al. (2014). Automatic on-
the-fly extrinsic camera calibration of onboard ve-
hicular cameras. Expert Systems with Applications,
41(4):1997–2007.
Grey, P. (2012). Bumblebee: stereo vision camera systems.
Technical Description.
Guo, C., Mita, S., and McAllester, D. (2009). Drivable road
region detection using homography estimation and ef-
ficient belief propagation with coordinate descent op-
timization. In Intelligent Vehicles Symposium, 2009
IEEE, pages 317–323. IEEE.
Hold, S., Gormer, S., Kummert, A., Meuter, M., and
Muller-Schneiders, S. (2009a). A novel approach for
the online initial calibration of extrinsic parameters
for a car-mounted camera. In Intelligent Transporta-
tion Systems, 2009. ITSC’09. 12th International IEEE
Conference on, pages 1–6. IEEE.
Hold, S., Nunn, C., Kummert, A., and Muller-Schneiders,
S. (2009b). Efficient and robust extrinsic camera cal-
ibration procedure for lane departure warning. In In-
telligent Vehicles Symposium, 2009 IEEE, pages 382–
387. IEEE.
Hu, Z., Lamosa, F., and Uchimura, K. (2005). A complete
uv-disparity study for stereovision based 3d driving
environment analysis. In 3-D Digital Imaging and
Modeling, 2005. 3DIM 2005. Fifth International Con-
ference on, pages 204–211. IEEE.
Intelligence, S. S. (2006). Lms200/211/221/291 laser mea-
surement systems. Technical Description.
Labayrade, R. and Aubert, D. (2003). In-vehicle obstacles
detection and characterization by stereovision. Proc.
IEEE In-Vehicle Cognitive Comput. Vis. Syst, pages
1–3.
Li, S. and Hai, Y. (2011). Easy calibration of a blind-spot-
free fisheye camera system using a scene of a park-
ing space. Intelligent Transportation Systems, IEEE
Transactions on, 12(1):232–242.
Musleh, B., de la Escalera, A., and Armingol, J. M. (2011).
Real-time pedestrian recognition in urban environ-
ments. In Advanced Microsystems for Automotive Ap-
plications 2011, pages 139–147. Springer.
Musleh, B., de la Escalera, A., and Armingol, J. M. (2012).
Uv disparity analysis in urban environments. In Com-
puter Aided Systems Theory–EUROCAST 2011, pages
426–432. Springer.
Musleh, B., Martin, D., Armingol, J. M., and de la Escalera,
A. (2014). Continuous pose estimation for stereo vi-
sion based on uv disparity applied to visual odome-
try in urban environments. In Robotics and Automa-
tion (ICRA), 2014 IEEE International Conference on,
pages 3983–3988. IEEE.
Soquet, N., Perrollaz, M., Labayrade, R., Aubert, D., et al.
(2007). Free space estimation for autonomous navi-
gation. In 5th International Conference on Computer
Vision Systems.
Teoh, C., Tan, C., and Tan, Y. C. (2010). Ground plane de-
tection for autonomous vehicle in rainforest terrain. In
Sustainable Utilization and Development in Engineer-
ing and Technology (STUDENT), 2010 IEEE Confer-
ence on, pages 7–12. IEEE.
Thrun, S. (2001). Learning occupancy grids with forward
models. In Intelligent Robots and Systems, 2001. Pro-
ceedings. 2001 IEEE/RSJ International Conference
on, volume 3, pages 1676–1681 vol.3.
Thrun, S. (2003). Learning occupancy grid maps with for-
ward sensor models. Autonomous robots, 15(2):111–
127.
Urmson, C., Anhalt, J., Bagnell, D., Baker, C., Bittner, R.,
Clark, M., Dolan, J., Duggins, D., Galatali, T., Geyer,
C., et al. (2008). Autonomous driving in urban envi-
ronments: Boss and the urban challenge. Journal of
Field Robotics, 25(8):425–466.
VISAPP 2016 - International Conference on Computer Vision Theory and Applications
708
