
Analyzing Social Media Discourse
An Approach using Semi-supervised Learning
Álvaro Figueira
1
and Luciana Oliveira
2
1
CRACS/INESC TEC, University of Porto, Rua do Campo Alegre, Porto, Portugal
2
CICE/ISCAP & INESC TEC, Polytechnic of Porto, Porto, Portugal
Keywords: Social Media Publications, Text Mining, Automatic Categorization, Higher Education Sector,
Strategic Benchmarking.
Abstract: The ability to handle large amounts of unstructured information, to optimize strategic business
opportunities, and to identify fundamental lessons among competitors through benchmarking, are essential
skills of every business sector. Currently, there are dozens of social media analytics’ applications aiming at
providing organizations with informed decision making tools. However, these applications rely on
providing quantitative information, rather than qualitative information that is relevant and intelligible for
managers. In order to address these aspects, we propose a semi-supervised learning procedure that discovers
and compiles information taken from online social media, organizing it in a scheme that can be strategically
relevant. We illustrate our procedure using a case study where we collected and analysed the social media
discourse of 43 organizations operating on the Higher Public Polytechnic Education Sector. During the
analysis we created an “editorial model” that characterizes the posts in the area. We describe in detail the
training and the execution of an ensemble of classifying algorithms. In this study we focus on the techniques
used to increase the accuracy and stability of the classifiers.
1 INTRODUCTION
The undeniable growth of social media
environments has been introducing profound
changes in society and in the communication
management landscape. Though social media
impacts are still subject of research in a wide variety
of fields, in what organizations are concerned, two
main aspects are consistently revealed throughout
literature: the newly empowered role of millions of
social media users, co-creators, active voices and
active influencers, which organizations fail to
understand and engage with, and the fact that
organizations are still struggling with the
development of a social media strategy and budget,
thus mismanaging the potential and barriers
presented by the new consumer and by social
networks in general.
In fact, organizations are rushing into social
media networks following the worldwide trend to
create a social presence in multiple channels,
reaching for and aiming at mediatization, without
previously defining a clear strategic approach, which
should, for instance, be built upon clear insights on
their target audience and an editorial plan/calendar,
that can foster the achievement of the overall
business objectives. Nevertheless, when adopting
social media, organizations are, in fact, allocating
time, effort, skills, human resources and technology
and this raises the constant need to measure the
return on these investments (ROI) and legitimize
them in the context of organizational development.
However, how can organizations attempt to
measure the efficiency and return on investments on
a social media approach that has not been
strategically designed/aligned and is a set of
unarticulated processes and situational messages?
On top of the absence of a strategic alignment
between social media approaches and organizational
goals/performance, organizations are also lacking
strategically relevant social media monitoring
methods.
The social media analytics provided by the
thousands of free/commercial web based
applications are able to provide some interesting and
valuable insights, but fail to support a relevant and
insightful benchmarking process. Social media
monitoring has been turned into a process where
organizations are on the run to acquire, for instance,
more fans that their competitors’, more likes and, in
188
Figueira, Á. and Oliveira, L.
Analyzing Social Media Discourse - An Approach using Semi-supervised Learning.
In Proceedings of the 12th International Conference on Web Information Systems and Technologies (WEBIST 2016) - Volume 2, pages 188-195
ISBN: 978-989-758-186-1
Copyright
c
2016 by SCITEPRESS – Science and Technology Publications, Lda. All rights reserved

some cases, more positive feedback, where
sentiment analysis is part of the equation.
However, a well sustained strategic
benchmarking assessment that provides information
on the current implicit/explicit strategy and
knowledge on how to further develop it, it’s still
lacking.
Therefore, the assessment of social media
performance should rather be built upon the most
relevant business areas, as a key priority for
organizations that aim at turning social networks
into true business assets.
As a result, we present a persistent monitoring
methodology built upon benchmarking methods,
which rely heavily on the identification and analysis
of a set of strategically relevant editorial areas that
can foster organizational performance. According to
the proposed methodology, organizations are
propelled to focus not only on the traditional Social
Media key performance indicators, but to
incorporate them on a deeper editorial analysis that
may allow them to gain medium and long term
competitive advantage.
This article is organized as follows: in the next
section (2) we describe our methodology, focussing
on the development of an editorial model that will
allow us to categorize social media discourse. In
section 3 we present a case study where we applied
the methodology described. In this section we
elaborate on the type of data to retrieve from social
networks, on the ensemble of chosen algorithms, and
how to improve their accuracy as a whole. We finish
the section with a discussion on the techniques used.
In the last section (5) we present our conclusions.
2 METHODOLOGY
Our proposed approach is based on a 5-stage
method.
On a first stage we verify which are the social
networks being used by the organization under scope
(main agent) and by its direct competitors, on the
Higher Public Polytechnic Education Sector
(HPPES). In order to obtain a comprehensive
analysis, all social networks should be included and
a “representative” time frame should also be chosen.
The time frame that we believe to be the most
suitable is a one-year time frame, because it is in
itself cyclic and more likely to encompass a full
cycle of communication and product/service events.
After deciding on the social networks and on the
ideal time frame, all of the agent’s and agents’
competitors messages must be collected (posts,
tweets, etc.).
Hence, the second stage of the methodology
consists of gathering all the information about all the
sector’s agents’ activities on social media on:
messages’ content, the sector audience (type of
audience, number of fans, followers, etc.) and on the
corresponding responsiveness (likes, shares,
comments, retweets, etc.).
The third stage of the methodology consists of
identifying which are the most relevant areas of
intervention on social media, which we designate by
editorial areas. When this is not previously set by the
agent or is not very clear (i.e. a lack of a formal
content strategy is visible) a first human analysis and
classification of social media messages is required.
In this case, a small sample of messages manually
classified by a communication professional that
determines, in terms of editorial areas, which is the
purpose of each message. When doing so, a set of
guiding principles is considered for the HPPES in
particular, which lead to the construction of the
editorial model presented on section 3.2: (a) the
organizations/enterprise institutional (brand) needs
towards the diversity of stakeholders in its social
media networks; (b) the specifics of its
product(s)/service(s); (c) the need to balance
between institutional and transactional needs in
order to maintain reputation and ensure economic
survival; (d) a multi-channel wide holistic approach
to communication management which facilitates
integrated messages to take the most advantage of
each of the social networks being used; and the
dialogical nature that is intrinsically linked to social
media environments.
These principles should be considered in the
definition of an editorial model for every economy
sector. For instance, for common secondary sector
organizations the main editorial areas could focus
on: (a) core product/service advertisement; (b)
availability of additional services and/or available
customer support; (c) brand reputation (maintenance
/ reinstatement / re-branding, etc.) and (d)
relationship essential in every social media channel,
regardless of the economy / business sector.
The fourth stage of the methodology consists,
then, on the categorization of all the messages
retrieved from all the social networks against the
categories’ of the devised model. Although this is a
complexity linear problem (n × m), it might be too
demanding to be done by hand. In fact, a
categorization of n posts into m categories is a far
too heavy endeavour to be performed by humans if
we are consider thousands of posts and more than
two categories (the common situation). Therefore,
Analyzing Social Media Discourse - An Approach using Semi-supervised Learning
189
for this stage we use an ensemble of tuned
algorithms which are trained to classify posts in a
first moment, and that are presented the full sample
to classify, on a second moment. To mitigate the
occurrence of disputes in classifying a post
according to several possibilities, performed by
different algorithms, we take the majority of the
classifications and we leave unlabelled the posts for
which it was not possible to reach a majority.
Finally, the fifth stage of the methodology
consists on delivering a sectorial performance and
strategic benchmarking, aimed at social media
organizational success.
We begin by building a performance
benchmarking analysis based on social media key
performance indicators (KPI), such as ‘likes’,
‘shares’, ‘comments’, ‘retweets’, etc., using a
weighted scale, in order to measure audience
response to messages. We then measure each
market’s agent’s audience size (i.e. the number of
‘fans’, ‘followers’, etc.) and total communication
efforts (i.e. number of messages sent to social
networks).
These performance benchmarks allow us to build
a performance perceptual map of the sector, in
which we relate audience size, audience response
and the agents’ efforts.
The strategic benchmarking analysis is, then,
built on top of the previous analysis, adding the
social media strategies per agent (i.e. the different
combinations of intensities of editorial areas), thus
allowing to identify and examine the most efficient
communication strategies, which are enabling high
performing agents to be successful in social media.
3 CASE STUDY
The present case study was conducted on the
Portuguese Higher Public Polytechnic Education
Sector (HPPES), using the previously presented
methodology.
A total of 137 agents were considered, which
included polytechnic schools integrated into
polytechnic institutes and polytechnic schools
integrated into universities. The number of agents
was then reduced to 94 in order to include only the
schools providing educational services, disregarding
the polytechnic institutes and universities (managing
entities).
During the data collection phase we measured
the HPPEI’s social media networks adoption rates,
in order to include the most relevant communication
channels (social media), and only those that had
been in use at least since the 1st of September 2013,
with the intent of extending the analysis to a full
school year (up to September 2014). In order to
support the research in reliable sources, the study
considered only the social media websites
mentioned on the HPPEI’s official websites. This
method aimed to ensure that the social media
websites under analysis were actually managed by
the HPPEI, instead of other internal or external
stakeholders, such as students, employees
(administrative or faculty) or alumni on their own.
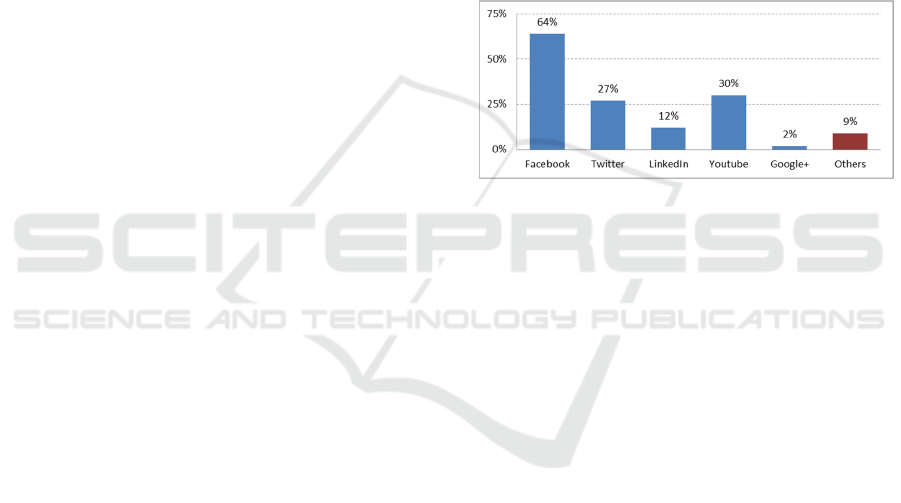
According to these criteria, 43 agents were included
in the study. Facebook proved to be the most
representative social media website, with an
adoption rate of 64% among all agents, as illustrated
in figure 1.
Figure 1: Social media adoption rate by agents.
In this article we focus our analysis only on
Facebook, once it is the most relevant network in the
sector and results adequate enough to provide
evidence on the implementation of the proposed
methodology.
3.1 Retrieval of Facebook Posts
The following stages consisted of retrieving and
classifying all messages posted by HPPEI on
Facebook. We used two methods: an in-house made
system, specially built for the purpose using the
available Facebook API and a third-party software
for collecting information from Social Networks.
From an initial list of the relevant agent Page Id’s,
the two systems accessed the posts retrieving the
following fields:
List 1: Fields collected from Facebook posts.
1) PostId
2) Message
3) Link
4) Name
5) Description
6) Caption
7) #Likes
8) #Comments
9) #Shares
WEBIST 2016 - 12th International Conference on Web Information Systems and Technologies
190

The two systems retrieved the same number of
posts (15.444), during the entire school year, which
consolidated our confidence about the validity of the
returning set.
3.2 Editorial Model for the HPPES
As previously mentioned, if the identification of the
editorial areas for a specific agent/market is not yet
set, is incomplete or is only implicit, a small sample
of social media messages should be ran through a
communication professional, so an efficient and
comprehensive editorial model can be built.
Specifically concerning the HPPES, some editorial
areas are straight forward and some were added after a
manual classification of a small sample of messages.
In any case, the previously identified guiding
principles for the design of a social media editorial
model where applied and tuned to the HPPES and we
considered the following: (a) the heavy HEI’s mission
towards society and the great diversity of
organizational stakeholders (students, faculty, staff,
employers, partners, research centres, etc.); (b) the
specifics of the educational service (a co-produced
service); (c) a multi-channel wide holistic approach to
communication management; (d) the need to balance
between organizations’ institutional and transactional
needs in order to ensure their competiveness and
financial survival; and (e) the dialogical nature that is
intrinsically linked to social media environments.
The editorial model designed for this specific
case includes the seven main editorial areas that we
believe to have the highest impact on organizational
performance:
Education: messages are aimed at promoting or
providing information about the educational offer,
mainly higher education courses, but also include
complementary internal or external training;
Research: messages are aimed at promoting internal
research results, mainly obtained by faculty
members as inputs to the organization’s areas of
expertise, but also include research results from
other sources with impacts on those same areas.
Also includes information and call for participation
on congresses, seminars and other scientific
meetings held internally or externally;
Society: this category builds upon the, so called,
“third mission” of HEI, which is aimed at engaging
with industry and other cultural and social groups,
encompassing exchanges with society at large.
Messages in this category include the promotion of
and/or information on: knowledge and technology
transfer, patents, organizational partnerships and
contracts, demonstrations, exhibitions and
showcases conducted by faculty members or
students, and also messages promoting
employability through streaming placement offers
and career opportunities;
Identity/Brand: mainly aimed at the construction,
development and maintenance of the organizational
image and reputation, fostering distinctiveness and
the development of a corporate persona. Messages
consists mainly on promoting and/or informing
about the corporate persona character and include
references to CSR initiatives, institutional events
(such as celebrations, awards, tributes and
graduation ceremonies), students, faculty and staff
honorable mentions and representation activities in
external fairs and exhibitions;
Administration: is aimed at partially extending the
internal administrative communication with internal
publics into social media, but also attending
administrative needs towards external stakeholders.
It informs about deadlines and administrative
processes, procedures and admissions, but it also
promotes and informs on organizational support
services (goals, contacts, working hours, etc.);
Relationship: this category builds upon the
previously mentioned dialogical nature that is
intrinsically linked to social media environments and
aims to foster conversation, boost emotional
connection the organization and its stakeholders,
requiring opinions, introducing current internal,
external, societal or academic issues with which
publics can relate to. Messages in this category tend
to present lower levels of formality in order to
propel interactions and may introduce greetings,
humor, sympathy and motivation.
Information: messages in this category are aimed at
enhancing HEI’s role in fostering citizenship, mainly
among students, thus streaming external social,
economic, political and cultural relevant information,
news, regulations and events that may or may not be
close to the schools adjoining scientific areas.
3.3 Automatic Categorization
Our next step was to perform the classification of the
15444 posts according to our editorial model, listed in
the previous section. This is a time demanding task to
be done by hand and impossible to be undertaken on
the-fly if done exclusively by humans. Therefore, we
propose an automatic method to categorize the posts
based on the conjunction of several of the most recent
and promising algorithms for text classification or
categorization.
Although several text classifiers have been
proposed over the last decades, nowadays this
Analyzing Social Media Discourse - An Approach using Semi-supervised Learning
191
research topic is again gaining a lot of interest from
the research community. The main reason is that
much research is being focused on social networks
due to the abundance of interesting data to work
with. In particular, texts posted in social networks
have special properties that haven’t been considered
in previous research and in the devised algorithms
(e.g. very short texts, abundance of smileys,
inclusion of links, many punctuation signs). These
special characteristics pose new problems and make
text classification, again, a very difficult task, and
prone to failure. Nevertheless, research has been
incorporating these new features and consistently
creating better classification models, especially for
classification under supervised training.
For this step we decided to use six of the most
promising, and prominent, classifiers:
Support Vector Machines. Linear SVMs are a
machine learning algorithm (Cortes, 1995) based on
a geometric method that tries to separate two classes
through an hyperplane, picking the one that
maximizes the margin between the two classes.
More recently, this method was evolved (Crammer,
2002) to deal with a multiple number of classes. We
used the Multi-class SVM lib for this analysis.
Random Forests. RFs were created (Breiman,
2001) to overcome the overfitting effect of the
decision trees. Within this method multiple decision
trees are created during training time, and the mode
of the resulting class is the presented output.
LogiBoost (Friedman, 2000). This algorithm
belongs to a larger category of boosting algorithms
which comprehend AdaBoost, LPBoost and some
others, all based on a common framework called
AnyBoost (Mason, 2000). Generically, the boosting
algorithms try to reduce variance and pre-training
effects in supervised learning by re-weighting a set
of classifiers according to the rule: weak classifiers
should gain weight and strong classifiers should lose
weight. The LogiBoost is implemented in several
regression and classification packages. We used the
one implemented in “caTools” for R.
K-Nearest Neighbours (Altman, 1992). Although
being one of the simplest, machine learning
algorithm, it is still very useful because of it wide
range of applicability. The algorithm relies on the
previous classification of the neighbors to each
training data, classifying according to the majority
up to the defined k elements. The training data is
presented in a vector space model and all trained
examples are vectors in that multidimensional space.
MultiLayer Perceptrons. The “perceptron” is an
algorithm, in Machine Learning theory, that is able
to classify an input vector using a linear prediction
function, which combines a set of computed weights
to the vector parameters (Freund, 1999). When it is
needed to solve non-linear problems we need more
than a layer of perceptrons. Typically, multi-layer
perceptrons (MLP), use sigmoide function as an
activation function.
Deep Neural Networks. This type of algorithms
(Collobert, 2008) are based on the concept of pre-
training a multi-layered feedforward neural network,
one layer at a time, treating each layer as an
unsupervised restricted Boltzmann machine, and
then using supervised backpropagation for fine-
tuning the neural net.
Deep learning algorithms are based on an
underlying assumption that observed data is generated
by the interactions of a multitude of different factors
on different levels. Deep learning assumes that these
factors can be organized into multiple different levels
of abstraction. Therefore, varying the number of
layers and of layer sizes can provide the needed
amounts of abstraction (Bengio, 2013).
All the algorithms were used through public and
open source libraries (“caret” and “h2o”), available
for the R programming language.
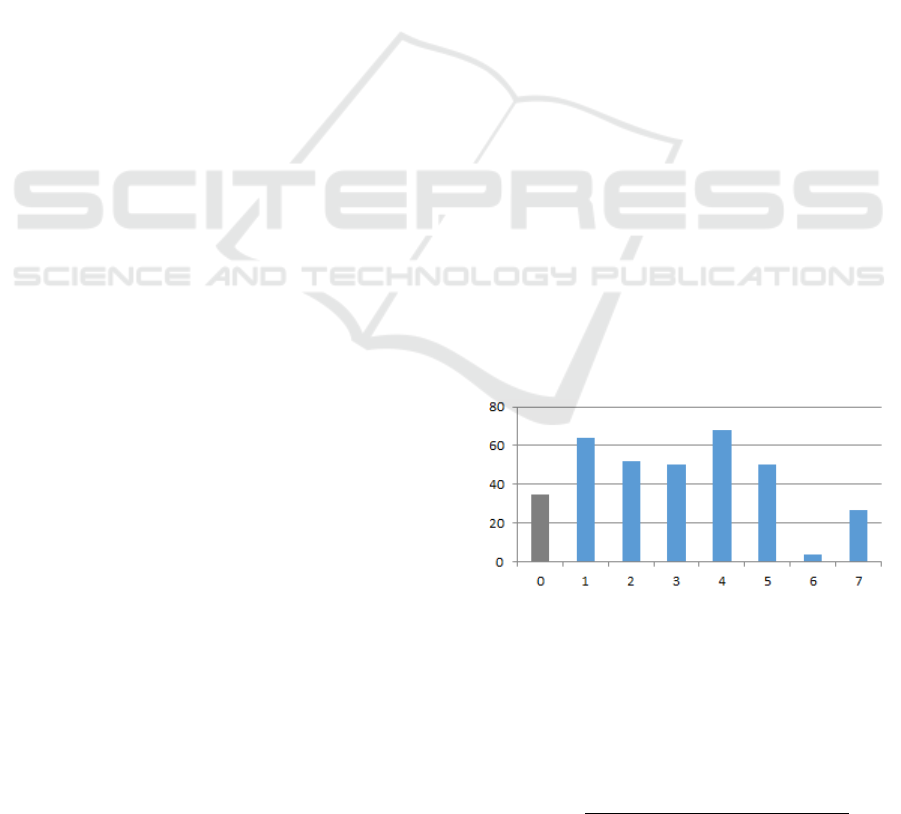
3.3.1 Training Phase
First, we trained manually 350 posts according to the
derived model. As in the sample set there were blank
posts (with no text message) we considered those to
be included in a special category which we labeled
as 0 (zero). The manual classification produced a
total coverage of the 7 + 1 categories, but not
equally balanced, as illustrated in Figure 2.
Figure 2: Label count for the 350 posts.
We then computed the respective accuracy of the
automatic classification. For this we used a
confusion matrix to report the number of false
positives, false negatives, true positives, and true
negatives. We used a standard formula (1) for
computing the accuracy.
=
∑
+
∑
(1)
WEBIST 2016 - 12th International Conference on Web Information Systems and Technologies
192
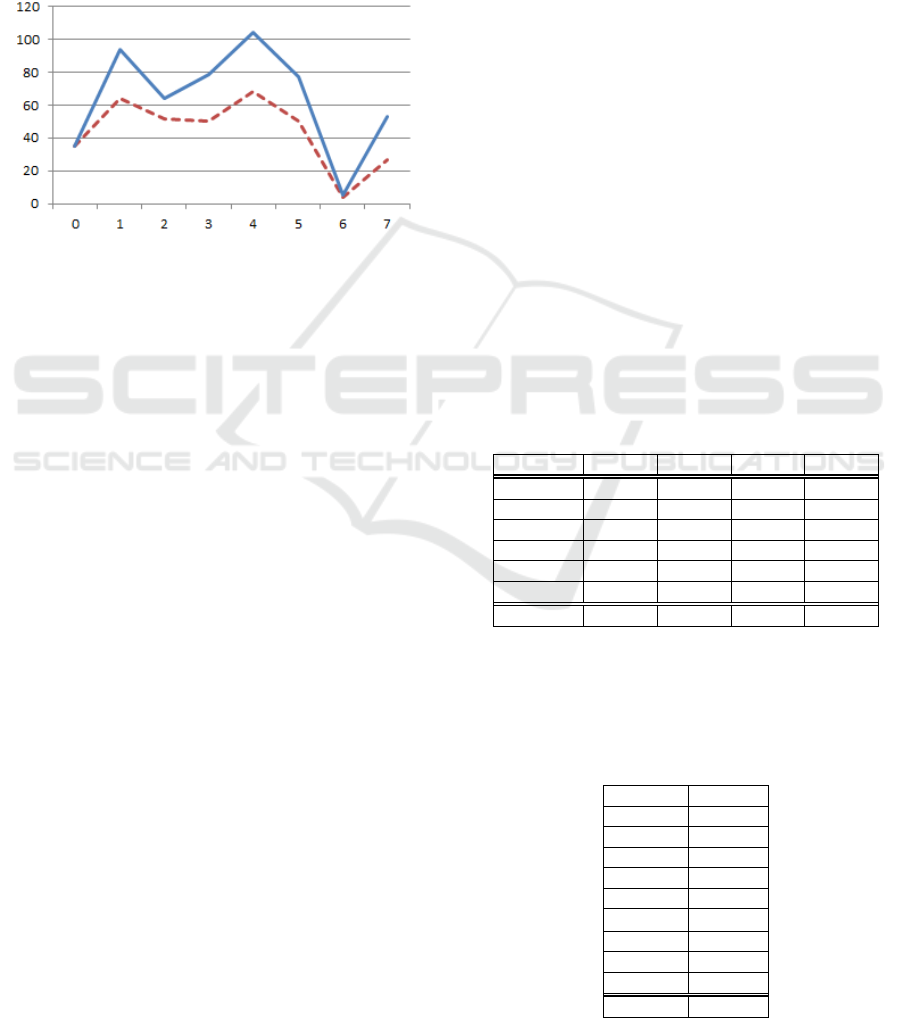
As a second step, we gave the classifiers a bigger
set of 512 manually classified posts for retraining, and
recomputed the new accuracy. The new set, similarly to
the first one, has a full coverage of the seven categories
plus one, for blank posts, labelled as zero. We illustrate
in Figure 3 the comparison of the two classifications: of
the 350 and of the 512 posts, according to the number
of labels. In Figure 3 the categorization of the 350 posts
is represented by a dashed line and the 512 posts by a
solid line. Categories are distributed along the x axis.
Figure 3: Label count for the 350 and the 512 posts.
It is easy to see that category 6 is still
problematic due to its reduced number of posts.
Apart from that consideration, we may also observe
a tendency for a proportional increase in the number
of posts in the remaining categories, when
expanding the analysis from 350 to 512 posts.
We then computed the accuracy for the new set.
Every method had an accuracy increase, but the total
average for this metric, in the new training, was an
improvement of only 3%, over the 6 techniques.
Therefore, we didn’t feel in the need to classify
more posts manually.
On the other hand the absolute value for the
accuracy was still low (circa 55%).
Maintaining our view to classify the posts relying
only of the post itself and on the features associated
with each post, we augmented List 1 presenting more
information to the classifiers (information that was
already retrieved during post collection, but not used):
List 2: Extra fields collected from Facebook posts.
10) From
11) Date
12) Hour
13) Type
14) Status type
15) Link
16) Name
17) Story
Therefore, we had now 17 fields, possibly some
of them with no values.
We tried various approaches to use all the text in
the fields to help the classifiers, and combinations of
several texts. For examples, we tried:
1) Message or Description
2) Message, Name, Description, Caption and Story
3) Message, Name Description, Caption, Story and
link domain
4) All the 17 fields described in List 1 and 2, and
using a “link explosion” strategy.
We mean by “link explosion” the separation of
each term in an URL that is joined to another term by a
slash, by punctuation signs, or by the protocol’s name.
3.3.2 Classification
We then executed again the trained algorithms on
the 512 sample data using all the approaches. We
computed the accuracy, and found find out that
approach 4 delivers the best result.
In Table 1 we can see that there is a 3%
improvement from expanding the training set to 512
samples, and that, using all the 17 fields as text
features, results in a significantly better accuracy.
To assess the stability of the method we
performed a 10-fold cross validation, with the input
data averagely distributed, throughout the whole
sample (the 512 posts) and then we computed the
respective accuracy (using formula 1) in each pass,
for the whole ensemble of classifying algorithms.
Table 1: Accuracy during the training phase.
A
ccurac
y
350 512 Dif
f
512-all
SVM 0.3264 0.3553 0.0289 0.4523
RF 0.5347 0.5866 0.0519 0.6862
LB 0.6044 0.6507 0.0463 0.7243
KNN 0.4722 0.4803 0.0081 0.5451
MLP 0.5844 0.606 0.0216 0.7703
H2ODL 0.5781 0.6031 0.025 0.6527
A
verage 0.5167 0.547 0.0303 0.63848
The above table represents just the first run of
the training. We list below, in Table 2, the results of
the 10-fold cross validation.
Table 2: Accuracy of the aggregation for the six
algorithms in each of the 10 runs.
1 0.63848
2 0.71432
3 0.75420
4 0.65130
5 0.70034
6 0.65470
7 0.65382
8 0.72943
9 0.73342
10 0.62832
A
verage 0.68583
Analyzing Social Media Discourse - An Approach using Semi-supervised Learning
193
We ended up with an average accuracy above
68%, which seemed a fair base for classifying the
whole set of posts.
We then run the whole set of 15444 posts on our 6
trained classifiers to obtain a predicted category for
each post, by each technique. Finally, we used the
prevailing category of these six techniques as the final
result, i.e., we used the prevailing category of the six-
set as the final predictive category. When there was
no mode, the post was labelled with a zero. The
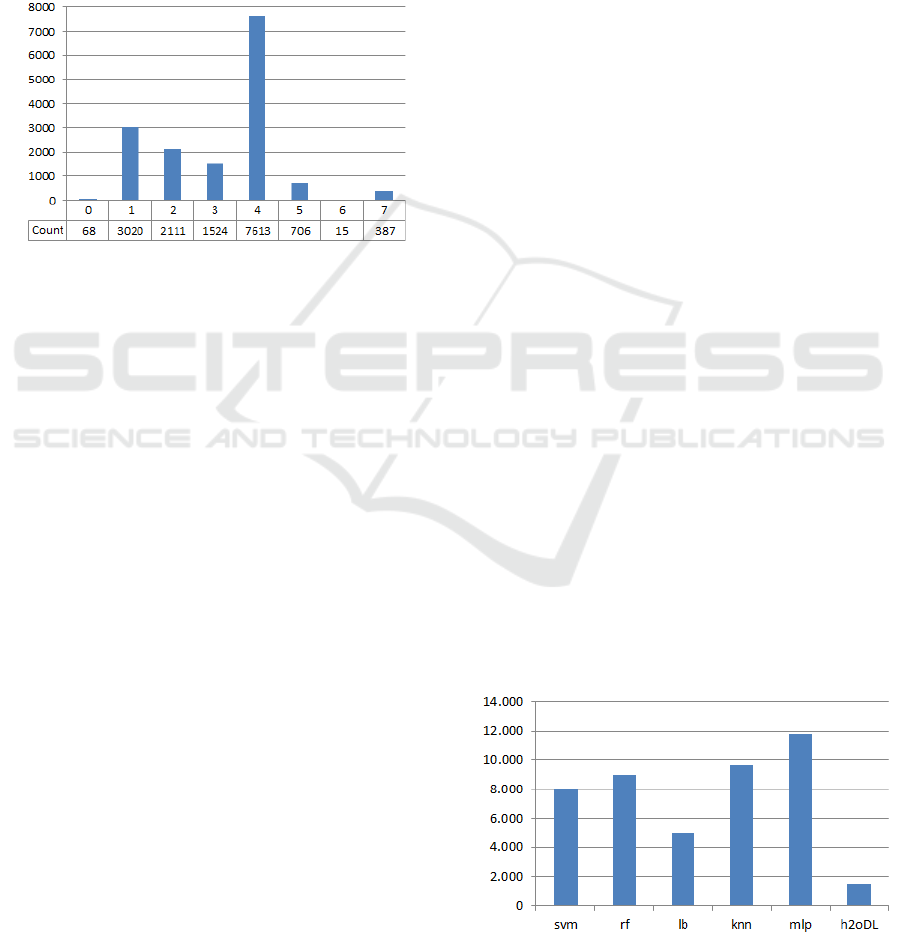
number of posts per category is illustrated in Figure 4.
Figure 4: Final label count for the 15444 posts.
As we can see category 6 remained with very
few posts (15) and less than 1% were unclassified
posts (labelled as zero). Apart from Logiboost, every
classifier could reach some category for every post.
Logiboost failed to categorize 5055 posts (about 1/3
of the total of posts). All in all, 15376 posts (i.e.,
more than 99%) were successfully given some label.
3.3.3 Strategic Benchmarking for Business
Intelligence
Having the posts categorized in each of the seven
categories defined in our model allows us to build a
statistics model and parameters to assess the effort
and gain with each message. For instance, we can
compare the number of posts in each category for
every competitor and its return in the form of Likes,
Shares and Comments (eventually with different
weights). In a previous study (Oliveira and Figueira,
2015) it was shown that some competitors have
centralized strategies whilst others have
decentralized or hybrid strategies, according to the
amount of effort per editorial area. Such research
outputs and methodology are typically framed in
strategic benchmarking processes that rely heavily
on business intelligence skills. In fact, the ability to
handle large amounts of unstructured data, to help
identify and develop new strategic business
opportunities and the identification of fundamental
lessons among competitors are essential to the
formation of well sustained medium / long term
decision making processes.
3.3.4 Discussion and Notes
The “link explosion” strategy increased the accuracy
of the classifiers around 2%. The use of all collected
features associated with each post leveraged the
accuracy in about 7%. All the text was concatenated
and transformed into a confusion matrix of posts and
terms. The TF and TF-IDF metrics were used to try
to discover relevant words to the classification. This
procedure resulted in a slightly better results for TF
but not relevant, as neither were conclusive about its
discriminatory power.
Before the training phase the more sparse
features derived from the message of each post were
removed, in order to obtain a maximum of 0.999 of
sparsity. A 0.99 of sparsity was allowed for features
derived from the link explosion.
Curiously, LogiBoost had the best accuracy for the
512 trained set, despite not being able to classify all the
posts. The Multi-Layer Perceptron, was the second best
during training, and became first when all features were
used. Moreover, this algorithm was capable of
classifying all the posts. The accuracy assessment used
a 10-fold cross validation, implemented through the
“caret” library. Whenever a classifier was trained using
the caret library, a cross validation was used and, for
each of the 10-fold was computed the accuracy and the
kappa index. When we used the “h2o” library the
accuracy was computed using a manually built, but
standard, implementation of the metric.
In order to improve the categorization, we tried
the selection of disjoint sets of words of features for
every class, ie, words that are used in just one
category. We also tested the removal of sparse
features which had high correlation and the removal
of features with high variance. All in all, the
improvement was quite small which probably is due
to the fact that most of the algorithms are based on
Figure 5: Correct assigned labels per algorithm according
to the final label produced by the ensemble of classifiers.
WEBIST 2016 - 12th International Conference on Web Information Systems and Technologies
194

trees, which already do select relevant features during
training. Finally, we must stress that the Multi-Layer
Perceptron was the algorithm that more often categorized
the posts as the majority of the ensemble of classifiers did
(cf. Figure 2).
4 CONCLUSIONS
In this article we presented a model for analysing
social media discourse by categorizing the messages
posted in social networks according to a n-category
model, created during analysis. Posts from an entire
year are collected and a small amount is used to
build the editorial model. Another sample was used
for training. In our case study, the accuracy did not
increase the classifying procedure with a sample
bigger than 3% of the total data. In the case study we
used six of the most well-known algorithms to
perform the categorization. We showed how to
improve their classifying accuracy by using the
features associated with each post, and how to fine
tune the categorization parameters. The resulting
accuracy of the method was increased from 51% up
to 68%. After the ensemble of algorithms were
trained the whole sample was ran through it.
ACKNOWLEDGMENTS
This work is supported by the ERDF – European
Regional Development Fund through the
COMPETE Programme (operational programme for
competitiveness) and by National Funds through the
FCT (Portuguese Foundation for Science and
Technology) within project «Reminds/ UTAP-
ICDT/EEI-CTP/0022/2014.
REFERENCES
Altman, N. S. (1992). "An introduction to kernel and
nearest-neighbor nonparametric regression". The
American Statistician 46 (3): 175–185.
Bengio, Y.; Courville, A.; Vincent, P. (2013).
"Representation Learning: A Review and New
Perspectives". IEEE Transactions on Pattern Analysis
and Machine Intelligence 35 (8): 1798–1828.
Breiman, Leo (2001). "Random Forests". Machine
Learning 45 (1): 5–32.
Cortes, C.; Vapnik, V. (1995). "Support-vector networks".
Machine Learning 20 (3): 273.
Freund, Y.; Schapire, R. E. (1999). "Large margin
classification using the perceptron algorithm" (PDF).
Machine Learning 37 (3): 277–296.
Friedman, J., Hastie, T., and Tibshirani, R. (2000).
Additive logistic regression: a statistical view of
boosting. Annals of Statistics 28(2): 337–407.
Koby Crammer and Yoram Singer. 2002. On the
algorithmic implementation of multiclass kernel-based
vector machines. J. Mach. Learn. Res. 2 (March
2002), 265-292.
Llew Mason, Jonathan Baxter, Peter Bartlett, and Marcus
Frean (2000); Boosting Algorithms as Gradient
Descent, in S. A. Solla, T. K. Leen, and K.-R. Muller,
editors, Advances in Neural Information Processing
Systems 12, pp. 512-518, MIT Press.
Oliveira, L., Figueira, A. (2015). Benchmarking analysis
of social media strategies in the Higher Education
Sector. In Proceedings of Conference on ENTERprise
Information Systems (CENTERIS’16). Vol64:779-
786.
Ronan Collobert and Jason Weston. (2008). A unified
architecture for natural language processing: deep
neural networks with multitask learning. In
Proceedings of the 25th international conference on
Machine learning (ICML '08). ACM, New York, NY,
USA, 160-167.
Rud, Olivia (2009). Business Intelligence Success Factors:
Tools for Aligning Your Business in the Global
Economy. Hoboken, N.J: Wiley & Sons. ISBN 978-0-
470-39240-9.
Analyzing Social Media Discourse - An Approach using Semi-supervised Learning
195
