
Human Detection from Aerial Imagery for Automatic Counting of
Shellfish Gatherers
Mathieu Laroze, Luc Courtrai and Sébastien Lefèvre
Univ. Bretagne-Sud, UMR 6074 IRISA, F-56000, Vannes, France
Keywords:
Human Detection, Image Stitching, Aerial Imagery, Image Mosaicing, Patch Classification, Object Detection.
Abstract:
Automatic human identification from aerial image time series or video sequences is a challenging issue. We
propose here a complete processing chain that operates in the context of recreational shellfish gatherers count-
ing in a coastal environment (the Gulf of Morbihan, South Brittany, France). It starts from a series of aerial
photographs and builds a mosaic in order to prevent multiple occurrences of the same objects on the overlap-
ping parts of aerial images. To do so, several stitching techniques are reviewed and discussed in the context of
large aerial scenes. Then people detection is addressed through a sliding window analysis combining the HOG
descriptor and a supervised classifier. Several classification methods are compared, including SVM, Random
Forests, and AdaBoost. Experimental results show the interest of the proposed approach, and provides direc-
tions for future research.
1 INTRODUCTION
Nowadays, image sensors are widely available and
offer continuously improving performances. In this
context, biologists, ecologists and other scientists in-
terested in environmental studies are encouraged to
extract study parameters from digital images. The
Natural Park of Morbihan (South Brittany, France)
has thus started to rely on analysis of aerial images
to determine the frequentation of foreshore by recre-
ational shellfish gatherers. Understanding their activ-
ity is of first importance for environmental studies,
and periods of high tides can see up to 5,000 people
collecting shellfish in the same area. While aerial im-
ages allows analyzing large or dense areas, the man-
ual effort it requires (visual analysis of hundreds of
images) calls for some significant gain in automation.
In this paper, we address this issue and propose
the first (up to our knowledge) method to automati-
cally identify and count shellfish gatherer from aerial
images. We rely on machine learning techniques that
provide a natural framework to adapt the human de-
tection to the data under consideration. However, we
consider here color images without ancillary informa-
tion (and taken from an airplane), leading to a chal-
lenging human detection problem.
The processing of aerial images follows the
pipeline given in Fig. 1: image stitching, patch de-
composition with a multiscale sliding window, patch
feature extraction, labeling using a pretrained classi-
fier, grouping of neighboring positive windows (due
to overlapping or multiscale analysis) in order to pro-
ceed to final counting.
2 IMAGE STITCHING
2.1 Mosaic of Aerial Images
Aerial shooting is set up in such a way that all shell-
fish gatherers are visible in the images. This results in
partial overlapping between successive images, and
thus the presence of multiple occurrences of a unique
human in different images. Such doubles have to be
tackled appropriately to avoid overestimation in the
counting process. To do so, the first step of the pro-
cess is to build a single mosaic from a series of aerial
images. Each object will thus be present in a single
mosaic from the scene (no double), that will be used
as input for the detection step.
Each scene of interest corresponds to a series of
images acquired from a plane. Nevertheless, this se-
ries is not continuous, since some areas of the scene
might be of low interest (e.g., with no visible people)
and will not be photographed. It is thus not possible
to build a single mosaic, but rather a collection of suc-
cessive mosaics. Each of them will represent a given
geographical entity (e.g., beach, rocky coast, sea, etc).
664
Laroze, M., Courtrai, L. and Lefèvre, S.
Human Detection from Aerial Imagery for Automatic Counting of Shellfish Gatherers.
DOI: 10.5220/0005786506640671
In Proceedings of the 11th Joint Conference on Computer Vision, Imaging and Computer Graphics Theory and Applications (VISIGRAPP 2016) - Volume 4: VISAPP, pages 664-671
ISBN: 978-989-758-175-5
Copyright
c
2016 by SCITEPRESS – Science and Technology Publications, Lda. All rights reserved
Stitching
HOG
description
Patch
classification
Overlapping
detection
fusion
Overlapping
aerial images
Sliding
window
Location
and count of
detected
shellfish
gatherers
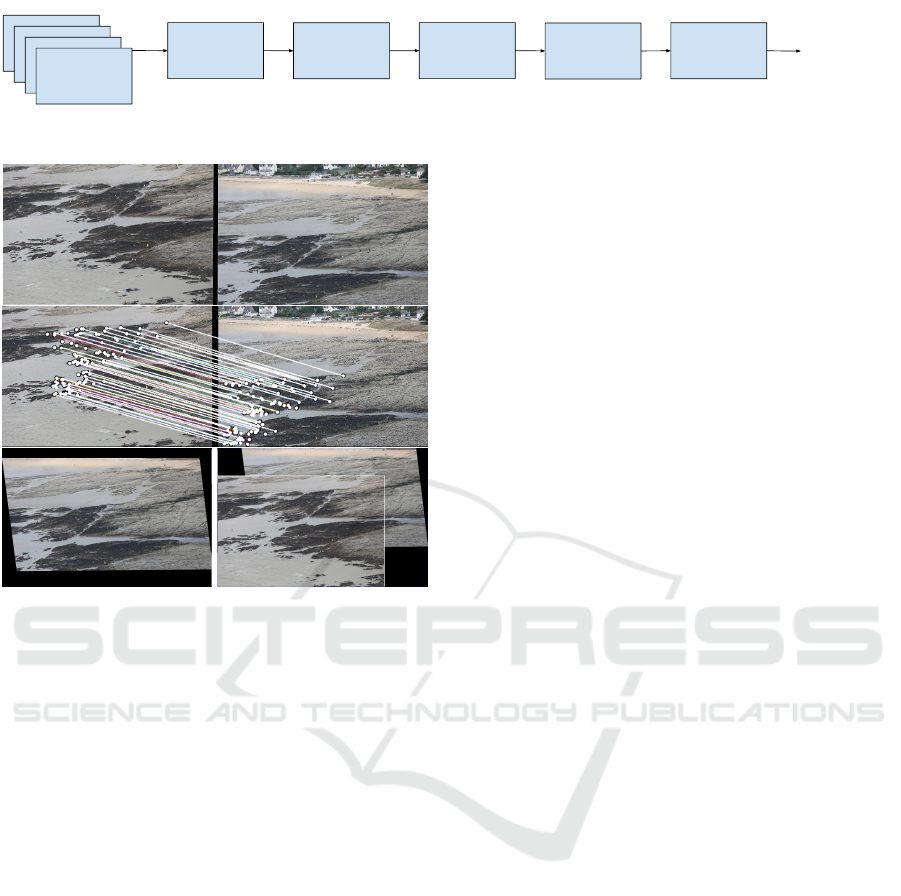
Figure 1: Processing pipeline.
Figure 2: Illustration of the image stitching process: (top)
original images, (middle) matching of interest regions, (bot-
tom left) deformation, and (bottom right) final stitching.
As already indicated, we consider here images
taken from a airplane. They are already ordered and
the series constitute a global panorama (in the rec-
tilinear sense). These assumptions will ease the as-
sembling process. However, a major challenge w.r.t.
state-of-the-art is the fact that aerial photos show ma-
jor deformation due to the acquisition condition (the
view is oblique and not top-down).
When only two images are considered, the stitch-
ing algorithm performs as follows. First some inter-
est regions are extracted from the images with SURF
and SIFT method. Once such regions have been ex-
tracted, a matching step aims to associate pairs of re-
gions appearing in the couple of images (hopefully
representing two successive occurrences of the same
region). Euclidean distance is computed between the
two region descriptions, and only associations with
low distance are kept. Thus pairs containing two dif-
ferent objects but with similar visual appearance will
be discarded. Let us note that those pairs would have
resulted in an incorrect stitching. If the number of
remaining associations is large enough, it is possible
to build the resulting image. To do so, a geometric
deformation (warping) is applied on either one or the
two images to be able to stitch them. Assuming one of
the images is close to a plane projection onto another
plane (the second image), an homography matrix is
built based on the association distances that have been
previously computed. The first image is then copied
in a frame, before the second one is inserted by ap-
plying homography and dealing with the overlapping
area between the two images.
Before proceeding with the final stitching, a col-
orimetric rectification has to be achieved on the im-
ages to ensure their colors and exposures will lead
to a visually consistent stitching. Figure 2 shows an
example of image stitching from two successive im-
ages from an aerial sequence. Stitching experiments
have been conducted using two different algorithms
respectively relying in the BoofCV and OpenCV API.
2.2 Image Stitching with BoofCV
The BoofCV API (Abeles, 2012) is designed for ob-
ject tracking and image/video stitching. It provides
classes implementing SURF and SIFT for detection of
interest regions, functions measure distances among
these regions. Some tools allowing using the ho-
mography matrices and their application on images
are callable from the library. Stitching of two im-
ages, once the deformations have been performed, is
achieved through a simple overlapping.
In order to extend from 2 to 3 or even N images,
the stitching of the i
th
image on the previous mosaic
is more challenging. Indeed, each new image requires
to be deformed before being stitched with the mosaic
that is also resulting on previous deformations. Defor-
mations are thus accumulated among time, and new
images might show a very strong deformation effect
preventing an appropriate stitching or even matching
of interest regions. We tackle this issue by proposing
a hierarchical strategy to build the mosaic. Initial im-
ages are stitched two by two. The mosaics containing
only two images are then again stitched two by two.
This iterative process is repeated until the final mosaic
is built. Besides, memory cost can be lowered through
a bottom-up depth-first strategy that only requires to
store at most two images per level (let us recall that
the scene may contain hundreds of high-res images,
making a brute force approach untractable).
Figure 11 shows a mosaic built using BoofCV
with the proposed multiscale strategy, where white
frames highlight initial overlapping areas and the size
of the frames indicates the scale level (middle). While
Human Detection from Aerial Imagery for Automatic Counting of Shellfish Gatherers
665

the process here has been described for image se-
quences, the method is also able to process raw video
data. In this case only one image per second is consid-
ered (so one every 25 for standard video framerate).
The proposed strategy leads to a significant reduc-
tion of deformation accumulation among time, and al-
lows for assembling a large number of images. But
some deformation problems remain, that are related
to the limited functionalities of the BoofCV API and
the use of a simple homography matrix. We have thus
considered OpenCV as a possible alternative solution.
2.3 Image Stitching with OpenCV
The OpenCV API (Bradski, 2000; Itseez, 2015) of-
fers more stitching options. It is thus possible to di-
rectly build a mosaic from several images (i.e., more
than two). Besides, a wider range of warpers (plane,
cylindrical, spherical, fisheye, stereographic, etc.) are
available. The homography matrix is then replaced
by a transformation function that is specific to each
warper. If several images are processed, deformations
are computed on all the images, thus limiting the cas-
caded deformations of an overlapped image part.
Figure 11 (bottom) shows that performing image
stitching with OpenCV provides correct results when
assembling aerial images. However, some assembling
problems remain (see Fig. 3).
Figure 3: From left to right, a zoom on two images to be
stitched, and the assembling error with double occurrences
of humans (highlighted with white frames).
3 SHELLFISH GATHERER
DETECTION
3.1 Human Detection
3.1.1 Related Work
Human detection is a widely addressed computer vi-
sion problem, often associated to video monitoring
or pedestrian detection. Detecting human gathering
shellfish, share many similarities with the well-known
and widely addressed problem of pedestrian detec-
tion. However some differences remain, that make
the fishermen detection a challenging issue for which
there is no available solution yet (to the best of our
knowledge). Among the most important ones are the
wide range of body positions that can be observed
among the fishermen during their activity, as well as
the unconstrained acquisition conditions (photo man-
ually taken from an airplane). Nevertheless, we will
rely here on a standard object detection scheme comb-
ing image description with machine learning.
A lot of works have been achieved on pedestrian
detection or more generally object detection. Proba-
bly the most popular solution is the face detector in-
troduced by Viola and Jones (Viola and Jones, 2001),
that combines Haar wavelet features with Adaboost
classifier. As described in several survey papers in
pedestrian detection (Dollár et al., 2009; Benenson
et al., 2014), improving the detection rate requires to
improve both feature detection and machine learning
algorithms. The HOG descriptor (Dalal and Triggs,
2005) has been one of the major advances on the fea-
ture description side for human detection. It has been
implemented in the OpenCV API with a linear SVM
classifier, and is a main feature used in many detec-
tors. When available, the detection can benefit from
complementary description sources, e.g., related to
motion or stereo-vision information.
While many approaches have been introduced to
solve the pedestrian detection problem, only few pa-
pers tackled it from aerial images. These two prob-
lems show significant differences, especially since the
pedestrian detection is often achieved through near-
horizontal cameras, while aerial detection rather con-
sider either vertical (top-down) or oblique images.
This prevents from straightforward transfer of the rich
state-of-the-art in pedestrian detection methods. Nev-
ertheless, a few works on human detection from aerial
imagery have been published. For instance, a shadow
detector is presented in (Reilly et al., 2010) but its
application is limited by the weather conditions (it re-
quires sun illumination, and imposes constraints on
the camera viewpoint). A part-based model for victim
detection from UAV is described in (Andriluka et al.,
2010). Finally, the human detection from a UAV view
is explored in (Blondel and Potelle, 2014), where the
optimal acquisition angle to improve detection from
aerial images is discussed. The authors also introduce
an adaptation of HOG parameters to human detection
and a saliency map to increase the detection speed.
The focus is mainly on real time detection and there
is no quantitative evaluation of the detection accuracy.
3.1.2 The Case of Shellfish Gatherers
We perform here human detection on each single
aerial image or mosaic and thus we do not rely on
any motion information. In this context, detection of
shellfish gatherers is a challenging problem (see Fig. 4
VISAPP 2016 - International Conference on Computer Vision Theory and Applications
666
first line). More precisely, several reasons have been
identified as sources of problem complexity.
Viewpoint Variation. The plane altitude is not con-
stant. Images acquired from the airplane are thus
showing various distances from the ground. With the
perspective effect, average human size is decreasing.
Deformation. Shellfish gathering activity leads to a
wide range of possible positions of the human body
(i.e., much larger than with pedestrian detection), as
well as a wide variety of outfits.
Illumination Change. Depending on the plane ori-
entation or time of the flight, the illumination of
the scene may vary, leading to significant lumi-
nance/color changes in the observed images.
Background Change. We are dealing with outdoor
scenes that show various backgrounds; besides, the
background may be cluttered
Occlusion. For large groups of people, occlusion
phenomena are a very recurrent problem.
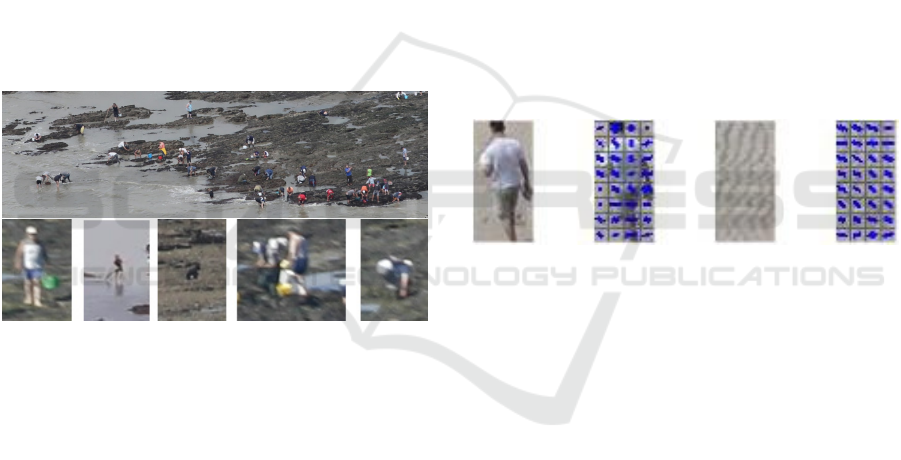
Figure 4 (bottom) provides some visual illustra-
tions of the detection problem complexity.
Figure 4: Illustration of the complexity intrinsic to detec-
tion of shellfish gatherers from aerial imagery: (top) sample
scene and (bottom) complexity sources (occlusion, back-
ground change, and variety of human positions and outfits).
3.2 Selection of Description and
Classification Schemes
As shown in Fig. 1, our method rely on descrip-
tion and classification techniques to perform detection
(and subsequent counting) of shellfish gatherers. We
provide here some necessary background on the se-
lected description and classification methods.
3.2.1 Description
Inspired from numerous works in pedestrian detec-
tion, we rely here on the HOG descriptor (Dalal and
Triggs, 2005) to perform human detection. This pow-
erful and robust (e.g. to illumination change) shape
detector consists in only the few following steps.
Normalisation and Gamma Correction. A first step
consists in image equalization in order to reduce the
influence of illumination changes and shadows.
Gradient Computing. A first order gradient is com-
puted to describe orientation and magnitude of the
edges contained in the image.
Ponderation. The image is divided into adjacent
cells. For each of them, the distribution of gradient
orientations is stored in a histogram with 9 orienta-
tion bins weighted by their magnitude. It allows to
identify edge in a cluttered background.
Cell Normalization. Adjacent cells are gathered into
blocks that are further normalized to increase robust-
ness to illumination. Each cell is then shared among
several blocks relying on different local normalization
settings. These blocks compose the HOG descriptor.
Following (Blondel and Potelle, 2014), we use
here a smaller detection window than the one intro-
duced in (Dalal and Triggs, 2005) to improve the de-
tector performance. Our detector is computed on a
window of 32 × 64 pixels, with a cell size of 8 × 8
pixels and block size of 2 × 2 cells. Figure 5 illus-
trates the cells of both human and background.
Figure 5: Illustration of HOG (cells with gradient his-
togram) for positive (left) and negative (right) samples.
3.2.2 Classifiers
While for the description step, we have considered
here a single method (i.e., HOG) that appear as the
most common choice in the literature, the classifica-
tion step is addressed through several methods: Sup-
port Vector Machines, AdaBoost, and Random For-
est. All are supervised classifiers and we briefly recall
them in the following paragraphs.
Support Vector Machine. Support Vector Machines
(SVM) are very popular tools for supervised learning.
It assumes that it is possible to map the data into a
higher dimensional space where two classes will be
separated through an hyperplane. Learning the hyper-
plane relies on the training samples and the margin
between the hyperplane and the labelled samples is
being maximized to lower classification errors. Fur-
thermore, SVM popularity has been strengthen with
the use of kernels, easing the separability of the orig-
inal data in a higher dimensional space. We use here
two standard kernels (Gaussian and linear).
AdaBoost. The AdaBoost classifier has popularized
the principle of boosting (Freund and Schapire, 1997).
Human Detection from Aerial Imagery for Automatic Counting of Shellfish Gatherers
667
This technique consists in combining several basic
classifiers (called weak classifiers) to build a robust
decision function rather than to try to design a very
powerful yet complex classifier (also called strong
classifier). The AdaBoost technique has been in-
volved in the widely used object detection scheme in-
troduced by Viola and Jones (Viola and Jones, 2001).
Each weak classifier operates on a single feature or
attribute, and its contribution w.r.t. the overall clas-
sification depends on some weighting parameters.
Optimal weights are computed through an iterative
scheme (maximum number of iterations set to 20).
Random Forests. Random forests (Breiman, 2001)
rely on another paradigm for combining classifiers
called bagging (or bootstrap aggregating). Here the
elementary classifiers are decision trees, that aim to
provide an iterative procedure for classification. At
each level of the tree are identified the couple of fea-
ture and associated threshold that allows for the best
separability among classes. Random forests build
upon this principle and consider that this selection is
made among a random subset of the features. Individ-
ual decision trees are initialized with random subsets
of training samples, that are finally combined to pro-
duce the global decision.
4 EXPERIMENTATIONS
The detection method described in the previous sec-
tion is assessed through an experimental evaluation.
Our goal is to compare the performance of the differ-
ent classifiers on a predefined dataset as well as one
some mosaics produced with the stitching methods in-
troduced in Sec. 2.
4.1 Experimental Setup
4.1.1 Dataset
The experimental dataset is made of aerial pho-
tographs of the Gulf of Morbihan, Brittany, France.
Sixteen different images (containing between 8 MPix-
els for still images to 42 MPixels for large mosaics)
have been split in two different sets. Seven images
have been used to extract positive and negative sam-
ples to train the classifiers. The other nine are used
to test the performances of the proposed pipeline
(i.e., ground truth has been built manually and con-
tain 1231 humans), and the results are explained in
Sec. 4.2. Since the classification method in use is su-
pervised, it requires the availability of some training
set. In order to ensure robustness of the proposed de-
tection method, we have manually extracted samples
from different images with various background and il-
lumination conditions. It is well known that the train-
ing set has a strong influence on the classification and
detection results. We have thus built a large set of pos-
itive (600) and negative (8000) images. The ratio be-
tween positive and negative images is approximately
1:13, and positive/negative training samples are illus-
trated in Fig. 6. The negative set has been extracted
by hard negative mining process.
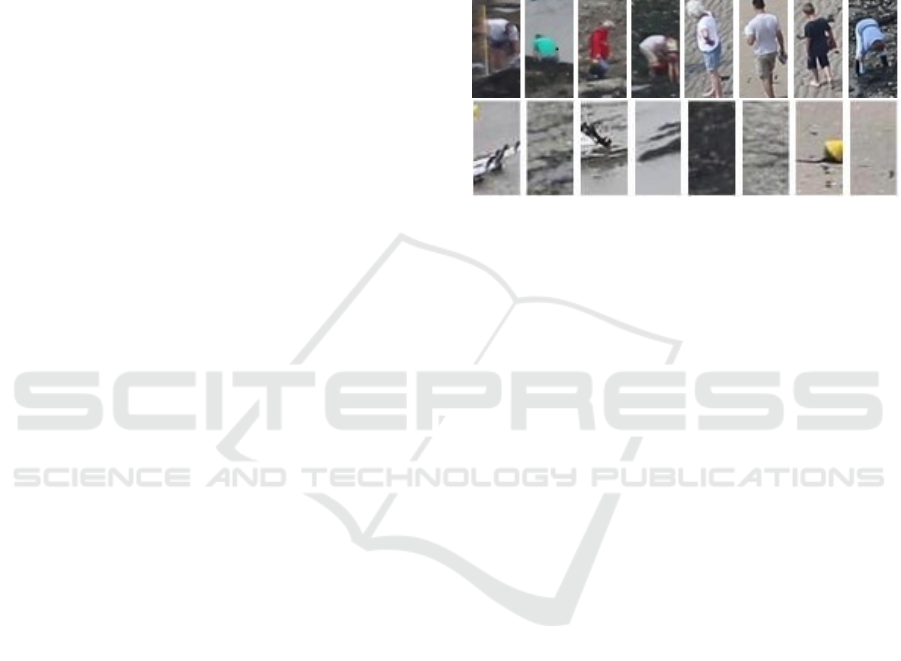
Figure 6: Illustration of the training set: positive (top) and
negative (bottom) samples.
4.1.2 Evaluation Method
The availability of some ground truth data (see pre-
vious subsection) allows conducting supervised eval-
uation. We use here standard evaluation criteria and
measure the number of true positive (TP), false nega-
tive (FN), and false positive (FP). A detected object is
considered as a true positive as soon as the distance
between its window center and the position of the
closest reference data is lower than half its window
width. From these scores, we compute the widely-
used recall R, precision P and F
1
measures:
• R = T P/(T P +FN) measures the ratio of real hu-
mans among all detected objects;
• P = T P/(T P +FP) measures the ratio of detected
humans among all present in the scene;
• F
1
= 2 × P × R/(P + R) is the harmonic mean al-
lowing to evaluate both precision and recall.
The F-1 score will be the main evaluation crite-
ria (the higher it is, the better the method is) since
it account for both false positive and negative rates.
Precision and recall scores will be used for better un-
derstanding of the behavior of the compared methods.
4.1.3 Evaluation in a Detection Context with
Sliding Windows
The proposed method is applied on large images
through a sliding window scan (and detection). At
each position a sub-image is extracted, used as in-
put in the description and classification steps. Due to
the oblique viewpoint, size of visible humans in the
VISAPP 2016 - International Conference on Computer Vision Theory and Applications
668
scene can vary depending on their position. We thus
rely on a multi-scale detection procedure to account
for different objects size. It consists simply in down-
sampling the mosaic image, before applying the same
sliding window analysis.
A major issue with the proposed multi-
scale/sliding window analysis comes with the
possible multiple overlapped detections of the same
human. Positive neighboring rectangles are then
merged through a standard similarity vote procedure
in a post-processing step. Figure 7 illustrate how this
strategy can greatly simplify the detection by com-
bining the multiple detected objects into more robust
detections. Once the full image is processed and the
rectangles merged the different scores are computed.
The detection is validated if the rectangle’s center is
at a minimal distance from a truth position.
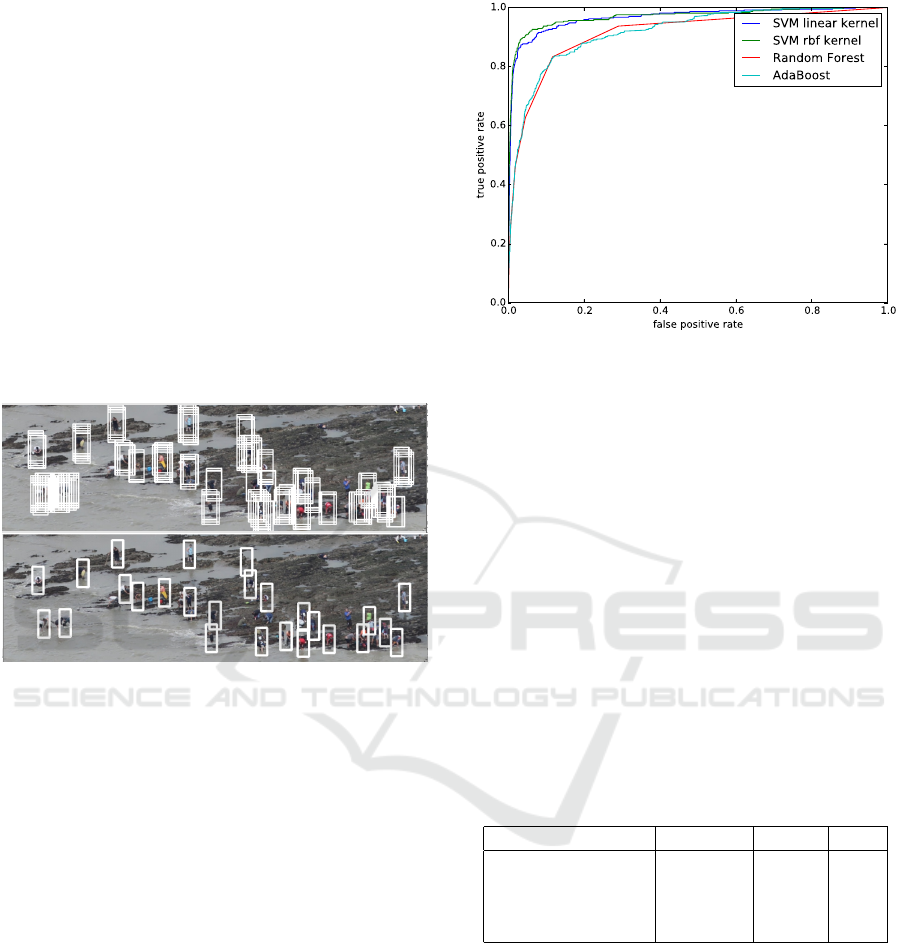
Figure 7: Detection after the sliding window method (top)
and after merging positive rectangles (bottom).
4.2 Results
In this paper, we report two different kinds of exper-
imental evaluations. We have first conducted a clas-
sification task using the positive/negative samples to
assess the performance of the different classifiers. We
then evaluate their ability to perform object detection
in the context considered, i.e. processing large aerial
mosaics to identify shellfish gatherers.
4.2.1 Classification Evaluation
The four classifiers presented in Sec. 3.2.2 (i.e., SVM
with linear kernel, SVM with rbf kernel, AdaBoost,
and Random Forests) are assessed on the extracted
image dataset split into a 60% training set and 40%
testing set. The results are given in Fig. 8 through
a ROC curve. We can see that on this classification
task, the SVM with an rbf kernel has a better area un-
der the curve and thus performs better. Indeed, for a
0.05 fpr (false positive rate), we reach a tpr (true pos-
itive rate) of 0.94. This experiment was designed to
Figure 8: ROC curve of the different classifiers, computed
on a classification task.
provide some hints about the ability of the classifiers
to address detection in the full image.
4.2.2 Detection Evaluation
We finally assess the different classifiers in a detection
context. To do so we start with a mosaic, i.e. a large
image with three images stitched together. Compara-
tive results are given in Tab. 1. The best performance
is obtained by the SVM with Gaussian Kernel, with
a F1 score of 0.70 (corresponding to high precision
and recall). The final result obtained with this classi-
fier is shown in Fig. 10. In this scene, 235 shellfish
gatherers are present. The SVM with rbf kernel has
correctly detected 142 of them (true positive), while
29 detections were wrong (false negative).
Table 1: Quantitative evaluation of the classifiers for the
image of Fig.10 (mosaic with 3 images stitched).
Classifier Precision Recall F1
Adaboost 0.61 0.46 0.52
Random Forest 0.61 0.43 0.51
SVM linear kernel 0.47 0.73 0.57
SVM rbf kernel 0.83 0.60 0.70
Beyond assessment on a real mosaic, we have also
conducted some performance evaluation on a set of
9 images acquired at different times and locations.
Those images were chosen so as to provide a high
variability in terms of backgrounds, illumination con-
ditions, and density of shellfish gatherers. Two of
those images are mosaics (one is stitched from 3 ini-
tial images while the other is a composition of 8 im-
ages). To illustrate, the largest mosaic contains 368
humans while for single images, this amount varies
from 24 to 183 for the most crowded scene.
We report in Fig. 9 the performance of the 4 classi-
fiers through box plot analysis of the evaluation scores
Human Detection from Aerial Imagery for Automatic Counting of Shellfish Gatherers
669
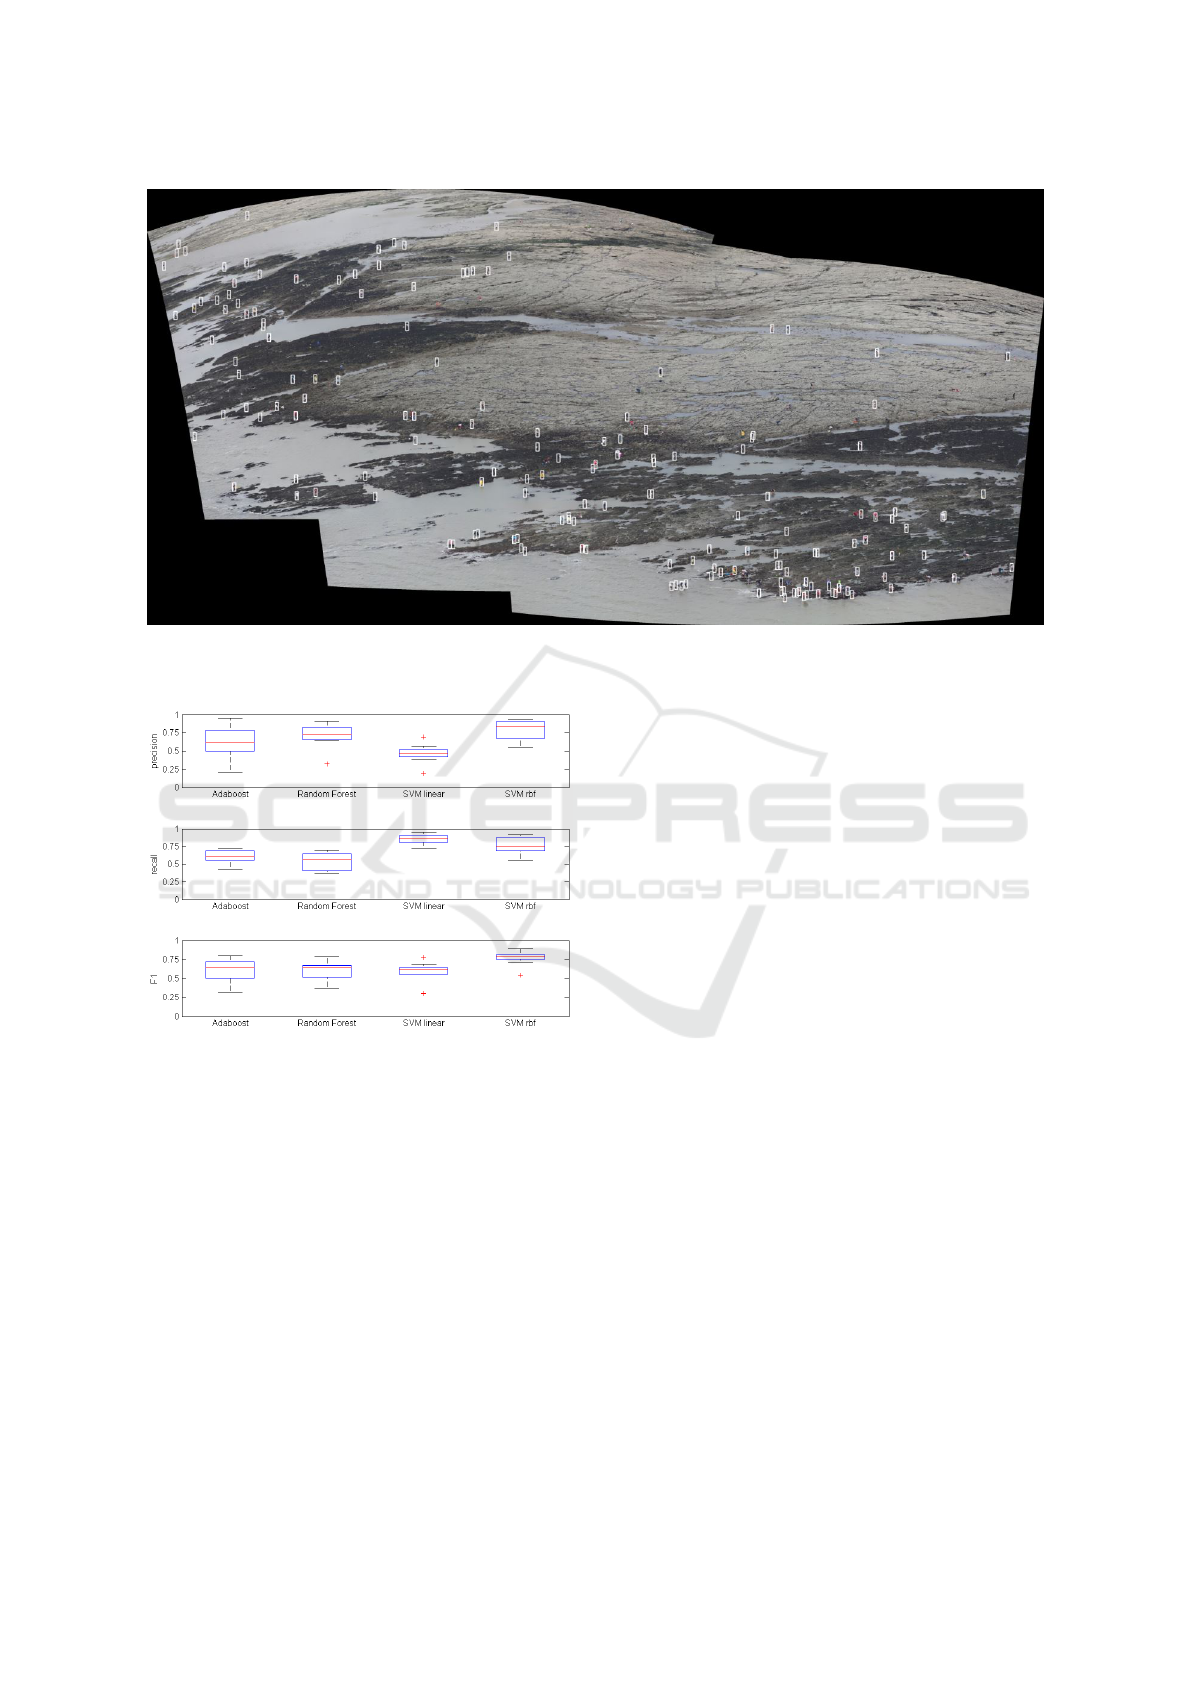
Figure 10: Detection on a full mosaic, using the HOG descriptor with the rbf SVM classifier.
Figure 9: Classifiers evaluation on box plots of the preci-
sion, recall and F-1 scores.
on this set of images. We can observe that, once again,
SVM with rbf kernel outperforms the other methods
on the F-1 score and provides a balance between false
positive and negative. Conversely, the SVM with lin-
ear kernel provide satisfactory level of recall at the
expense of a decrease in precision. Indeed, the rbf
kernel, with hard negative mining, has drastically re-
duced the number of false positive.
From this experimental study, we can conclude
that the SVM classifier with the rbf kernel is the best
compromise between recall and precision. It will thus
be chosen to provided an accurate estimation of the
number of shellfish gatherers present in the scene.
5 CONCLUSION
In this paper, we have addressed the problem of au-
tomatic counting of recreational shellfish gatherers
from aerial imagery. While being of prime impor-
tance for environmental activities, as well as manage-
ment and monitoring of natural parks, the lack of au-
tomatic solutions makes such (manual) visual anal-
ysis time-consuming and prevents from considering
large study sites. The proposed solution is a first at-
tempt towards automation of such analysis.
Stitching results show a correct and assembling
matching of image sequences. Nevertheless, some
image deformations remain that limit the perfor-
mances of the subsequent classifier. Besides, the non
rectilinear path followed by the plane (that rather fol-
lows the coastline) brings some issues with the warper
model in use. We are thus considering to change the
warper dynamically when assembling each new im-
age with the previous ones. Relying on GPS infor-
mation that might be available with the images could
also help to perform 3D modeling of the scene before
its projection on a 2D plane.
As far as the detection step is concerned, we
have observed that optimizing classifier parameters
can lead to satisfying levels of accuracy for shellfish
gatherers detection from real aerial campaigns from
the Brittany coast. There are still several directions
to be pursued to improve the quality of the results.
First, the visual appearance and size of the humans
depends on acquisition conditions (e.g., sun illumi-
nation, plane altitude, etc), while the learning is cur-
VISAPP 2016 - International Conference on Computer Vision Theory and Applications
670

Figure 11: An example of mosaic built from a video camera with BoofCV (top) with fusion frames superimposed at each
level (middle), and with OpenCV (bottom).
rently performed offline on a given set of training
samples. Defining automatic strategies to tune detec-
tion parameters (i.e., sliding window size, classifica-
tion settings) would allow for significant increase of
the method robustness w.r.t. new datasets and make it
able to deal with other geographical study sites. Be-
sides, we would like to rely on other patch descrip-
tors (e.g., color histograms) as well as other machine
learning paradigms (e.g., deep learning, active learn-
ing) to improve the detection rates.
ACKNOWLEDGEMENTS
The authors thank the team (Jonathan Pothier and Ro-
nan Pasco) from the Natural Park of Gulf of Morbihan
for providing the images as well as their support in
designing and assessing the proposed methodology.
REFERENCES
Abeles, P. (2012). Boofcv. http://boofcv.org/.
Andriluka, M. et al. (2010). Vision based victim detection
from unmanned aerial vehicles. In IROS, pages 1740–
1747.
Benenson, R., Omran, M., Hosang, J., and Schiele, B.
(2014). Ten years of pedestrian detection, what have
we learned? In ECCV Workshop on Computer Vision
for Road Scene Understanding and Autonomous Driv-
ing, volume 8926 of LNCS, pages 613–627. Springer.
Blondel, P. and Potelle, A. (2014). Human detection in un-
cluttered environments: From ground to UAV view.
In ICARCV, pages 76–81.
Bradski, G. (2000). Open source computer vision library.
Dr. Dobb’s Journal of Software Tools.
Breiman, L. (2001). Random forests. Machine learning,
45(1):5–32.
Dalal, N. and Triggs, B. (2005). Histograms of Oriented
Gradients for Human Detection. In CVPR, pages 886–
893.
Dollár, P., Wojek, C., Schiele, B., and Perona, P. (2009).
Pedestrian detection: A benchmark. In CVPR, pages
304–311.
Freund, Y. and Schapire, R. E. (1997). A decision-theoretic
generalization of on-line learning and an application
to boosting. Journal of Computer and System Sci-
ences, 55(1):119 – 139.
Itseez (2015). Open source computer vision library.
https://github.com/itseez/opencv.
Reilly, V., Solmaz, B., and Shah, M. (2010). Geometric
constraints for human detection in aerial imagery. In
ECCV, pages 252–265. Springer.
Viola, P. and Jones, M. J. (2001). Robust Real-time Object
Detection. International Journal of Computer Vision,
4:51–62.
Human Detection from Aerial Imagery for Automatic Counting of Shellfish Gatherers
671
