
Exploration of Component Diagrams with Multifocal Highlighting
Ladislav Cmolik
1,2
and Lukas Holy
2
1
Faculty of Electrical Engineering, Czech Technical University in Prague, Technicka 2, 166 27 Prague, Czech Republic
2
NTIS - New Technologies for the Information Society, Faculty of Applied Sciences, University of West Bohemia,
Univerzitni 8, 306 14 Pilsen, Czech Republic
Keywords:
Graph exploration, Highlighting, Component Diagram.
Abstract:
In the paper we present multifocal highlighting in reverse engineered component diagrams to support software
engineers in answering questions on relations between a number of components. With component oriented
systems such questions arise quite often. We use color to highlight all components relevant to selected focus
components. Further, we allow the users to filter the diagram. Our approach, unlike the state-of-the-art meth-
ods allows analysis of relations between dozens of components. We have performed an user study to evaluate
our multifocal highlighting. The results of the subjective evaluation show that the multifocal highlighting
supports software engineers in answering questions on relations between components.
1 INTRODUCTION
Software engineers maintaining a component oriented
software repeatedly deal with questions on relations
between several components: What functionality of
the system may be broken if certain component/s do
not work properly? If several components do not
work properly, what is the functionality they all re-
quire (as this is the potential source of the problems)?
The architecture of a component oriented system
is typically visualized as a component diagram. A
component (a node of the diagram) provides certain
functionality to other components and may require
functionality from other components. Often several
components cooperate together to provide a higher
level functionality. A component is seen as a black
box, in the system. A component can be replaced with
another one providing the same functionality. Unfor-
tunately, the number of relations that a component has
with other components is typically high, therefore the
component diagram is not a sparse graph.
Visualizations of graph data-sets often aspire to
present the user with the whole graph. In other words,
to fit the whole graph into the available space on the
screen. However, if the graph is large then the user see
mainly the global structure of the graph, but cannot
distinguish between the individual nodes and edges.
This makes even very basic tasks such as locating
certain node or following and edge almost impossible
(Shneiderman and Aris, 2006).
To reduce the structural complexity we can uti-
lize clustering techniques. However, the clusters are
typically formed based on the topological structure of
the graph. In the case of the component diagram of a
software system the topological structure can be very
different from the semantics of the graph. In conse-
quence also the resulting clusters do not reflect se-
mantics of the graph which can be confusing for the
user. Therefore, we rather provide the user with tools
to explore the graph as it is.
We can solve the problem with limited screen
space by zoom and pan, however in such case we
introduce temporal separation. When we zoom out
we cannot distinguish between the individual nodes
and edges and when we zoom in it is hard to see the
broader structure of the graph and follow long edges.
In consequence we will very often zoom in and then
again zoom out while concentrating to not loose the
desired nodes and edges from our sight.
The main contribution of the paper is the multifo-
cal highlighting that allows arbitrary number of focus
nodes. We use color to highlight the relevant com-
ponents. The multifocal highlighting is a relatively
simple technique that is easy to implement, yet allows
the users to solve a number of different tasks needed
when analyzing component diagrams. Results of our
user study confirm that the users are able to find an-
swers to such tasks in short time when the multifocal
highlighting is utilized. Further, they reported that the
multifocal highlighting supported them in solving the
tasks.
148
Cmolik, L. and Holy, L.
Exploration of Component Diagrams with Multifocal Highlighting.
DOI: 10.5220/0005781301460152
In Proceedings of the 11th Joint Conference on Computer Vision, Imaging and Computer Graphics Theory and Applications (VISIGRAPP 2016) - Volume 2: IVAPP, pages 148-154
ISBN: 978-989-758-175-5
Copyright
c
2016 by SCITEPRESS – Science and Technology Publications, Lda. All rights reserved
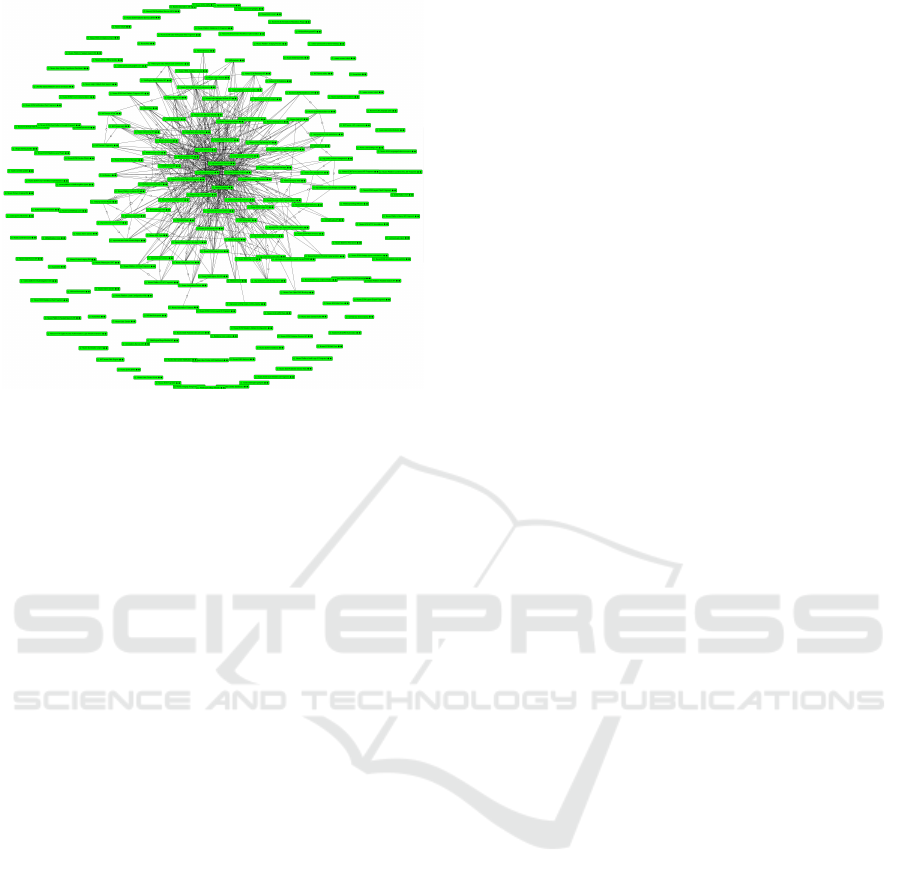
Figure 1: Reverse engineered component diagram of Nuxeo
system (consisting of 203 components) depicted in notation
of Holy et al. (2012) . Layout of the nodes is determined by
force-based layout of Kamada and Kawai (1989) .
When combined with filters the multifocal high-
lighting, unlike the state-of-the-art methods, can be
used to analyze mutual relations between many com-
ponents. In the paper we use this approach to analyze
subsystem composed from 58 components, which
yields to 58 focus nodes.
Further, the components can be filtered based on
software metrics. Software metrics allow us to filter
the diagram based on information that is not encoded
directly in the diagram (e.g., reliability of the compo-
nents or coverage by unit tests).
In this paper we use reverse-engineered compo-
nent diagrams (hundreds of nodes) of component
based software systems to demonstrate our approach
(see Figure 1 for an example). Nevertheless, we be-
lieve that the presented approach can be adapted to
any kind of graph.
2 RELATED WORK
In this section we present work related to the graph
exploration. We expect that the graph has a reason-
able layout and thus we do not focus on this area. A
multitude of automatic layout algorithms have been
developed (see bibliography by Battista et al. (1994)
or handbook by Tamassia (2013)). In our implemen-
tation we are using force-based layout of Kamada and
Kawai (1989) implemented on GPU. We focus mainly
on existing techniques that can be utilized to explore
relations of one or several focus nodes.
Focus+Context. The Focus+Context techniques
can be divided into two categories. In the first cate-
gory are techniques that are built directly into the cal-
culation of the layout of the graph. Such technique is
the layout of a graph in hyperbolic space (Munzner,
1997). However, in the hyperbolic space only one fo-
cus region is possible.
In the second category are techniques that de-
form the space on which is the graph rendered af-
ter the layout is calculated. These techniques are
independent of the layout algorithm. Basic exam-
ple of such technique is fish-eye deformation used by
Sarkar et al. (1992). Their fish-eye deformation is
based on degree-of-interest and it is an extension of
generalized fish-eye views by Furnas (1986).
Later, the fish-eye deformation was extended for
multiple foci by Sheelagh et al. (1996) and Kea-
hey et al. (1996). However, even with the multiple
focus regions it is hard to track relations between the
nodes in the focus regions.
Movable Filters. Another category of tools to ex-
plore graphs are movable filters also known as lenses.
Movable filters are rectangular or circular area where
information is filtered out or emphasized. By overlay-
ing several movable filters we can combine their ef-
fects. Note that movable filters used to explore graphs
are also Focus+Context techniques where the focus
are edges or nodes inside of the filter area.
Wong et al. (2003) are using circular movable fil-
ter to separate close edges with fish-eye deformation.
Hurter et al. (2011) and Panagiotidis et al. (2011) use
movable filters to bundle and unbundle edges of the
graph. Tominsky et al. (2006) are using movable fil-
ter to filter out edges that are not incident with nodes
in the area of the filter.
Further, Tominsky et al. (2006) are using circu-
lar movable filter to bring neighbors of one or sev-
eral nodes of the graph in the area of the filter into
the area by changing positions of the neighbors in
the graph layout. Similar technique was applied by
Moscovich et al. (2009) with the difference that the
whole screen was used as the area of the filter. Unfor-
tunately, these approaches cannot be easily extended
to work with multiple foci in order to track relations
between the focus nodes.
Highlighting. Static highlighting (e.g., with color)
of information relevant to one selected node is quite
common. Barsky et al. (2007) is using color to high-
light neighbors of a node in network representing bi-
ological system or process. Holy et al. (2013) is using
color to highlight neighbors of a node in a compo-
nent diagram of software system. Unfortunately, with
Exploration of Component Diagrams with Multifocal Highlighting
149
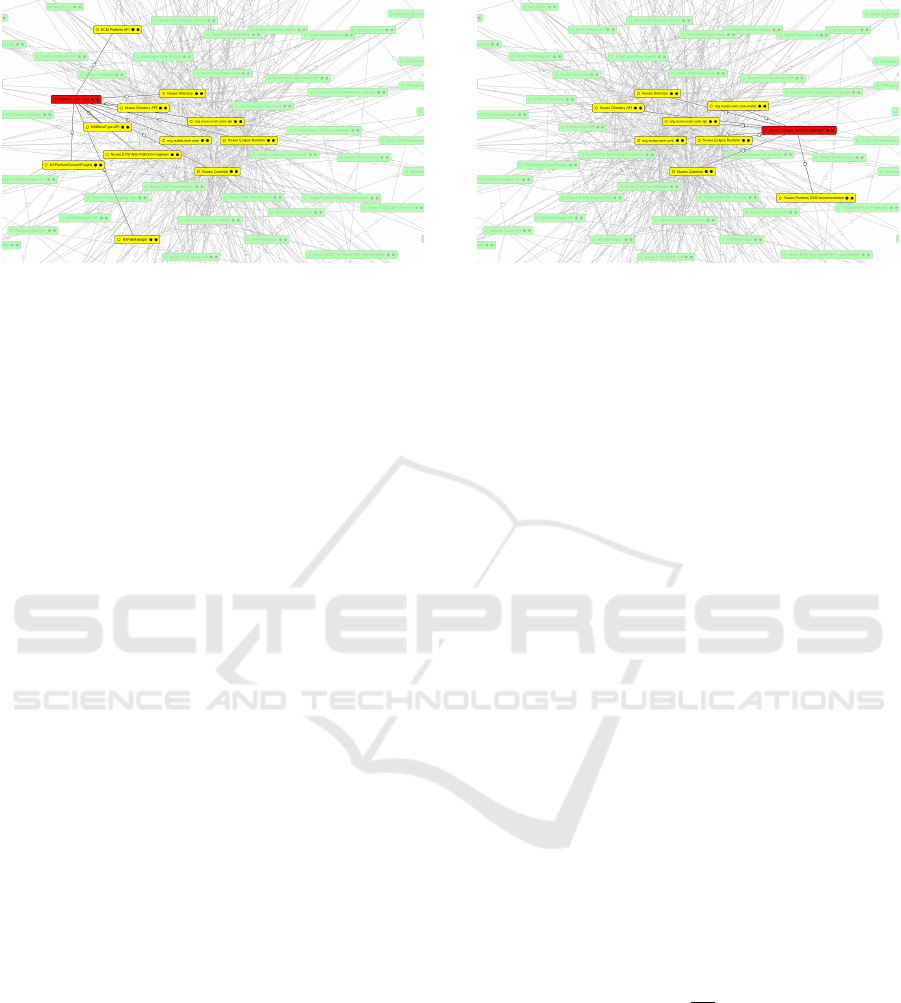
Figure 2: Visually emphasizing interacting components (yellow) of the focus component (red) in the diagram (shown for two
different components) does not help to identify components that interact with both selected components quickly.
highlighting that allows only one focus node it is still
very hard to gain insight into relations between more
than one node (see Figure 2 for an example).
Heer and Boyd (2005) allow specification of two
focus nodes and use color to highlight the neighbors
of both nodes. Ware and Bobrow (2005) use both
static (with color) and motion highlighting to high-
light neighbors of two nodes in artificial graphs of
varying complexity. By performing a user study they
found out that by using color to highlight neighbors of
the first focus node and motion to highlight neighbors
of the second focus node the users are able to identify
which nodes are neighbors of the first node, neigh-
bors of the second node and neighbors of both focus
nodes. Unfortunately, extension of this approach for
more than two focus nodes is not possible.
Byelas and Telea (2006) use color to highlight
several sets of interest in software architecture di-
agrams. An area containing all nodes of each set
is constructed and filled or outlined with a chosen
color. All areas are rendered underneath the visual-
ized graph. Nodes belonging to several areas can be
identified when the areas are outlined, or filled with
semitransparent color. However, if the shapes of the
areas are complex or the number of areas is high it
can be difficult to identify nodes belonging to several
sets.
Glyphs. Glyphs are graphical objects that convey
multiple data values. Here we focus on glyphs that
support identification of nodes belonging to several
overlapping sets in the graph. Termeer et al. (2005)
use colored icons to indicate that nodes belong to sev-
eral sets. The number of icons corresponds with the
number of sets. An icon is displayed if the node be-
longs to the set associated with the icon and hidden
otherwise. Vehlow et al. (2013) and Liu et al. (2014)
are using pie-charts to depict nodes that belong to sev-
eral sets. However, if the number of overlapping sets
is high (e.g., higher than 8) than it is hard to quickly
identify all nodes belonging to the desired sets.
3 MULTIFOCAL HIGHLIGHTING
In this section we present static highlighting that is
using color to visually emphasize relevant neighbor
nodes of focus nodes in the graph. We allow arbi-
trary number of focus nodes, although usually only
low number of nodes is needed to support answering
questions stemming from our use cases. We demon-
strate our approach on reverse-engineered component
diagrams of a component system. In the following
text we will refer to the nodes of the graph as compo-
nents.
Our objective is to support rapid visual identifica-
tion of components that interact with all focus com-
ponents. We share the opinion of Ware and Bo-
brow (2005) that the most common task is to iden-
tify if two or several subsets of the diagram have
nodes/components in common. Further, we aim to
provide information also about those components that
do interact at least with one (but not with all) of the
focus components.
Our approach is based on assigning importance to
each component in the diagram. The visual emphasis
of component C
i
is driven by importance I
i
∈ [0, 1]
calculated as
I
i
=
N
i
N
F
(1)
where N
i
is the number of focus components that in-
teracts with component C
i
and N
F
is the total num-
ber of focus components. For each focus component
the user can specify which edges will be considered
in calculation of N
i
: edges representing functionality
that is provided to other components, edges represent-
ing functionality that is required from other compo-
nents, or both types of edges.
We map the importance on color of the compo-
nents in the diagram. As people cannot perceive dif-
IVAPP 2016 - International Conference on Information Visualization Theory and Applications
150
(a)
1
3
2
(b)
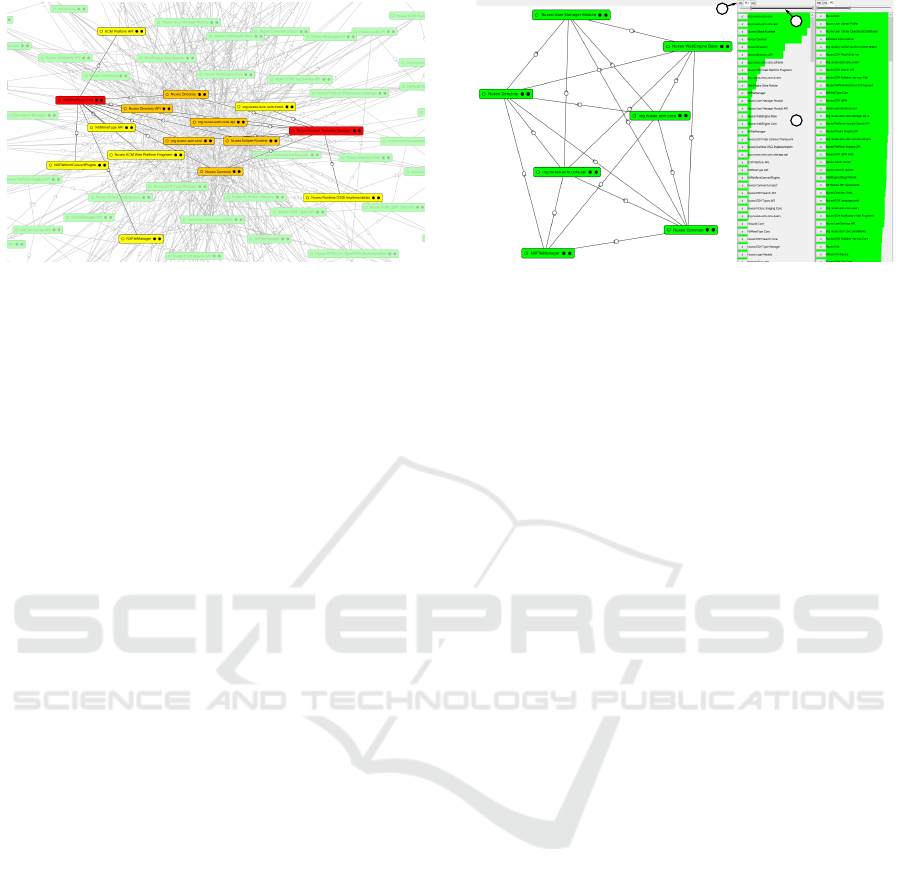
Figure 3: (a) Multifocal highlighting of two selected components. The components interacting with all focus components
are emphasized (orange). (b) Side panel utilized to display software metrics (1), the user can choose desired metric using
tabs (2) and specify low and high thresholds for the metric with range slider (3). The graph shows the result of filtering out
components with low connectivity to other components (M1) and high coverage of code with Unit tests (M2) from component
diagram of Nuxeo system. We show here the used metrics and thresholds side by side.
ference in color hue precisely (Baker and Wickens,
1995) we use only four colors: red for focus com-
ponents, orange for components interacting with all
focus components, yellow for components interacting
with at least one of the focus components (we denote
the orange and yellow components as context of the
focus components), and green for components that
do not interact with any focus component (we denote
these components as components outside of the con-
text).
To reduce visual clutter and make the important
components and the edges between them more promi-
nent we render the components and edges in specific
order:
1. We render the edges that are not incident with any
focus component.
2. We render the components outside of the context.
3. If the number of focus components is not zero we
render white semitransparent layer over the whole
diagram otherwise we end the rendering process.
4. We render edges between the components in the
context and the focus components.
5. We render components in the context.
6. We render edges between the focus components
in red color.
7. Finally we render the focus components.
We use painters algorithm to render the compo-
nents, the edges and components that are rendered
later are rendered over those rendered previously
which ensures their visibility. Step 3 visually sup-
presses the edges and components rendered in Step 1
and Step 2.
The multifocal highlighting not only allows to vi-
sually emphasize context of a focus component (see
Figure 2), but also to emphasize components that are
interacting with two or more components without in-
troducing spatial or temporal separation (see Figure
4(d)).
To provide additional information about the com-
ponents in the context we visualize their importance
as a length of horizontal bars that are displayed in the
side panel (see Figure 4(f)) and allow the users to filter
the components according to the importance. We map
the importance on the length as difference in length is
perceived by people much more precisely than differ-
ence in color (Baker and Wickens, 1995).
4 FILTERS
We allow the users to filter the diagram according to
different software metrics. A metric is a number as-
sociated with each component that expresses certain
characteristic. In our prototype we use two types of
software metrics. The software metrics of the first
type are connected to the structure of the diagram.
We are using two such metrics: connectivity to other
components and connectivity to focus components.
Note that the later metric is in fact the importance
calculated with Equation 1. The software metric of
the second type provides additional information that
is not encoded in the diagram. As a proof of concept
we use coverage of the code with unit tests.
Components can be filtered out from the side
panel based on any given metric, using one or two
thresholds - high and low values of the selected met-
ric. In the filters panel each metric is represented as a
tab where the components names are sorted according
the given metric. The value of the metric is visualized
Exploration of Component Diagrams with Multifocal Highlighting
151
(a) (b) (c)
(d) (e) (f)
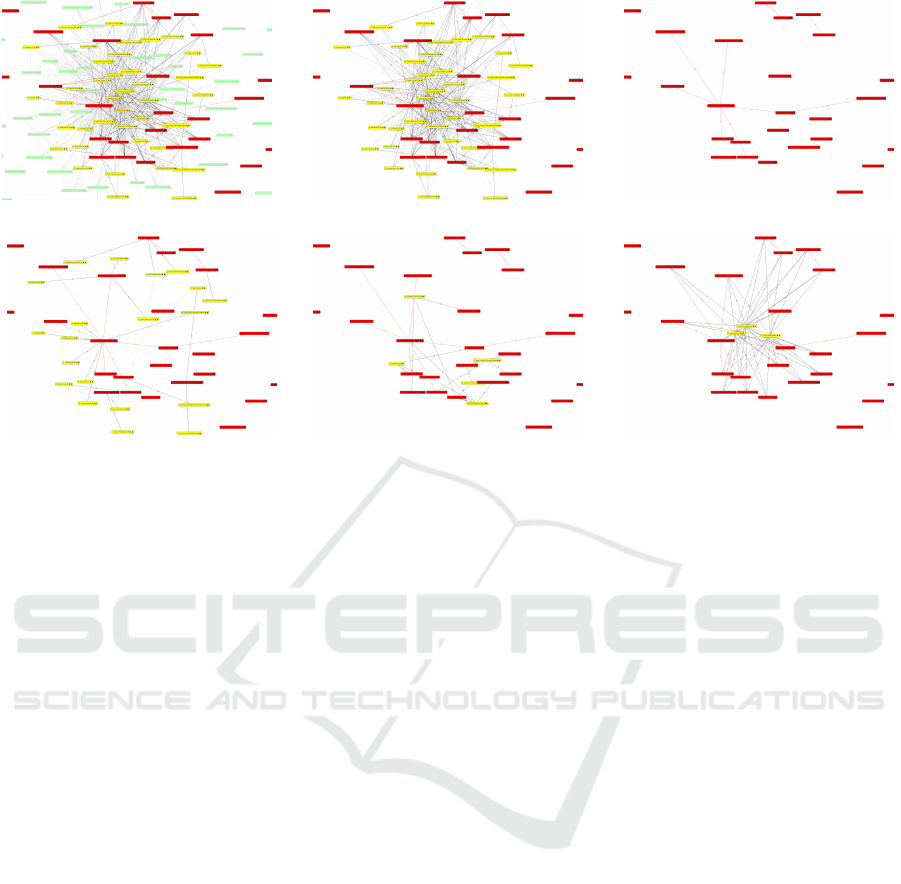
Figure 4: In all figures we display only the connected part of the ECM subsystem: with all components (a), with connected
components (b), only the focus nodes (c). In the bottom figures we display only components that are connected to 1 focus
component (d), to 3-5 focus components (e), and to 18-19 focus components (f).
as a length of a horizontal bar. The color of the bar
matches the color of the component in the diagram
which helps to locate the important components in the
diagram quickly.
For example, filtering out components with low
degree of connectivity to other components will leave
only the tightly connected core of the system visible.
Several metrics can be combined together to filter the
graph. For example, if we want to improve the unit
tests then the components used by many other com-
ponents, but with the low unit test coverage are good
candidates to start with (see Figure 4(f)).
In situations when there is a need to analyze mu-
tual relations between many components the user can
use the connectivity to focus components and the two
thresholds to filter all components except those inter-
acting with the desired number of focus components.
By sequentially increasing both thresholds the soft-
ware engineer can analyze relations between the fo-
cus components, component interacting only with one
focus component, components interacting with two
focus components, and so on. At the same time the
number of displayed nodes an edges is significantly
decreased. For analysis of ECM subsystem (com-
posed from 58 components) of the Nuxeo system see
Figure 4.
5 EVALUATION
We have evaluated the multifocal highlighting with
an user study. We have chosen the tasks to represent
real-life situations (e.g., find components that inter-
act with one or two specific components, find depen-
dencies of a subsystem composed from several com-
ponents). We have performed subjective evaluation
where the participants rate the effect of the multifocal
highlighting in terms of confidence, speed, comfort,
and support with regard to the solved tasks.
Six participants were recruited from our univer-
sity. All were daily users of computers and have ba-
sic experience with analysis of component diagrams.
They ranged from 25 to 30 years (Mean = 27.33, SD
= 1.8).
The hardware consisted of standard PC computer
with 24 inches LCD display (resolution 1680 1050
pixels), keyboard and optical mouse with 2 buttons.
The test was performed on reverse engineered compo-
nent diagram of Nuxeo system (see Figure 1) consist-
ing of 203 components depicted in notation of Holy
et al. (2012). Layout of the nodes was determined by
force-based layout of Kamada and Kawai (1989).
Before the experiment the moderator explained
the GUI of our application and the tasks. The ex-
periment began with a training session. The training
session consisted of 7 tasks similar to those in the test,
but performed on different components. The goal was
IVAPP 2016 - International Conference on Information Visualization Theory and Applications
152
to let participants to get familiar with the multifocal
highlighting, to get used to the experiment procedure
and to minimize any learning effects. Training ses-
sion was followed by the test where completion time
was measured for each task. The test was consisting
of 7 tasks:
1. Which components are connected to Management
part (*management) of the system?
2. Which dependencies are not mutual for *HTML*
components?
3. Which components are needed by every NXFile-
Manager* component?
4. Which components are connected to Nuxeo ECM
LDAP Directory component?
5. How many components are connected to both
org.nuxeo.ecm.core.storage.sql.management and
org.nuxeo.runtime.management?
6. Which components are connected to Nuxeo ECM
Search API but not to NXFileManager?
7. Which components are removed from common
dependencies when adding component Nuxeo
Platform Expression Language to the set of NX-
Audit Core and Nuxeo Audit API components?
Participants were asked to proceed as quickly and ac-
curately as possible. Between each task the partici-
pants were allowed to take short breaks. Participants
were interacting with the application with mouse.
After the test, participants completed a question-
naire investigating their subjective judgment about the
level of confidence, speed, comfort, and support for
the given tasks. Likert scale 1-5 was used for the sub-
jective evaluation where 5 is the most positive mark
(e.g., the user thinks that the tool helped him to be
absolutely confident when answering the questions),
3 is a neutral mark, and 1 is the most negative mark
(e.g., the user thinks that the tool did not helped him
at all to be confident when answering the questions).
6 RESULTS AND DISCUSSION
All 6 participants successfully completed all 7 tasks.
We report the results of our user study in Table 1.
In the following text we report arithmetic mean
and standard deviation (SD) for the subjective evalu-
ation. For the completion times we report geometric
mean and 95% confidence interval calculated accord-
ing to Sauro et al. (2012) these methods give the best
estimates for completion times when the number of
participants is lower than 25.
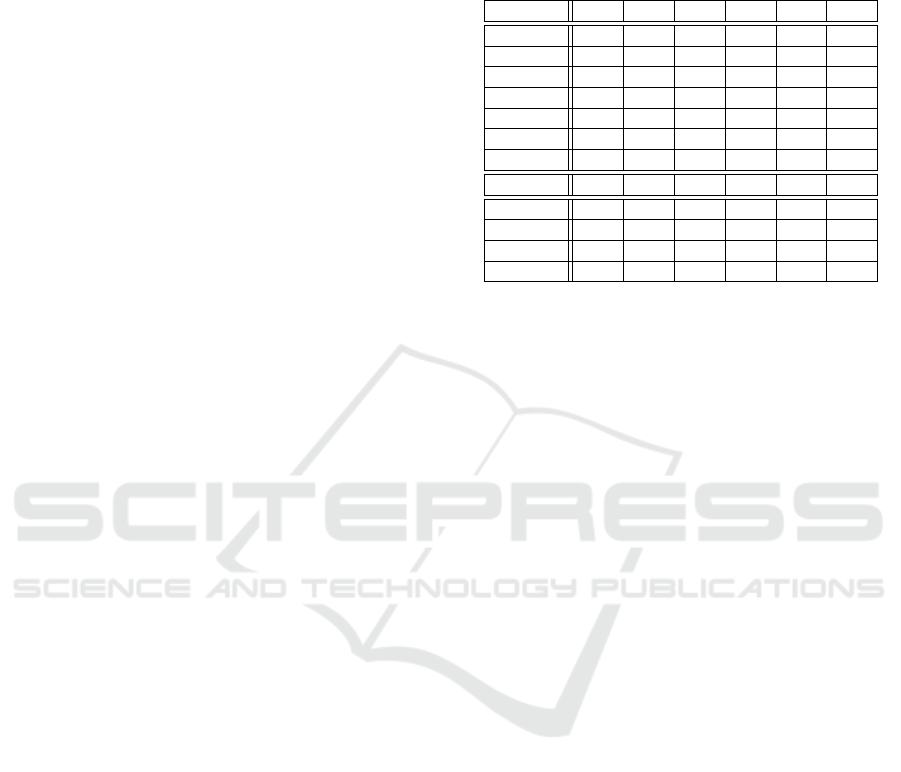
Table 1: Results of our user study. Completion times (in
seconds) needed by participants P1-6 to complete the in-
dividual tasks and cumulative time needed to complete all
tasks (T1-7). Results of subjective evaluation as reported by
the participants. Likert scale 1-5 was used.
P1 P2 P3 P4 P5 P6
Task 1 173 58 80 74 67 133
Task 2 32 121 54 84 215 155
Task 3 40 24 37 25 39 33
Task 4 26 23 30 31 23 47
Task 5 16 9 39 42 20 37
Task 6 74 107 34 59 66 148
Task 7 37 24 67 54 35 62
T1-7 398 366 341 369 465 615
Confid. 5 2 5 4 3 4
Speed 4 4 4 4 4 3
Comfort 5 3 4 3 2 3
Support 5 5 5 5 4 5
In average the participants have strongly agreed
(Mean = 4.83, SD = 0.37) that the multifocal high-
lighting provided support for solving the tasks. In
terms of the confidence (Mean = 3.83, SD = 1.06),
speed (Mean = 3.83, SD = 0.37), and comfort (Mean
= 3.33, SD = 0.94) the participants were in average
positive on those aspects of the multifocal highlight-
ing.
We report the average times and the 95% confi-
dence intervals in seconds. Task 1: Mean = 89.94s,
95% CI (57.4s,140.8s), Task 2: Mean = 91.46s, 95%
CI (43.7s,191.5s), Task 3: Mean = 32.33s, 95% CI
(25.5s, 41s), Task 4: Mean = 29.05s, 95% CI (21.9s,
38.5s), Task 5: Mean = 23.64s, 95% CI (12.4s,45.1s),
Task 6: Mean = 73.3s, 95% CI (43s,124.8s), and
Task 7: Mean = 43.71s, 95% CI (28.8s,66.2s). The
average time needed to complete all 7 tasks: Mean =
416.79s, 95% CI (331.5s,524s).
7 CONCLUSION
In this paper we have proposed multifocal highlight-
ing of nodes in a graph to help users quickly ex-
plore mutual neighbors of several nodes. For situ-
ations when users need to explore mutual relations
and neighbors of dozens of nodes we provide filter-
ing of the components based on the number of con-
nections to the focus components. Further we allow
the users filter the diagram based on software met-
rics. We have demonstrated our approach on reverse
engineered component diagrams of component ori-
ented software system where questions regarding mu-
tual neighbors of several components arise very often.
We have evaluated the multifocal highlighting with
6 software engineers. The results of the subjective
Exploration of Component Diagrams with Multifocal Highlighting
153

evaluation show that our multifocal highlighting sup-
ports the engineers in solving tasks related to identify-
ing the mutual neighbors of several nodes. In the fu-
ture work we would like to perform comparative user
study with various different techniques.
ACKNOWLEDGEMENTS
This publication was supported by the project
LO1506 and by the Aktion OE/CZ grant number 68p5
of the Czech Ministry of Education, Youth and Sports.
REFERENCES
Baker, M. P. and Wickens, C. D. (1995). Human factors in
virtual environments for the visual analysis of scien-
tific data. Technical report, Citeseer.
Barsky, A., Gardy, J. L., Hancock, R. E., and Munzner, T.
(2007). Cerebral: a cytoscape plugin for layout of and
interaction with biological networks using subcellular
localization annotation. Bioinformatics, 23(8):1040–
1042.
Byelas, H. and Telea, A. (2006). Visualization of areas of
interest in software architecture diagrams. In Proceed-
ings of the 2006 ACM symposium on Software visual-
ization, pages 105–114. ACM.
DiBattista, G., Eades, P., Tamassia, R., and Tollis, I. (1994).
Annotated bibliography on graph drawing algorithms.
Computational Geometry: Theory and Applications,
4(5):235–282.
Furnas, G. W. (1986). Generalized fisheye views. In
Proceedings of the ACM SIGCHI ’86 Conference on
Human Factors in Computing Systems, pages 16–23.
ACM.
Heer, J. and Boyd, D. (2005). Vizster: Visualizing online
social networks. In Information Visualization, 2005.
INFOVIS 2005. IEEE Symposium on, pages 32–39.
IEEE.
Holy, L., Jezek, K., Snajberk, J., and Brada, P. (2012).
Lowering visual clutter in large component diagrams.
In Information Visualisation (IV), 2012 16th Interna-
tional Conference on, pages 36–41. IEEE.
Holy, L., Snajberk, J., Brada, P., and Jezek, K. (2013). A
visualization tool for reverse-engineering of complex
component applications. In Software Maintenance
(ICSM), 2013 29th IEEE International Conference on,
pages 500–503. IEEE.
Hurter, C., Telea, A., and Ersoy, O. (2011). Moleview:
An attribute and structure-based semantic lens for
large element-based plots. Visualization and Com-
puter Graphics, IEEE Transactions on, 17(12):2600–
2609.
Kamada, T. and Kawai, S. (1989). An algorithm for draw-
ing general undirected graphs. Information processing
letters, 31(1):7–15.
Keahey, T. A. and Robertson, E. L. (1996). Techniques for
non-linear magnification transformations. In infovis,
page 38. IEEE.
Liu, S., Wang, X., Chen, J., Zhu, J., and Guo, B. (2014).
Topicpanorama: A full picture of relevant topics.
In Visual Analytics Science and Technology (VAST),
2014 IEEE Conference on, pages 183–192.
Moscovich, T., Chevalier, F., Henry, N., Pietriga, E., and
Fekete, J.-D. (2009). Topology-aware navigation in
large networks. In Proceedings of the SIGCHI Confer-
ence on Human Factors in Computing Systems, pages
2319–2328. ACM.
Munzner, T. (1997). H3: Laying out large directed graphs
in 3d hyperbolic space. In Information Visualization,
1997. Proceedings., IEEE Symposium on, pages 2–10.
IEEE.
Panagiotidis, A., Bosch, H., Koch, S., and Ertl, T. (2011).
Edgeanalyzer: Exploratory analysis through advanced
edge interaction. In System Sciences (HICSS), 2011
44th Hawaii International Conference on, pages 1–
10. IEEE.
Sarkar, M. and Brown, M. H. (1992). Graphical fish-
eye views of graphs. In Proceedings of the SIGCHI
conference on Human factors in computing systems,
pages 83–91. ACM.
Sauro, J. and Lewis, J. R. (2012). Quantifying the user expe-
rience: Practical statistics for user research. Elsevier.
Sheelagh, M., Carpendale, T., Cowperthwaite, D., Fracchia,
F., and Shermer, T. (1996). Graph folding: Extend-
ing detail and context viewing into a tool for sub-
graph comparisons. In Graph Drawing, pages 127–
139. Springer.
Shneiderman, B. and Aris, A. (2006). Network visualiza-
tion by semantic substrates. Visualization and Com-
puter Graphics, IEEE Transactions on, 12(5):733–
740.
Tamassia, R. (2013). Handbook of graph drawing and vi-
sualization. CRC press.
Termeer, M., Lange, C., Telea, A., and Chaudron, M.
(2005). Visual exploration of combined architectural
and metric information. In Visualizing Software for
Understanding and Analysis, 2005. VISSOFT 2005.
3rd IEEE International Workshop on, pages 1–6.
Tominski, C., Abello, J., Van Ham, F., and Schumann, H.
(2006). Fisheye tree views and lenses for graph vi-
sualization. In Information Visualization, 2006. IV
2006. Tenth International Conference on, pages 17–
24. IEEE.
Vehlow, C., Reinhardt, T., and Weiskopf, D. (2013). Visu-
alizing fuzzy overlapping communities in networks.
Visualization and Computer Graphics, IEEE Transac-
tions on, 19(12):2486–2495.
Ware, C. and Bobrow, R. (2005). Supporting visual queries
on medium-sized node–link diagrams. Information
Visualization, 4(1):49–58.
Wong, N., Carpendale, S., and Greenberg, S. (2003). Edge-
lens: An interactive method for managing edge con-
gestion in graphs. In Information Visualization, 2003.
INFOVIS 2003. IEEE Symposium on, pages 51–58.
IEEE.
IVAPP 2016 - International Conference on Information Visualization Theory and Applications
154
