
Beyond Nagios
Design of a Cloud Monitoring System
Augusto Ciuffoletti
Universit
`
a di Pisa, Dept. of Computer Science, Pisa, Italy
Keywords:
Resource Monitoring, On-demand Monitoring, Cloud Computing, Open Cloud Computing Interface (OCCI),
Containers, REST Paradigm, WebSocket.
Abstract:
The paper describes a monitoring system specially designed for cloud infrastructures. The features that are
relevant for such distributed application are -) scalability, that allows utilization in systems of thousands of
nodes, -) flexibility, to be customized for a large number of applications, -) openness, to allow the coexistence
of user and administration monitoring. We take as a starting point the Nagios monitoring system, that has
been successfully used for Grid monitoring and is still used for clouds. We analyze its shortcomings when
applied to cloud monitoring, and propose a new monitoring system, that we call Rocmon, that sums up Nagios
experience with a cloud perspective. Like Nagios, Rocmon is plugin-oriented to be flexible. To be fully inter-
operable and long-living, it uses standard tools: the OGF OCCI for the configuration interface, the REST
paradigm to take advantage of Web tools, and HTML5 WebSockets for data transfers. The design is checked
with an open source Ruby implementation featuring the most relevant aspects.
1 INTRODUCTION
Monitoring a large distributed infrastructure is a chal-
lenging task whose shape kept changing during the
last two decades. Considering its evolution in scien-
tific and academic environments, it moved from the
monitoring of a computer room with a few tens of
administered workstations, to the Grid-era character-
ized by a significant increase of the available cores
and the delivery of the resources to geographically
remote users, to the present, represented by a geo-
graphically distributed system offering computing re-
sources as services: the cloud. The task associated to
the monitoring infrastructure changed accordingly.
During the server room era, the complexity of
monitoring is concentrated on the local network,
which is in fact the main critical resource. Traffic
shaping and management depend on network moni-
toring: consider for instance the NWS (Wolski et al.,
1999) as a borderline tool, somewhat evocative of the
successive Grid era. The access to the monitoring sys-
tem is through logs and a dashboard displaying the
state of the system
The Grid era is characterized by an increased in-
terest for the network performance, WAN included,
together with the ability to detect the presence of
problems and request assistance, or enact compen-
sative actions. Such ability is extended to all sorts of
resources, typically including also storage and com-
puting facilities. The Globus Grid Monitoring Archi-
tecture (Tierney et al., 2002) is a good representative
of these tools, and we record the emergence of the
Nagios system (Josephsen, 2007) as a successful tool
in this category: the Nagios system is able to inspect
host and storage facilities on a routine basis, and to
run customized tests. Nagios contains an answer to
the demand of flexibility arising from the growing di-
versity of monitored resources: the probe that runs the
monitoring code is independent from the core appli-
cation, that has the role of controlling the probes using
a protocol based on widely deployed standard. A con-
figuration file controls the execution of the plug-ins.
The advent of cloud infrastructures has marked
another step in complexity and flexibility. Due to the
size of the system and to the pervasive use of virtu-
alization, the monitoring system is necessarily cou-
pled with management functions that dynamically op-
timize the performance of the system. Most of this ac-
tivity has a local scope, so that the monitoring data is
mostly consumed locally. Locality must be exploited,
since the quantity of monitoring data that is generated
makes a problem. Further flexibility is needed since
the user is one of the destinations of the monitoring
activity, as indicated by the NIST definition of cloud
Ciuffoletti, A.
Beyond Nagios - Design of a Cloud Monitoring System.
In Proceedings of the 6th International Conference on Cloud Computing and Services Science (CLOSER 2016) - Volume 2, pages 363-370
ISBN: 978-989-758-182-3
Copyright
c
2016 by SCITEPRESS – Science and Technology Publications, Lda. All rights reserved
363

computing (Mell and Grance, 2011). This is justified
since the user wants to check that the service quality
corresponds to the expectation, though this demand
does not exhaust the possible uses of monitoring data.
These features call for a new design approach that:
• addresses the decomposition of the monitoring
infrastructure into sub-systems, appointing the
monitoring tasks to components on a subsystem
basis;
• delivers the monitoring data flexibly, without stor-
ing information that may be consumed or deliv-
ered to the user, and selecting the storage depend-
ing on prospective utilization;
• provides the user with an interface for the con-
figuration of the monitoring activity, instead of a
configuration file.
Cloud providers are gradually improving their of-
fer of resource monitoring tools: a review is in (Ciuf-
foletti, 2016c). Here we focus on Nagios, an open
source project.
As a well conceived and robust product, Nagios
is presently a cornerstone of the EGI cloud infras-
tructure, a coordinated effort to federate the scientific
grids in Europe into a unique service provider. But it
does not fit the above profile: in this paper we want
to start from the successful experience of Nagios to
describe a monitoring framework that overcomes its
limits in the direction described above. Among the
key features of Nagios that we want to preserve are:
• plugin oriented software architecture, to adapt the
monitoring infrastructure to changing needs and
resources without the need to alter the core appli-
cation;
• utilization of standard tools and paradigms to take
advantage of continuous improvements of long
living tools and libraries
But we introduce in our design:
• a modular and agile architecture that envisions a
distributed control of the monitoring activity
• the extension of the plugin-oriented paradigm to
the utilization and the delivery of the monitoring
data
• the provision of an API to control the architecture
and the activity of the monitoring infrastructure,
that needs to be open to the user, but under the
control of the provider.
The paper is organized as follows. One section
is dedicated to an analysis of the Nagios monitoring
system, distinguishing features and limits when used
as a cloud monitoring application. In section 3 we
Figure 1: The design of the NRPE plugin: arrows indicate
direction of monitoring data flow.
introduce Rocmon, our proposal, first describing its
principles of operation, next its REST interface, and
finally its features compared with Nagios, also explor-
ing the transition from Nagios to Rocmon. Finally, we
document a running prototype of Rocmon, primarily
designed for demo and proof of concept purposes: it is
written in Ruby and based on Docker microservices.
2 Nagios
Nagios is a powerful tool-set that has been extensively
used for monitoring Grid infrastructures. It has also
been adopted to support the monitoring of the EGI
federation of clouds.
Nagios architecture is deeply influenced by a sep-
aration of concerns approach that distinguishes the
monitoring infrastructure from the probes that mon-
itor the resources. The rationale behind this approach
is that the probes evolve rapidly and depend on local
requirements and goals, while the components of the
monitoring infrastructure are designed to meet many
use cases and are more stable in time.
This approach brought to the design of a plugin
oriented framework: the basic building blocks are
containers hosting specific or custom functionalities
that are added as plugins.
The best example of such attitude is represented
by the Nagios Remote Plugin Executor (NRPE), a
client/server add-on (see figure 1). The server mod-
ule is installed on remote hosts and is controlled by
the central monitoring agent, hosting the client mod-
ule. The NRPE server gives remote access to a num-
ber of probes that are designed to perform software
and hardware checks on the remote host. The moni-
toring agent controls the execution of remote plugins
hosted by NRPE servers, and acquires data with a se-
cure connection using a standard protocol, SSL.
The NRPE architecture joins the stability given by
the use of a standard protocol and by the centralized
development of the NRPE modules with the flexibility
of the plugin mechanism, that enables the continuous
introduction and improvement of plugins. Currently
the Check mk drop-in module is a popular alternative
to NRPE.
However, the Nagios architecture suffers for the
presence of a centralized monitoring agent, that is ex-
OCCI 2016 - Special Session on Experiences with OCCI
364
posed to become a bottleneck in large deployments.
To amend this problem the NDOUtils add-on has
been implemented: it allows several Nagios servers to
exchange and share information through a database.
Such option alleviates, but does not solve, the pres-
ence of a bottleneck on the monitoring agent. Another
option is given by the Mod Gearman add-on, which
offloads checks to peripheral worker systems, so to
increase the performance in terms of a better latency.
In Nagios the monitoring agent is configured by
the system administrator that writes up a configura-
tion file that controls the activity of the Monitoring
Agent, possibly with the help of a graphical wizard
(like NConf). The presence of a configuration file,
however, tackles the agility of the whole system.
To cope with these issues the Nagios team is cur-
rently working at a seamless replacement of the orig-
inal product. The first release of the Naemon project
was on February 2015.
3 Rocmon
Starting from the user interface, the Rocmon moni-
toring system adopts an extension of the Open Cloud
Computing Interface (OCCI), an API defined in the
framework of the OGF. The OCCI-monitoring exten-
sion allows the user to define and request as a service
the deployment of a monitoring infrastructure cover-
ing the resources obtained from the cloud provider.
The Open Cloud Computing Interface (OCCI)
(Edmonds et al., 2012) is a standard API for the de-
scription of cloud resources. This interface plays a
fundamental role in a cloud computing architecture,
since it defines how the user submits its requests and
obtains feedback. The existence of a standard for this
interface is of paramount importance for interoper-
ability, and must be at the same time simple, to be
easely understood by the user, and flexible, to allow
extension and customization.
The OCCI API follows the REST paradigm
(Fielding and Taylor, 2002), an API design paradigm
that affirms the effectiveness of the HTTP proto-
col and extracts general API design principles from
the lessons learned from the successful diffusion of
the HTTP protocol. In a nutshell, it uses URIs
for addressing entities, functions are limited to the
four main HTTP verbs applied by the client to the
server, interactions are stateless, and responses may
be cached. Expandability is based on a code-on-
demand feature.
The key features of the OCCI protocol are expand-
ability and simplicity. These properties are introduced
by leveraging a protocol layering mechanism based
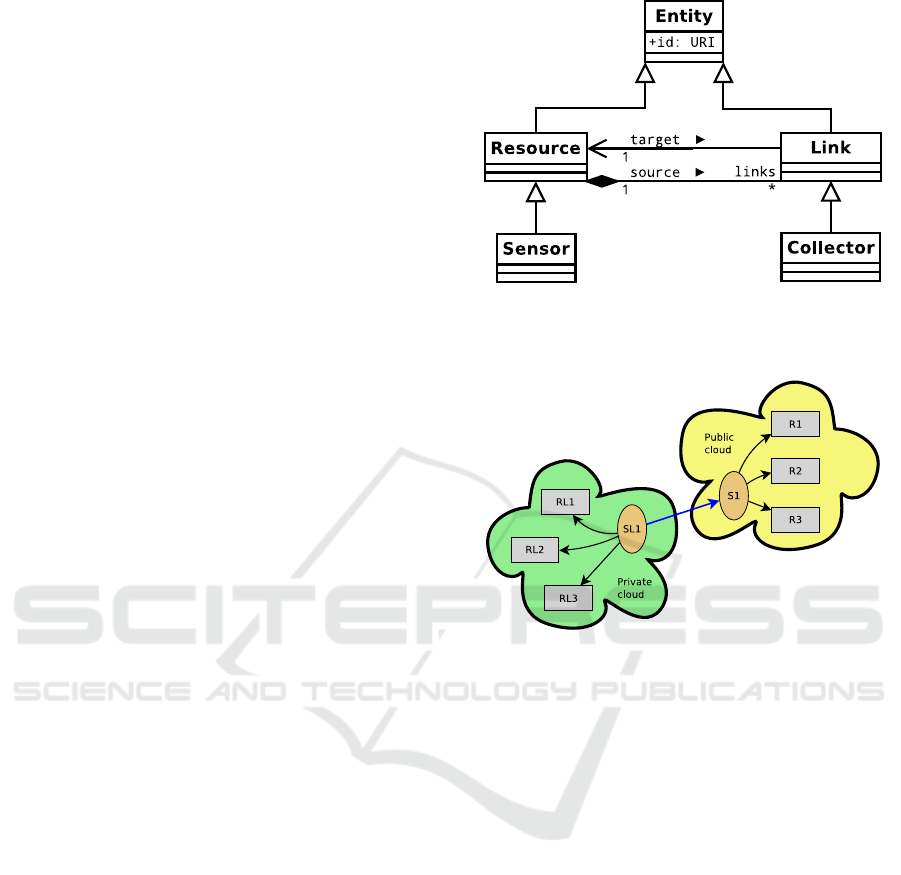
Figure 2: The simplified UML diagram including the core
OCCI classes (Resource and Link) and those in the monitor-
ing extension (Sensor and Collector).
Figure 3: Monitoring an hybrid cloud.
on extensions, that are based on the core OCCI spec-
ification (OGF, 2011), a vanilla specification that in-
troduces two basic entities, the OCCI resource and
the OCCI link, that represents a relationship between
OCCI resources. Rocmon is based on the OCCI mon-
itoring extension (Ciuffoletti, 2016c), that introduces
two entity sub-types: the sensor — an OCCI resource
— and the collector — an OCCI link. A simplified
diagram is in figure 2
The monitoring infrastructure is made of sensors
that manage the monitoring information coming from
probes that monitor cloud resources. The association
between a sensor and the monitored resource is ren-
dered with a collector, a link in OCCI terminology. In
Figure 3 each arrow represents the monitoring activity
implemented by a collector.
Since sensors are themselves considered as OCCI
resources, the abstract model allows a sensor to re-
ceive information from another sensor, thus allowing
the implementation of arbitrarily complex monitoring
networks. For instance, in figure 3 we see the sim-
ple case, yet relevant in practice, of a hybrid cloud:
the sensor in the private cloud receives data from the
public cloud across the collector represented by the
Beyond Nagios - Design of a Cloud Monitoring System
365

blue arrow. This can be useful, for instance, to trans-
parently inform users about the performance of their
resources, independently from the cloud they are al-
located to, or to control task out-sourcing.
The operation of the sensor is controlled by time
and periodical: therefore a sensor may generate asyn-
chronous events, like an alarm, but it is not meant to
receive and manage them. In fact sensor and collector
attributes only define the timing of their operation.
This is because Rocmon, in analogy with Nagios,
does not go into the detail of the specific function-
alities: in a sense, sensor and collector are abstract
classes, whose definition must be finalized when they
are instantiated. We envision three types of plugins,
mixins in OCCI terminology, that can be associated
with sensor and collector instances to finalize their
definition:
metric - that roughly correspond to Nagios NRPE
probes, are collector mixins that implement re-
source monitoring,
aggregator - are sensor plugins that receive and pro-
cess monitoring data,
publisher - are sensor plugins that deliver the mon-
itoring data outside the monitoring infrastructure,
for instance storing it in a database
When the user defines a component of the monitor-
ing infrastructure, the OCCI API allows to indicate
the mixins that finalize the description of an abstract
component.
The control of the two software components of our
design, the sensor and the probe represented by the
collector edge, is based on the REST paradigm, thus
extending to the back-end interface the paradigm that
is applied to the user-interface.
So that we have three interfaces, including the
OCCI-monitoring user interface, that follow the
REST paradigm. Since the user interface is exhaus-
tively defined in the OCCI core document (OGF,
2011) we focus on the other two: the one that is of-
fered by the sensor to configure its monitoring activ-
ity, and the one that is implemented by a generic mon-
itored resource that is reached by a collector. These
APIs are accessed by a cloud management function-
ality, and not directly by the user.
3.1 The Sensor Interface
The interface is summarized in table 1.
The GET method is primarily used to open a Web-
Socket (second row in Table 1): this kind of request
comes from the probe that is activated by the sen-
sor, and that returns the monitoring data to the sen-
sor itself. In this way there is a strict control over
Table 1: HTTP methods implemented by a sensor.
VERB PATH FUNCTION
GET / return OCCI de-
scription
GET / open WebSocket
POST / define or update
POST /collector/< id > attach a collector
DELETE / delete this sensor
Table 2: HTTP methods implemented by a generic re-
source.
VERB PATH FUNCTION
GET / return OCCI de-
scription
POST /collector/< id > attach a collector
DELETE / delete this re-
source
the clients that are allowed to open a WebSocket. In
absence of the WebSocket Connection: upgrade
header field, the GET method returns the description
of the sensor resource.
The POST request (third row in table) passes to
the sensor the description of its operation: its tim-
ing, described by the native attributes, and the specific
operation described by the aggregator and publisher
mixins: in listing 1 we see an example of the content
of such a request.
The POST operation is also useful to activate a
collector thread (fourth row in table) that connects the
sensor with another sensor. It is the handle needed
to build networks of sensors, and a special case of a
collector edge interface, discussed below.
3.2 The Collector Edge Interface
The generic resource exposes an HTTP server that
supports the REST protocol. The interface is sum-
marized in table 2.
The GET method is used to obtain the description
of the resource: this is useful to tune the configuration
of the metric mixin, that may depend on physical and
software specifications of the resource.
The POST request activates a collector thread that
connects the resource with a sensor: the JSON de-
scription contains its timing, described by the native
attributes, and the specific operation described by the
metric mixins: in listing 2 we see an example of the
content of such a request.
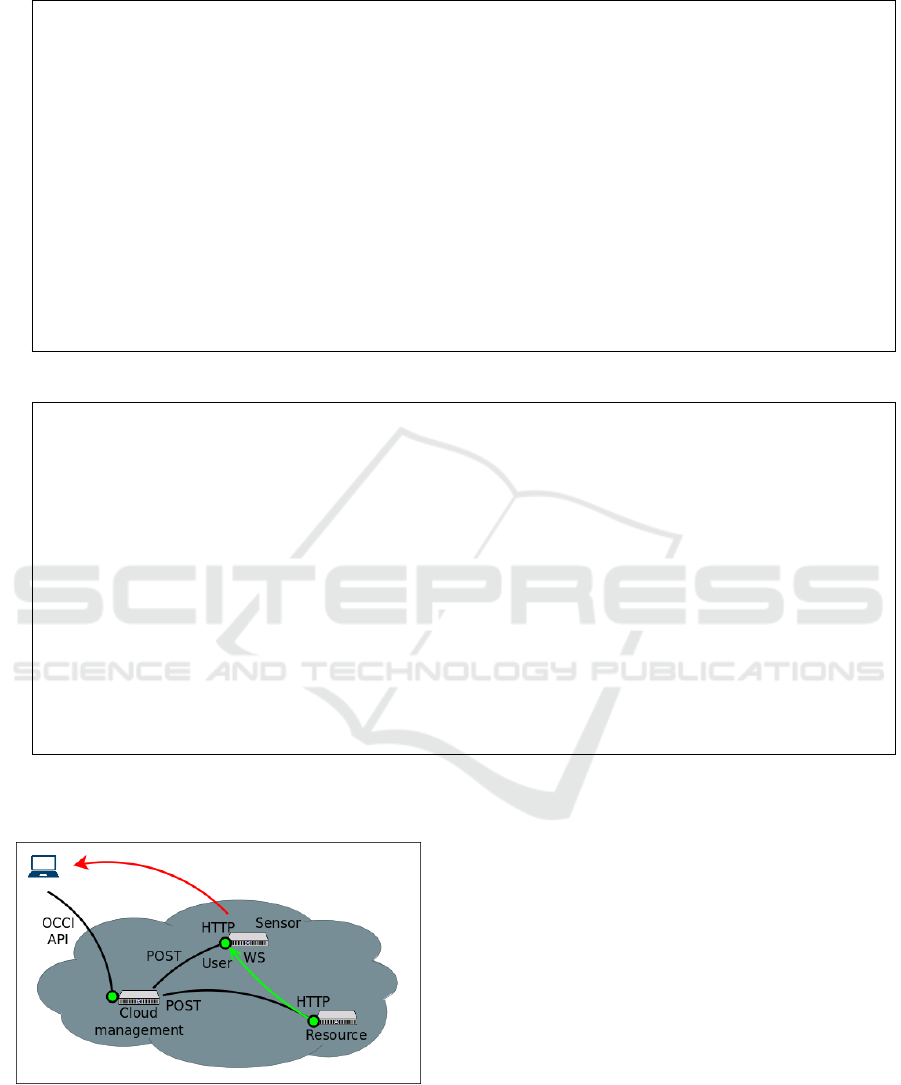
In figure 4 we see a minimal deployment consist-
ing of a web server, that implements the user inter-
face that controls the monitoring infrastructure, one
sensor and a generic resource. Each of them expose
OCCI 2016 - Special Session on Experiences with OCCI
366
Listing 1: JSON description of a sensor.
1 {
2 " id ": " s01 " ,
3 " ki nd ": " h ttp :/ / sc hem as . ogf . org / occ i / m on it or in g # se n so r " ,
4 " m i xi ns ": [
5 " ht tp :// e xam pl e . co m / oc ci / mo ni to ri ng / p ub li sh e r # S e nd UD P " ,
6 " ht tp :// e xam pl e . co m / oc ci / mo ni to ri ng / a gg re ga to r # E WMA " ,
7 " ht tp :// e xam pl e . co m / oc ci / mo ni to ri ng / p ub li sh e r # Log "
8 ],
9 " a tt ri bu te s ": {
10 " oc ci ": { " se n so r ": { " pe r io d ": 3 } } ,
11 " com ": { " e xam pl e ": { " o cci ": { " m on it or in g " : {
12 " S end UD P " : {" ho st na m e ": " l o ca lh os t " , " p o rt ": "8 888" , " in p ut ": " c "} ,
13 " EW MA " : {" g ain ": 16 ," i ns tr e a m ": " a " ," o ut st r e a m ": " c "} ,
14 " Log " : {" f il e na me ": "/ tmp / s01 . l og " ," in _ms g ": " b "}
15 } } } } } ,
16 " li nks ": []
17 }
Listing 2: JSON description of a collector.
1 {
2 " id ": " c01 " ,
3 " ki nd ": " h ttp :// s ch em as . ogf . o rg / o c ci / mo ni to ri ng # c ol le ct or " ,
4 " m i xi ns ": [
5 " ht tp :// e xam pl e . co m / oc ci / mo ni to ri ng / m etr ic # C PU Pe r c e n t " ,
6 " ht tp :// e xam pl e . co m / oc ci / mo ni to ri ng / m etr ic # I sR ea ch ab le "
7 ],
8 " a tt ri bu te s ": {
9 " oc ci ": { " co ll ec to r ": { " pe r io d ": 3 } } ,
10 " com ": { " e xam pl e ": { " o cci ": { " m on it or in g " : {
11 " C PU Pe rc en t " : {" o u t ": " a "} ,
12 " I sR ea ch ab le " : { " h os tn am e ": "1 92 . 16 8. 5.2 " , " ma xd el ay ": 1000 , " out ": " b " }
13 } } } } } ,
14 " a cti on s ": [] ,
15 " t a rg et ":" s0 1 ",
16 " s o ur ce ":" g0 1 "
17 }
a web server that accepts the requests from the cloud
management server.
Figure 4: A simple example showing the monitoring of a
Resource by a Sensor.
3.3 The WebSocket
A WebSocket is opened on the sensor under request
of a thread that represents the resource-side edge of
the collector, and is used to transfer the monitoring
data.
A unique HTTP port is therefore shared by all the
resources connected to a given sensor: this signifi-
cantly improves the scalability of the Rocmon design.
3.4 What’s New in Rocmon
The design of the Rocmon monitoring infrastructure
copes with the issues that we have identified in Na-
gios with an architecture that is scalable, flexible and
open to the user. At the same time we consider Nagios
probes as a valuable legacy, and therefore we want to
be able to reuse them. Now we explain how the above
features are implemented.
The Rocmon design scales well, since it considers
a multiplicity of interconnected sensor components.
This opens the way to the application of distributed
Beyond Nagios - Design of a Cloud Monitoring System
367

techniques to manage large clouds: for instance hier-
archical layering of sensors, as shown in figure 3, and
monitoring domain splitting, as explained below.
The Rocmon design extends the flexibility of the
Nagios plugin approach to all aspects of monitoring:
namely, the processing of monitoring data and their
delivery. This is obtained by introducing two distin-
guished types of mixins that are specific for the sen-
sor. Using such mixins it is possible, for instance, to
aggregate a large stream to filter relevant data, to hide
sensitive data before passing over, to trigger actions
when certain patterns show up. All these functionali-
ties are provided under the control of the cloud man-
agement, although it is not excluded (per the OCCI
core standard) that the user implements and uploads
custom mixins.
Being plug-in oriented, the Rocmon design is
ready to reuse the plugin probes already implemented
for Nagios: the typical Nagios plugin has a clean SSL
oriented interface, which should be adapted to use the
HTTP API to control the plugin. Data delivery should
be converted to use the WebSocket interface instead
of the SSL. To meet security constraints, a practical
design uses the secure versions for the HTTP proto-
col and the WebSocket.
New sensors can be dynamically added to the in-
frastructure, since their activity can be associated to a
Virtual Machine (VM), and a given resource can mod-
ify the running probes with a POST request: there-
fore the monitoring activity can be dynamically mod-
ified in response to a change in the environment, like
a workload increment.
Such flexibility fosters the possibility to open to
the user the control of the monitoring activity. In case
the same infrastructure is used for administration and
user monitoring, a mechanism to allow user access to
a restricted number of mixins is a preliminary step on
this way, which can be obtained at the OCCI interface
level. More important is the ability to dynamically
instantiate new sensors according with user demand:
this is indeed possible since, as noted above, a sensor
can be implemented using a VM. The monitored re-
source will route distinct data towards the WebSocket
on the user sensor, and on a admin sensor, so to im-
plement distinct monitoring domains.
The Rocmon design can be approached also to
other OCCI-based monitoring systems. In (Ven-
ticinque et al., 2012) the authors sketch a prelim-
inary model for the specification and the monitor-
ing of a SLA. The proposal does not explore how
such model might be implemented in practice. In
(Mohamed et al., 2013) the authors layout a detailed
model for monitoring and reconfiguration of cloud re-
sources. The model is quite complex, and is specific
for a closed loop, with reconfiguration that follows
monitoring. Although the authors do not cover the
implementation of their model, it is conceivable that
the Rocmon system might contribute with the mon-
itoring part. In (Ciuffoletti, 2015a) we have shown
a basic Java implementation of our monitoring sys-
tem, based on TCP connections — instead of REST
interfaces and WebSockets — and without the mech-
anisms for resource creation.
4 A Rocmon PROTOTYPE
IMPLEMENTATION
To verify the feasibility and the complexity of the
above design we have implemented a prototype show-
ing its relevant features. An example that illustrates
an elementary deployment is in figure 4. Green cir-
cles represent HTTP ports: the user interacts with the
cloud manager with the OCCI API, the cloud man-
ager submits POST requests to the Sensor and the
Resource. The Resource opens a Web Socket (WS)
to the Sensor and sends raw monitoring data. The
Sensor delivers metrics to the user.
In our prototype we have only the essential oper-
ation of the OCCI API user interface on the upfront
server: we implement a PUT method, limited to the
request of a sensor, collector or compute entity. After
receiving such a request the OCCI server (labeled as
Cloud management in figure 4) either instantiates the
requested resource, or configures the requested link.
Since the implementation is oriented to experiments,
we have adopted the Docker technology, so that a sen-
sor or compute entity correspond to a Docker con-
tainer with the requested features. Since containers
have a light footprint, it is possible to assemble quite
complex experiments, depending on the capacity of
the physical host.
4.1 Software Structure
The prototype is implemented using the Ruby lan-
guage: the Sinatra framework is used for the HTTP
servers, together with the websocket-client-simple li-
brary for client-side WebSocket management. The
software of the sensor and of the compute contain-
ers is built around the Sinatra web server, and the im-
plementation of the POST method is the cornerstone.
The API methods on the compute and sensor Docker
are those listed in table 1 and 2.
The sensor container receives with the POST re-
quest the internal timing configuration and the lay-
out of the mixins: which of the available ones is
OCCI 2016 - Special Session on Experiences with OCCI
368

Listing 3: Code snippet: the run method of the Aggregator:EWMA mixin . Check table 1 for the identifiers.
1 def run ()
2 data =nil
3 begin
4 gain = @ ag g r e g a to r_ ha sh [: g ain ] # extracts the gain parameter
5 loop do
6 data = g et C h a n n el By Na me (" in s tr ea m " ). pop # waits from input from the instream channel
7 ou t pu t || = d a ta
8 ou t pu t = (( o u tpu t * ( g ain -1))+ da t a )/ g ain # computes the exponentially
9 # weighted moving average
10 data = g et C h a n n el By Na me (" ou ts t re am " ). pus h ( dat a ) # send data to the next stage through
11 # the outstream channel
12 end
13 rescue E xc ep t io n = > e
14 puts " Pr ob l em s dur ing the run of a p ub l is he r : #{ e. m es s ag e } "
15 puts e . b ac k tr ac e . i nsp ect
16 end
17 end
Listing 4: Code snippet: the dynamic load of a mixin type/name in Sensor’s code.
1 begin
2 re q ui re " ./ # { t ype }/ #{ nam e } " # the module is dynamically loaded using its
3 # name and type, as found in the OCCI
4 # description
5 pl u gi n = M odu le . co ns t_ g et ( na me ) # returns a constant which is an instance
6 # of a Class with the given name,
7 # i.e. the plugin class
8 puts " L a un ch #{ t ype } # { n a me } "
9 t= Th rea d . ne w { # instantiates in a new Thread
10 pl u gi n . new ( senso r , a ttr ibu t es , s y n cC ha nn el s ) . run # and runs the plugin in it
11 }
12 pl u gi ns [ nam e ]= t
13 rescue Exc ep t io n = > e
14 puts " P ro b le ms w ith . /#{ ty p e } /#{ na me }: #{ e . me ss a ge } "
15 end
used, and how they are interconnected. The con-
nection among internal mixins is implemented with
queues data structures, that are included in the na-
tive thread Ruby library: they implement thread-safe
FIFO queues and are intended for producer-consumer
communication patterns. The mixin hierarchy is im-
plemented using class inheritance: an abstract su-
perclass Aggregator implements the basic methods,
while the functionality of the mixin is described in
a subclass. The same happens for Publishers.
The concrete mixins typically contain a run
method that implements the core functionality of the
mixin: starting from loading the operational parame-
ters from the OCCI description, and proceeding with
a loop that iterates the read from input queues when
new data arrive, the processing of the data and its for-
warding to the output queues. See a commented code
snippet in Listing 3.
The loading of mixin code is dynamic, and uses
the reflection capabilities of the Ruby language. In
Listing 4 we show the code used for the dynamic load-
ing of the sensor mixins.
The GET method on the sensor is primarily used
to open the WebSocket that implements the sensor-
side edge of the collector: the operation of the Web-
Socket is described in Listing 5.
The other end of the collector is configured with
a POST on the resource that runs the probe: the op-
eration is similar to that of the POST method on the
sensor, and consists of the dynamic loading and in-
stantiation of probe threads. Each collector edge runs
in a thread, so that a resource can be the target of sev-
eral collectors.
Thanks to the Ruby expressive power, it turns out
that the code is extremely compact: a few tens of code
lines for each of the relevant threads. In the present
revision, the sensor application is implemented with
71 Ruby lines, the collector thread needs 37 lines, and
the collector edge 27.
The prototype is available on bitbucket (Ciuffo-
letti, 2015c). Follow the instructions to build the VMs
and run a minimal monitoring in a system similar to
the one in figure 4 that uses the OCCI descriptions in
table 1 and 2. The package contains a few mixins that
can be used for demo purposes. Thanks to its modular
structure, it is possible and easy to implement and ex-
periment new mixins and more complex topologies.
Beyond Nagios - Design of a Cloud Monitoring System
369

Listing 5: Code snippet: WebSocket operation in the sensor.
1 re q ue st . w e bs oc ke t do | w s | # the sensor processes the upgrade request
2 ws . o nop en do
3 p uts " C ol le c to r c on ne ct ed "
4 end
5 ws . o nm es s ag e do | msg | # a new message is received
6 h = JSO N . p a rse ( msg ) # parse the message
7 h . eac h do | chan n el , dat a | # process each <channel,data> pair ...
8 put s " de l iv er #{ da t a } to c ha n ne l #{ c ha nn e l } "
9 s y n c C h a n ne ls [: c ha n ne ls ][ ch an n el . t o _s ym ]. p ush ( d ata ) # ...and route the data
10 end
11 end
12 ws . o nc l os e do
13 p uts " C ol le c to r d i s c o n n e c te d "
14 end
15 end
5 CONCLUSIONS
The Nagios monitoring system is a powerful
tool that had a fundamental role in the man-
agement of scientific Grids, and it is presently
adopted by main cloud projects, like the EGI
http://www.egi.euhttp://www.egi.eu. However, its de-
sign is deeply influenced by the original utilization
in Grid infrastructures, and shows its limits when the
complexity of the system scales up to a federation of
cloud providers.
In this paper we start from a study of Nagios to
understand its limits, and proceed with the design
of a new monitoring architecture to overcome them.
Shortly, our proposal aims at a scalable monitor-
ing infrastructure, flexible to accommodate provider’s
needs, and open to accept user requests. At the same
time, we try to keep a conservative approach, consid-
ering that Nagios plugins are a valuable legacy that
should be, as far as possible, reused. From the Nagios
project we also inherit the attention for standards, and
a preference for simple and effective tools.
In this paper we present the basic concepts and a
prototype: in the future we aim at tests in challenging
use cases.
REFERENCES
Ciuffoletti, A. (2015a). Automated deployment of a
microservice-based monitoring infrastructure. In Pro-
ceedings of HOLACONF - Cloud Forward: From Dis-
tributed to Complete Computing, page 10.
Ciuffoletti, A. (2016c). Application level inter-
face for a cloud monitoring service. Com-
puter Standards and Interfaces, 46(2016),
http://dx.doi.org/10.1016/j.csi.2016.01.001.
Ciuffoletti, A. (2015c). Rocmon - OCCI com-
pliant monitoring system in Ruby. https://
augusto ciuffoletti@bitbucket.org/augusto ciuffoletti/
rocmon.git. (git repository).
Edmonds, A., Metsch, T., Papaspyrou, A., and Richardson,
A. (2012). Toward an open cloud standard. IEEE In-
ternet and Computing, 16(4):15–25.
Fielding, R. T. and Taylor, R. N. (2002). Principled design
of the modern web architecture. ACM Trans. Internet
Technol., 2(2):115–150.
Josephsen, D. (2007). Building a Monitoring Infrastructure
with Nagios. Prentice Hall PTR, Upper Saddle River,
NJ, USA.
Mell, P. and Grance, T. (2011). The NIST definition of
cloud computing. Technical Report Special Publica-
tion 800-145, US Department of Commerce.
Mohamed, M., Belaid, D., and Tata, S. (2013). Moni-
toring and reconfiguration for OCCI resources. In
Cloud Computing Technology and Science (Cloud-
Com), 2013 IEEE 5th International Conference on,
volume 1, pages 539–546.
OGF (2011). Open Cloud Computing Interface - Core.
Open Grid Forum. Available from www.ogf.org. A
revised version dated 2013 is available in the project
repository.
Tierney, B., Aydt, R., Gunter, D., Smith, W., Swany, M.,
Taylor, V., and Wolski, R. (2002). A grid monitoring
architecture. GWD-I (Informational).
Venticinque, S., Amato, A., and Martino, B. D. (2012). An
OCCI compliant interface for IaaS provisioning and
monitoring. In Leymann, F., Ivanov, I., van Sinderen,
M., and Shan, T., editors, CLOSER, pages 163–166.
SciTePress.
Wolski, R., Spring, N. T., and Hayes, J. (1999). The net-
work weather service: A distributed resource perfor-
mance forecasting service for metacomputing. Future
Gener. Comput. Syst., 15(5-6):757–768.
OCCI 2016 - Special Session on Experiences with OCCI
370
