
Investigating the Use of High Resolution Multi-spectral Satellite Imagery
for Crop Mapping in Nigeria
Crop and Landuse Classification using WorldView-3 High Resolution
Multispectral Imagery and LANDSAT8 Data
Tunrayo Alabi, Michael Haertel
and Sarah Chiejile
Geospatial Laboratory, International Instititute of Tropical Agriculture (IITA),
PMB 5320, Oyo Road, 200001 Ibadan, Nigeria
Keywords: Crop Mapping, WorldView-3, LANDSAT8, Cassava, Maize, Nigeria, Land Cover Classification,
Maximum Likelihood, Neural Network, Support Vector Machine.
Abstract: Imagery from recently launched high spatial resolution WorldView-3 offers new opportunities for crop
identification and landcover assessment. Multispectral WorldView-3 at 1.6m spatial resolution and
LANDSAT8 images covering an extent of 100Km² in humid ecology of Nigeria were used for crop and
landcover identification. Three supervised classification techniques (maximum likelihood(MLC), Neural
Net clasifier(NNC) and support vector machine(SVM)) were used to classify WorldView-3 and
LANDSAT8 into four crop classes and seven non-crop classes. For accuracy assessment, kappa coefficient,
producer and user accuracies were used to evaluate the performance of all three supervised classifiers. NNC
performed best with an overall accuracy(OA) of 92.20, kappa coefficient(KC) of 0.83 in landcover
identification using WorldView-3. This was closely followed by SVM with an OA of 91.77%, KC of 0.83.
MLC performed slightly lower at an OA of 91.25% and KC of 0.82. Classification of crops and landcover
with LANDSAT8 was best with MLC classifier with an OA of 92.12% , KC of 0.89. Cassava at younger
than 3 months old could not be identified correctly by all classifiers using WorldView-3 and LANDSAT8
products. In summary WorldView-3 and LANDSAT8 data had satisfactory performance in identifying
different crop and landcover types though at varying degrees of accuracies.
1 INTRODUCTION
Agriculture is crucial to man’s livelihood as the
major source of food. Feeding the growing human
population which is expected to reach more than 9
billion by 2050 could pose a serious challenge in the
midst of the uncertainties and complexities of the
predicted future climate. There will be need to
constantly boost agriculture production in a
sustainable and efficient way (Foley et al., 2011). To
achieve this, dependable, accurate and
comprehensive agricultural intelligence on crop
production is imperative. Agricultural production
monitoring can support decision-making and
prioritization efforts towards ameliorating
vulnerable parts of agricultural systems. The value
of satellite Earth observation data in agricultural
monitoring is well recognized (Low and Duveiller,
2014) and a variety of methods have been developed
in the last decades to provide agricultural production
related statistics (Carfagna and Gallego, 2005)
Remotely sensed data from satellite platforms
such as LANDSAT and SPOT have been used to
inventory a wide variety of earth resources,
including agricultural land and crops. The synoptic
overview provided by these satellite systems at
regular intervals has allowed farmers and
agricultural scientists to obtain information
concerning the condition of crops grown over a large
area. Satellite imagery has been used for crop
species identification and area estimation since
1970s. Much research has been carried out in the use
of LANDSAT MSS and TM data to estimate and
identify crops. Various authors have found out that
within some reasonable limits of accuracy, crops can
be identified in LANDSAT MSS, TM/ETM (Xavier
et al., 2005; Yang et al, 2007) or SPOT imagery
(Hanna et al., 2004; Xavier et al., 2005).
Alabi, T., Haertel, M. and Chiejile, S.
Investigating the Use of High Resolution Multi-spectral Satellite Imagery for Crop Mapping in Nigeria - Crop and Landuse Classification using WorldView-3 High Resolution Multispectral
Imagery and LANDSAT8 Data.
In Proceedings of the 2nd International Conference on Geographical Information Systems Theory, Applications and Management (GISTAM 2016), pages 109-120
ISBN: 978-989-758-188-5
Copyright
c
2016 by SCITEPRESS – Science and Technology Publications, Lda. All rights reserved
109

Many researchers have reported the use of multi-
temporal imagery within a given year to map
agricultural crops (Brewster et al., 1999) which has
tremendous advantages. However, in tropical
environment, cloud cover can limit this approach.
Classifying remotely sensed data remains a
challenge because many factors, such as the
complexity of the landscape in a study area, selected
remotely sensed data, and image-processing and
classification approaches, may affect the success of
a classification. Major limitations on crop
identification with satellite imagery relate to the
similarity of plant reflectance of different crops in
the available spectral bands, field-to-field variability
of plant reflectance of the same crops, the particular
combination of crops grown in a given region, the
pattern of individual crop phenology, spatial and
spectral variability within fields (Buechel et al.,
1989; Vassilev, 2013; Yang et al., 2007).
Moreover agricultural field in Africa are often
small in size and very often many different plant
species are found in a very small area (always the
case if they are intercropped) which makes the
homogeneous crop identification process rather
difficult with coarse resolution satellite imagery
(Campbell, 1996).
Advancements in digital image processing and
geographic information systems (GIS) have
increased the potential for deriving more accurate
crop information from satellite imagery (Ehrlich et
al., 1994; Rodrıguez et al., 2006).
High resolution satellite imagery offers more
opportunity in crop identification. From 1999 when
IKONOS was launched, several other High
resolution satellites such as Quick Bird,
WorldVIEW 1, 2 and 3 or Pleaides followed. The
competition between these multi spectral platforms
led to decreasing prices per km² with resolutions up
to 30 cm per pixel.
Various researchers have evaluated the use of
these modern satellite products for land cover types,
crop classification in diverse regions of the world
(Ozdarici-Ok et al., 2015; Srestasathiern and
Rakwatin, 2014; Yang et al., 2007) but the use of
these products for crop identification in humid
regions like Nigeria and other tropical areas in West
Africa has not been well documented.
Hence the objective of this study is to evaluate
satellite images captured by the newly launched
WorldView-3 sensor for crop identification and land
cover classification in Nigeria as well as the use of
LANDSAT8 OLI for landcover and cropland
mapping.
2 STUDY AREA
The study location is the Ore Agricultural Village in
Ondo state, Nigeria. The Agriculture village is
dedicated to crop farming and animal husbandry and
is situated on a 3000-hectare facility. The Ondo
State Agricultural Village at Ore was created and
started operation in 2011 as a tool for empowering
the youth, the women and adults through agriculture
and represents one of three integrated Agricultural
villages established in the state that have been
established in order to reduce unemployment among
the younger population.
Participants at the village are drawn from young
graduates who have just completed their Higher
National Diploma and Bachelor degree and who are
willing to take up agriculture as a career.
The natural vegetation of the site is tropical
rainforest characterized by pockets of secondary
forest and fallow regrowth. The area is characterized
by a length of growing period of more than 270 days
with humid forest ecology. The annual mean
maximum temperature at the site is 31.5 °C while
the minimum is 22.1°C. Mean annual rainfall is
about 2067 mm. Rainfall starts around March and
continues till middle of November. The topography
of the land varies from nearly flat to moderately high
slope. Mean elevation in the farm land is about 132
m above sea level with a mean slope of 8.7%.
Nearly 25% of the study area has slope greater than
12%. Major soil type of the farm is Ferric Lixisols
(Sonneveld, 2005). Soil texture is coarse loamy
sand, imperfectly or poorly drained.
During the late season of 2014, Cassava and
Maize were the major crops planted on the fields
within the target area. Cassava (Manihot esculenta)
is a perennial woody shrub with an edible root which
grows in tropical and subtropical areas of the world.
Cassava is the third largest source of food
carbohydrates in the tropics, after rice and maize
(Fauquet and Fargette, 1990). Cassava is a major
staple food in the developing world, providing a
basic diet for over half a billion people (It is one of
the most drought-tolerant crops, capable of growing
on marginal soils. Nigeria is the world's largest
producer of cassava, while Thailand is the largest
exporter of dried cassava.
In 2014, cassava and maize were planted during
the late season of August through November.
Specifically, the first batch of cassava was planted
on September 10
th
and the second was planted on
November 13
th
at end of rainy season. The total area
of cassava planted was 219 Ha. Apart from the
young cassava planted, matured cassava plots of
GISTAM 2016 - 2nd International Conference on Geographical Information Systems Theory, Applications and Management
110
between 12-15 months old were also found in the
study area, often mixed with weeds. These matured
cassava farms with weeds represent typical plots in
West Africa. Farmers stop weeding their cassava
field once they reach 5-6 months. During ground
truth field visit several of such plots have been
observed from which a few of them have been
selected to serve as a training site for the
classification process to be able to classify such
ready for harvest cassava fields.
Maize was planted for late season from August
25
th
through September 30
th
. The total area of maize
was 100 ha. Other non-crop land cover types were
also classified. Such includes primary forest,
degraded forest, roads, and rivers, mixed
fallow/shrubby grassland and bare ground.
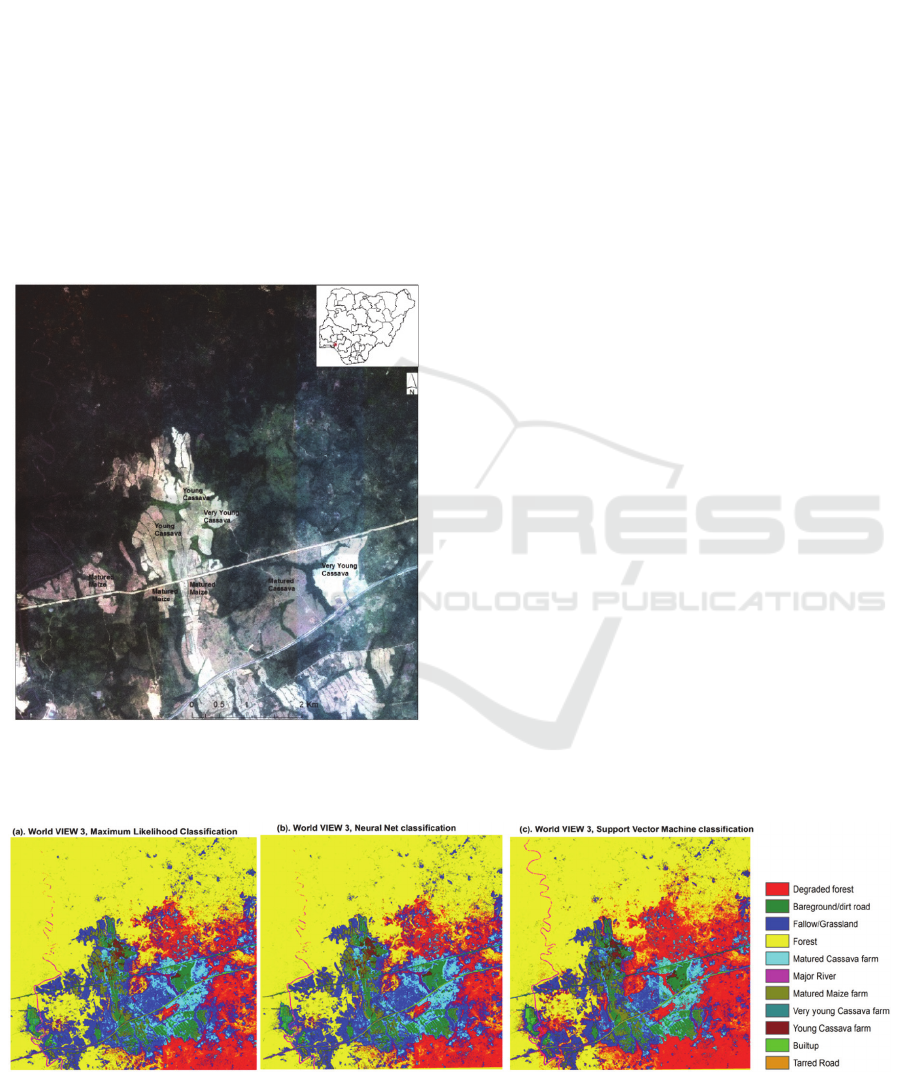
Figure 1: Study area showing WorldView-3 natural colour
image acquired January 3rd, 2015.
3 SATELLITE IMAGERY
3.1 WorldView-3
WorldView-3 was launched on 13th August, 2014 in
California. It is the first multi-payload, super-
spectral, high-resolution commercial satellite
featuring 16 multispectral bands (eight in visible and
NIR spectrum and eight in the SWIR spectrum).
Operating at an altitude of 617 km, WorldView-3
provides 31 cm panchromatic resolution, 1.24 m
multispectral resolution, 3.7 m short-wave infrared
resolution, and 30 m CAVIS resolution.
WorldView-3 has an average revisit time of <1 day
(1m GSD) and is capable of collecting up to 680,000
km- per day.
A new tasking order for WorldView-3 image
was placed at around October 2014 covering an
extent of 100 km² which is the minimum extent for a
tasking order from Digital Globe Inc. (Longmont,
Colorado). Only the first eight multispectral bands
of the WorldView-3 were purchased. The SWIR
bands were not available for purchase at the time of
order. Due to much cloud cover in the region, we
could only obtain cloud free image on January 3,
2015. The geographic coordinates at the center of
the area are (Longitude 4.7922047°E, Latitude
6.731706° N). The spatial resolution of the imagery
was 1.24 m and the dynamic range of the data was
16 bits. Prior to delivery, the imagery was
radiometrically and geometrically corrected and
rectified to the world geodetic survey 1984
(WGS84) datum and the universal transverse
Mercator (UTM) coordinate system of Zone 31N.
Figure 2: Classification results of WorldView-3 (a) Maximum Likelihood, (b) Neural Net and (c) Support Vector Machine.
Investigating the Use of High Resolution Multi-spectral Satellite Imagery for Crop Mapping in Nigeria - Crop and Landuse Classification
using WorldView-3 High Resolution Multispectral Imagery and LANDSAT8 Data
111

Table 1: Specifications of eight multispectral and panchromatic bands of World-View 3 sensor.
Specifications Multispectral sensor Panchromatic sensor
Spatial resolution 1.24 (m) 40 cm
Radiometry 16 bits 16 bits
Spectral bands
1. Coastal Blue (400 to 450 nm)
2. Blue (450 to 510 nm)
3. Green (510 to 580 nm)
4. Yellow (585 to 625 nm)
5. Red (630 to 690 nm)
6. Red-Edge (705 to 745 nm)
7. NIR1 (770 to 895 nm)
8. NIR2 (860 to 1040 nm)
(450 to 800 nm)
3.2 LANDSAT8 Data
LANDSAT program of the United States of America
is the longest running enterprise for acquisition of
satellite imagery of Earth. On July 23, 1972 “the
Earth Resources Technology Satellite” was
launched. This was eventually renamed to
LANDSAT. The most recent, LANDSAT8 was
launched on February 11, 2013 which provided
continuity in LANDSAT earth observation mission
(Lulla et al., 2013). The LANDSAT8 orbits our
planet every 99 min, covering the entire earth every
16 days except for the highest polar latitudes.
LANDSAT8 follows a sun-synchronous orbit at an
average altitude of 705 km and 98.2° inclination (Jia
et al., 2014)
The data quality (signal-to-noise ratio) and
radiometric quantization (12-bits) of the
LANDSAT8 Operational Land Imager (OLI) and
Thermal Infrared Sensor (TIRS) are higher than
previous LANDSAT instruments (8-bit for TM and
ETM+). The OLI sensor aboard LANDSAT8 has
nine bands for capturing the spectral response of the
earth's surface at discrete wavelengths along the
electromagnetic spectrum. Additionally, the TIRS
sensor aboard LANDSAT8 collects information at
two discrete wavelengths within the thermal infrared
portion of the electromagnetic spectrum. These
wavelengths have been chosen carefully based on
years of scientific research. For the study area, cloud
free LANDSAT8 images with path/row: 190/55
acquired on December 14, 2014 and January 15,
2015 was downloaded from the “earth explorer”
website (http://earthexplorer.usgs.gov/).
4 METHODS OF IMAGE
CLASSIFICATION
As an image analysis software EXELIS ENVI 5.2
was used to classify both satellite images. Many
different supervised classification techniques are
available in ENVI 5.2 including minimum distance,
Mahalanobis distance, maximum likelihood, neural
networks, and support vector machine. Maximum
likelihood is probably the most commonly used
classifier even though other classifiers may offer
advantages for some applications. In this study the
following algorithms are explored: Maximum
likelihood (MLC), Support Vector Machine (SVM)
and Neural Network (NNC) due to their high
performance reported in literature (Foody & Mather,
2004, Pal and Mather, 2005, Omkar et al, 2008).
The Maximum Likelihood Classifier (MLC) is
a well-known parametric statistical classifier and is
widely used for pattern classification (Duda and
Hart., 1973). A normal distribution is assumed for
the input data which include two parameters - mean
vectors and covariance matrices of the class
distributions are estimated and used in the
discriminant functions. MLC is generally accepted
as a standard against which the performance of other
classification algorithms is compared with (Omkar
et al, 2008).
Support Vector Machine (SVM) is a supervised
classification method derived from statistical
learning theory that often yields good classification
results from complex and noisy data. It separates the
classes with a decision surface that maximizes the
margin between the classes. The surface is often
called the optimal hyperplane, and the data points
closest to the hyperplane are called support vectors.
The support vectors are the critical elements of the
training set (Vapnik, 1979; Zhu and Blumberg,
2002). SVM can be adapted to become a nonlinear
classifier through the use of nonlinear kernels. While
SVM is a binary classifier in its simplest form, it can
function as a multiclass classifier by combining
several binary SVM classifiers (creating a binary
classifier for each possible pair of classes). ENVI’s
implementation of SVM uses the pairwise
GISTAM 2016 - 2nd International Conference on Geographical Information Systems Theory, Applications and Management
112

classification strategy for multiclass classification.
SVM has been shown to also work well for crop
classification (Foody and Mather, 2004; Pal and
Mather, 2005; Jia et al., 2014)
Artificial Neural Networks (ANNs) were
originally designed as pattern-recognition and data
analysis tools that mimic the neural storage and
analytical operations of the brain. ANN approaches
have a distinct advantage over statistical
classification methods in that they are non-
parametric and require little or no a priori
knowledge of the distribution model of input data.
Additional superior advantages of ANNs include
parallel computation, the ability to estimate the non-
linear relationship between the input data and
desired outputs, and fast generalization capability.
Many previous studies on the classification of
multispectral images have confirmed that ANNs
perform better than traditional classification methods
in terms of classification accuracy, such as
maximum likelihood classifiers (Yuan et al. 2009).
More detailed discussion on ANNs can be found in
Lippmann, 1987 and Richards and Jia 2006. In a
recent work Sandoval et al. 2014 used ANNs to
perform crop classification and obtained satisfactory
results.
4.1 Supervised Classification
Ground truth field visit was conducted on 4
February, 2015 from which georeferenced photos of
each crop and landcover type were collected. These
photos were used for developing training sites for
each crop or cover type class. Eleven cover types
were identified: Matured maize class consisted of
maize at full maturity by 3 January 2015 when
WorldView-3 image was taken, though a few of
them would still maintain some green colour by
December 14, 2014 when the first LANDSAT8 data
was acquired. Young cassava class are 3 month old
cassava by January 3, 2015 when WorldView-3
image was taken. Very young cassava class
consisted of cassava planted in the first and second
week of November, 2014 and were just one and half
month old by January 2015. This class consists more
of bare ground. Matured cassava class consisted of
those that were observed on the field planted over a
year before January 2015. This class shows typical
matured cassava fields mixed with weeds, shrubs
and trees. Other land cover types identified on the
land are: Degraded Forest, Primary Forest,
Fallow/grassland, Built up, Major River, Bare
ground/dirt road and Tarred road.
Supervised training sites were created using
online digitizing in ArcGIS 10.3 on known crops or
cover types with the aid of ground truth geotagged
photos.
Training samples were created proportional in
size and number to each land cover type extent.
Supervised classification using Maximum
likelihood algorithms in ENVI 5.2 with default
parameters; probability threshold set to none and
data scale factor of 1 was used to classify the eight
multispectral bands of WorldView-3 and
LANDSAT8 OLI into the eleven classes. Coastal
blue band was removed initially to see whether its
exclusion will improve accuracy of classification,
but it was found that using all bands gave a slightly
higher accuracy using confusion matrix tool
accuracy assessment. Hence eight bands were used
for WorldView-3. A similar procedure was followed
for LANDSAT8 classification. Coastal aerosol band
1 and Cirrus band 9 were removed from supervised
classification after the method of Jia et al., 2014, but
it was found that the accuracy dropped slightly when
these bands were removed. Hence all the
multispectral bands (bands 1-7, 9) of LANDSAT8
OLI data were used in the classification except the
thermal bands (TIRS 1&2).
Neural Net classifier in ENVI 5.2 was used to
apply a multi-layered feed-forward neural network
classification. An eleven layer multi-layered Neural
Network has been used for this eight-class satellite
image classification problem. The input layer
consists of eight neurons representing the eight
bands of the multi-spectral data. The output layer
has eleven neurons, representing the eleven crop and
cover type classes. For this study, we used only a
single hidden layer perceptron network based
classifier, with eight neurons in the hidden layer.
ENVI implementation of Neural Net allows
choosing between a logistic or hyperbolic activation
function. A logistic activation function was selected
due to its superior performance over the hyperbolic
function. There are four important parameters that
need to be set; namely training threshold
contribution, training rate, training momentum and
RMS exit criteria. By a process of iteration to
optimize these parameters, default values set by
ENVI were found to give best results except for
training threshold contribution that gave best
performance when it was set to 0.65. These values
were employed for classification for WorldView-3
and LANDSAT8.
Support Vector Machine (SVM) is a supervised
classification method derived from statistical
learning theory that often yields good classification
results from complex and noisy data (Pal and Foody,
Investigating the Use of High Resolution Multi-spectral Satellite Imagery for Crop Mapping in Nigeria - Crop and Landuse Classification
using WorldView-3 High Resolution Multispectral Imagery and LANDSAT8 Data
113

2012, Jia et al., 2014). It separates the classes with a
decision surface that maximizes the margin between
the classes. The surface is often called the optimal
hyperplane, and the data points closest to the
hyperplane are called support vectors. The support
vectors are the critical elements of the training set.
SVM can be adapted to become a nonlinear
classifier through the use of nonlinear kernels. The
radial basis function Kernel (RBF) is the default in
ENVI. This has been found to give the best results
by many authors (Hsu et al., 2010, Jia et al., 2013).
The RBF kernel non-linearly mapped samples into a
higher dimensional space so the RBF could handle
the case when the relationship between class types
and attributes was not linear. Second, the RBF
kernel had fewer numerical computational
difficulties. The penalty value C and kernel
parameter γ were the two parameters used for the
RBF kernels, set to default values of 100 and 0.125
respectively as a result of our iteration process to
optimize them.
5 RESULT AND DISCUSSION
Figure 2 presents the results of the three algorithms
in classifying the crops and land cover types in the
study area. Clearly, forest and degraded forest land
cover types dominate the entire area. Primary forest
occurred mainly in the northern and western part of
the land while degraded forest existed mainly in the
south eastern part of the land. Fallow/grassland
appeared to be third largest among the land cover
type and it spread mainly around the cropped area.
Generally all three supervised classification
techniques seem to agree in discriminating the land
cover types in the area by visual interpretation of
figure 2(a)-2(c). A closer view of the classification
result is presented in Figure 3 (a-k). Figure 3a-d
presents a natural colour image of WorldView-3
image taken on January 3, 2015 and the
classification results of all three algorithms of an
area planted with young cassava and very young
cassava. Clearly all three classifiers were able to
discriminate young cassava class better than they did
very young cassava. Very young cassava category
was mainly confused with the bare ground/dirt road
class expectedly since this class had little vegetation
cover. This result implies that WorldView-3
multispectral products can identify cassava when it
is above 3 months old.
Although the three classification techniques were
able to distinguish from other land cover types such
as degraded forest and forest, they could not clearly
discriminate them from fallow/grassland. This is
probably due to spectral similarities between
fallow/grassland and matured cassava category
which are mainly mixtures of perennial shrubs and
weeds. LANDSAT8 OLI classification results of the
same matured cassava area present a better
performance (Figure 3i-k). With LANDSAT8, the
coarser spatial resolution smoothed out the noisy
pixels and produced more realistic results from the
three classifiers for the matured cassava farm area.
This result is similar to what Yang et al, 2007
obtained while they aggregated Quick Bird imagery
of spatial resolution of 2.8m to 11.2, 19.6 and 30m
from 2.8m to 11.2 m and 19.6 pixel sizes improved
overall classification accuracy in crop identification
in South Texas. LANDSAT8 of 30 m pixel size
identified matured cassava farm more realistically
than WorldView-3 at 1.6m spatial resolution.
0 to 0 present the accuracy assessment confusion
matrix for WorldView-3 image classification by
Maximum likelihood classifier (MLC), Neural Net
Classifier (NNC) and Support vector Machine
classifier (SVM). Overall accuracy of the three
classifiers are higher than 90 % with NNC having
the highest accuracy of 92% followed by MLC. The
kappa coefficients are equally high, greater than 0.81
for all three classifiers, though NNC still had the
highest at 0.833. The high kappa coefficients
indicate that all three classifiers performed at over
80% better than if the pixels have been randomly
assigned.
The producer’s accuracy is a measure of
omission error and it indicates the probability that
pixels that belong to the ground truth class and the
classification technique has failed to classify them
into the proper class. This ranged from 44.6% to
99.8% for MLC, 7.3% to 99.6% for NNC and for
SVM 12.3% to 99.3%. The lowest producer’s
accuracy occurred for the very young cassava
category for all the three classifiers indicating the
most difficult class to identify is the very young
cassava, although MLC performed best in
classifying this category at about 45% accuracy. The
highest confusion with this class came from young
cassava category and followed by matured maize for
MLC while it was confused mostly with matured
maize and bare ground classes for NNC. SVM
confused this class with bare ground class mostly
and closely followed by matured maize.
This is not unexpected since this class has a lot
of bare ground in the class due to sparse vegetation
of cassava at this stage of less than 2 months old.
Confusion with matured maize is probably due to
the fact that some of the matured maize plots
GISTAM 2016 - 2nd International Conference on Geographical Information Systems Theory, Applications and Management
114
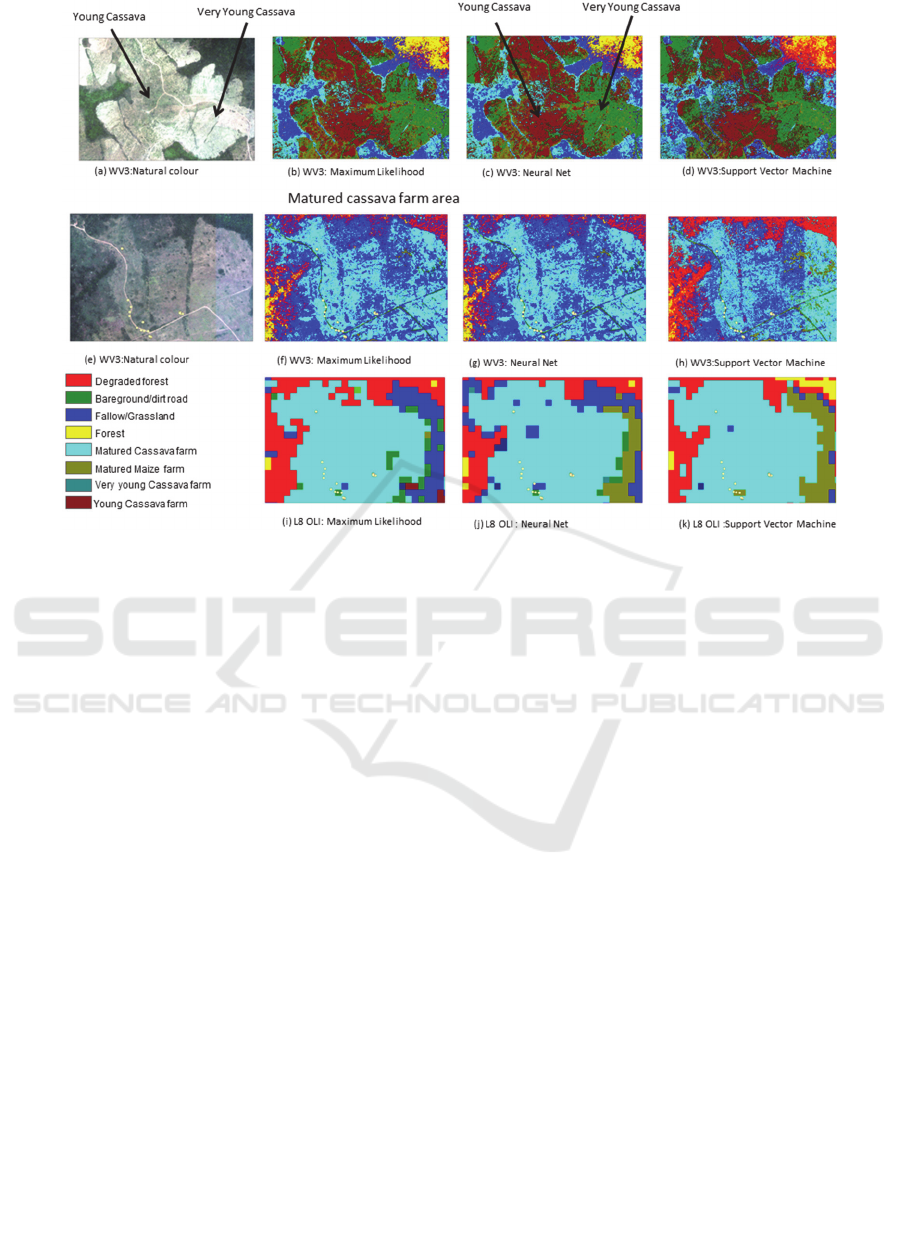
Figure 3: (a) WorldView-3 natural colour image taken January 3, 2015, (b) Maximum Likelihood, (c) Neural Net, (d)
Support vector machine classification of an area of young cassava and very young cassava. (e) WorldView-3 natural colour
image, (f) Maximum Likelihood, (g) Neural Net, (h) Support vector machine classification of a matured cassava farm area.
(i) Maximum likelihood, (j) Neural Net and (k) support vector machine of the same matured cassava farm area using
LANDSAT8, OLI captured on January 15 2015.
have been harvested at the time of image capture
exposing more bare ground in these plots. From
Table 2-4, it is also clear that the three classifiers
identified the Forest, Built up, Major River and
Tarred roads categories correctly at a producer’s
accuracy of higher than 97% implying that the
probability of using WorldView-3, 8- band
multispectral image to identify those classes are
above 95%. A similar look at the user’s accuracy,
which is a measure of commission error and
indicative of the probability that a category
classified on the map actually represents that on the
ground reveals that it ranged from 35 to 100% for
MLC, 64 to 100% for NNC and 44 to 100% for
SVM. Clearly four of the eleven land cover
categories (Forest, Major River, Tarred Road and
Built up) were the easiest to identify with both user’s
and producer’s accuracy higher than 95% for all the
three classifier algorithms. The low producer’s
accuracy and user accuracies for the three cassava
categories (very young cassava, young cassava and
matured cassava) suggests that cassava crop is the
most difficult to differentiate among the eleven
landcover categories. The very young cassava and
young cassava were mostly confused with bare
ground, matured maize and fallow/grassland by the
3 algorithms although MLC produced least
confusion. Young cassava as well was often
confused with bare ground and matured maize. This
is because these two cassava crop categories have
significant bare ground exposure. The matured
cassava category was confused mainly with
degraded forest and Fallow/grassland under MLC
classifier, while it was mainly confused with
Fallow/grassland for NNC and SVM classifiers.
Spectral similarity between matured cassava and
fallow/grassland is expected since both consist of
shrubby vegetation and grasses. Most of the matured
cassava plots were also mixtures of weeds and
cassava which is a shrubby crop. This is the normal
practice in West Africa where weeds in cassava
farms of over 10 months are no longer controlled
since the farmers know the weeds competition with
cassava at this stage is very negligible.
MLC correctly identified matured cassava at a
producer accuracy of 83% whereas only 63% of
those pixels called matured cassava on the map are
actually matured cassava on the ground. Similarly
NNC identified this class at producer accuracy of
70% with a user accuracy of 67%, while SVM
Investigating the Use of High Resolution Multi-spectral Satellite Imagery for Crop Mapping in Nigeria - Crop and Landuse Classification
using WorldView-3 High Resolution Multispectral Imagery and LANDSAT8 Data
115

Table 2: Confusion matrixes for crop and landcover classification of the WorldView-3 using the Maximum Likelihood
classifier.
Class
category
Degraded
forest
Bare
ground/
dirt road
Fallow/
Grassland
Forest
Matured
Cassava
Major
River
Matured
Maize
Very
young
Cassava
Young
Cassava
Built up
Tarred
Road
Total
User
accuracy
(%)
Degraded
forest
14,205 2 1,683 2,191 1,379 8 0 0 1 0 0 19,469
73.
0
Bare
ground
/dirt road
132 5,829 110 0 53 3 269 288 254 9 0 6,947
83.
9
Fallow/
Grassland
387 138 10,512 1,860 1,239 46 365 336 28 3 0 14,914
70.
5
Forest 33 0 173 225,812 214 26 0 2 0 0 0 226,260
99.
8
Matured
Cassava
426 256 8,012 39 15,261 0 81 28 11 0 0 24,114
63.3
Major
River
0 0 0 0 0 4,858 0 0 0 0 1 4,859
100.
0
Matured
Maize
0 227 2,205 4 225 1 10,667 498 179 0 0 14,006
76.2
Very
young
Cassava
1 404 781 846 36 0 617 1,574 162 0 0 4,421
35.
6
Young
Cassava
6 504 82 6 85 0 481 694 1,968 1 0 3,827
51.
4
Built up 0 0 0 0 0 0 0 0 0 1,803 1 1,804
99.
9
Tarred
Road
0 0 0 0 0 0 0 0 0 7 826 833
99.2
Total 15,190 7,360 23,558 230,758 18,492 4,942 12,480 3,420 2,603 1,823 828 321,454
Producer
accuracy
(%)
93.
5
79.2 44.
6
97.9 82.
5
98.3 85.
5
46.
0
75.
6
98.9 99.
8
Overall accuracy = 91.25% Kappa coefficient = 0.8182
identified this with a producer accuracy of 62% and
user accuracy of 64%. While MLC classifier
confused matured cassava with degraded forest and
Fallow/Grassland, both NNC and SVM confused
matured cassava with Fallow/grassland category.
These results imply that only between 40-50% of the
places classified as matured cassava is truly matured
cassava on the ground. Spectral similarity between
matured cassava and fallow/grassland is expected
since both are perennial mixtures of shrubs and
grasses. Our results in identifying matured cassava is
similar to what Yang et al 2007 obtained in using
Quick Bird imagery to classify grain sorghum and
Sugar cane in South Texas, USA. They also
observed that high commission errors with sugar
cane and cotton were due to mixtures with
herbaceous species. The producer accuracy for
matured maize ranged between 82 -85% while the
user accuracy ranged between 74 to 76% for the
three classifiers with MLC giving the best accuracy.
These accuracies are slightly higher than those
obtained for the matured cassava category. The
commission and omission errors with matured maize
category are mainly from fallow/grassland and bare
ground/dirt road for both NNC and SVM classifiers
while the confusions came from very young cassava
and young cassava categories under MLC classifiers.
These observations confirm the assertion of Murmu
and Biswas 2015 that classification of crops is a
complex activity which includes complexity of the
landscape, selected remotely sensed data, and
image-processing and classification approaches. 0
and 0 present the classification accuracy of the three
classifiers using two LANDSAT8 Operation Land
imager (OLI) scenes taken December 14, 2014 and
January 15, 2015. The overall accuracies for both
LANDSAT8 scenes ranged from 82 - 94%. For both
LANDSAT8 dates, MLC performed best with 95%
and 92% overall accuracies for December 14, 2014
and January 15, 2015 images respectively. The
overall performance of SVM and NNC was close in
both image scenes though SVM was always in the
lead. The kappa coefficients for the two
LANDSAT8 images were also high ranging from
0.72 to 0.92. Comparing overall accuracies and
kappa coefficients between classifications based on
WorldView-3 and LANDSAT8, it is clear from
Tables 4-8 that the general accuracies suggest that
both image products are useful in classifying crops
and landcover types in the humid ecology of the
south western Nigeria.
GISTAM 2016 - 2nd International Conference on Geographical Information Systems Theory, Applications and Management
116

Table 3: Confusion matrixes for land cover classification of the WorldView-3 using the Neural Net classifier.
Category
Degraded
forest
Bare
ground/
dirt road
Fallow/
Grassland
Forest
Matured
Cassava
Major
River
Matured
Maize
Very
young
Cassava
Young
Cassava
Built
up
Tarred
Road
Total
User
accuracy
(%)
Degraded
forest
11,622 0 69 107 97 0 0 0 0 0 0 11,895
97.7
Bare
ground
/dirt road
0 5,922 17 0 7 0 612 880 813 2 0 8,253
71.76
Fallow/
Grassland
1,818 155 16,830 756 5,032 45 1,309 394 27 0 0 26,366
63.83
Forest 1,098 0 761 229,879 351 23 0 28 0 0 0 232,140
99.03
Matured
Cassava
642 378 4,913 4 12,922 0 236 86 58 0 0 19,239
67.17
Major
River
4 0 0 0 0 4,872 0 0 0 0 0 4,876
99.92
Matured
Maize
0 790 953 10 70 2 10,239 1,327 464 0 0 13,855
73.9
Very
young
Cassava
4 28 12 2 7 0 39 250 27 3 0 372
67.2
Young
Cassava
2 87 3 0 4 0 45 455 1,214 0 0 1810
67.07
Built up 0 0 0 0 2 0 0 0 0 1,811 21 1834
98.75
Tarred
Road
0000000007807814
99.14
Total 15,190 7,360 23,558 230,758 18,492 4,942 12,480 3,420 2,603 1,823 828 321,454
Producer
accuracy
(%)
76.51 80.46 71.44 99.62 69.88 98.58 82.04 7.31 46.64 99.34 97.46
Overall Accuracy = 92.196 Kappa coefficient = 0.833
Table 4: Confusion matrixes for land cover classification of the WorldView-3 using Support Vector Machine classifier.
Landcover
category
Degraded
forest
Bare
ground/
dirtroad
Fallow/
Grassland
Forest
Matured
Cassava
Major
River
Matured
Maize
Very
young
Cassava
Young
Cassava
Builtup
Tarred
Road
Total
User
accuracy
(%)
Degraded
forest
13,471 2 859 920 702 1 0 400 0 15,959
84.4
Bare ground/
dirtroad
1 5,814 14 0 9 0 705 1,042 803 4 3 8,395
69.3
Fallow/
Grassland
652 110 15,763 707 5,934 25 1,216 456 40 0 0 24,903
63.3
Forest 350 0 546 229,096 229 6 0 500 0 230,232 99.5
Matured
Cassava
709 337 5,144 23 11,436 0 66 66 32 0 0 17,813
64.2
MajorRiver 3 0 4 0 0 4,909 0 000 1 4,917 99.8
Matured
Maize
0 824 1,202 12 154 1 10,310 968 371 2 0 13,844
74.5
Veryyoung
Cassava
1 217 12 0 4 0 119 420 187 00960
43.8
Young
Cassava
356 14 024064459 1,170 1 0 1,791
65.3
Builtup 00 00000001,796 18 1,814 99.0
TarredRoad 00 000000020 806 826 97.6
Total 15,190 7,360 23,558 230,758 18,492 4,942 12,480 3,420 2,603 1,823 828 321,454
Producer
accuracy(%)
88.7 79.0 66.9 99.3 61.8 99.3 82.6 12.3 45.0 98.5 97.3
OverallAccuracy=91.7677% Kappacoefficient=0.8256
However, a detailed look at the results reveals
also that the different crops and land cover types
were classified at varying degrees of accuracies.
Producer and user accuracies for the following land
Investigating the Use of High Resolution Multi-spectral Satellite Imagery for Crop Mapping in Nigeria - Crop and Landuse Classification
using WorldView-3 High Resolution Multispectral Imagery and LANDSAT8 Data
117
cover types; Forest, Major River, Tarred Road and
Built up; were always very high greater than 90%
for all the three classifiers for both LANDSAT8 and
WorldView-3 multi-spectral products indicating the
usefulness of this products in identifying them. On
the other hand, the producer and user accuracy for
the crop classes are always lower. Cassava classes
were identified at different levels of accuracy by all
classification techniques. The producer and user
accuracy for matured cassava under MLC classifier
was 88% and 81% respectively indicating that 88%
of the matured cassava area were correctly identified
and that 81% of those classified as matured cassava
in the classification map are actually matured
cassava on the ground. Hence we define the ground
accuracy as the product of producer and user
accuracy because this is true percentage of pixels
that belong to each class on the ground. For instance,
the matured cassava has a ground accuracy of 72%
under MLC classifier. Major confusion with matured
cassava came from fallow/grassland for all three
classifier indicating discriminating fallow/grassland
from matured cassava is the major setback. MLC
classifier performed best in classifying matured
cassava for both LANDSAT OLI scenes followed by
SVM. Our result is slightly lower than what
Phongaksorn et al., 2012 obtained for classifying
biofuel cassava using LANDSAT 5 in Thailand
where they obtained a producer and user accuracy of
98% and 99% respectively. Their results were
probably better due to better industrial farm
management for biofuel crops. Young cassava and
very young cassava were identified at lower
producer and user accuracy than matured cassava
using the two LANDSAT scenes although MLC
ranked first among the three classifiers.
Table 5: Classification accuracy for LANDSAT8 OLI acquired January 15, 2015.
Maximum Likelihood Neural Net classifier Support Vector Machine
Category
Producer
accuracy
(%)
User
accuracy
(%)
Ground
Accuracy
(%)
Producer
accuracy
(%)
User
accurac
y (%)
Ground
Accuracy
(%)
Producer
accuracy
(%)
User
accuracy
(%)
Ground
Accurac
y (%)
Degraded forest 89.0 78.2 69.6 68.81 62.5 43.0 73.4 81.6 59.9
Bareground/dirt road 70.6 81.4 57.4 50 80.95 40.5 51.5 50.7 26.1
Fallow/Bush/Grassland 78.6 88.3 69.4 74.57 82.69 61.7 78.6 71.2 56.0
Forest 98.6 99.7 98.2 95.58 97.09 92.8 99.1 98.0 97.2
Matured Cassava 88.2 81.8 72.2 81.37 79.05 64.3 60.8 79.5 48.3
Major River 95.6 97.7 93.4 80 97.3 77.8 93.3 100.0 93.3
Matured Maize 89.7 86.1 77.2 88.03 61.31 54.0 76.9 58.1 44.7
Very young Cassava 83.0 68.4 56.8 63.83 40.54 25.9 53.2 75.8 40.3
Young Cassava 77.8 75.0 58.3 44.44 80 35.6 50.0 64.3 32.1
Builtup 95.7 100.0 95.7 78.26 94.74 74.1 87.0 100.0 87.0
Tarred Road 100.0 100.0 100.0 91.67 84.62 77.6 100.0 100.0 100.0
Overall accuracy 92.21% 85.08% 85.87%
Kappa coefficient 0.8847 0.7793 0.7875
Table 6: Classification accuracy for LANDSAT8 OLI acquired December 14, 2014.
Maximum Likelihood Neural Net classifier Support Vector Machine
Category
Producer
accuracy
(%)
User
accuracy
(%)
Ground
accuracy
(%)
Producer
accuracy
(%)
User
accuracy
(%)
Ground
accuracy
(%)
Producer
accuracy
(%)
User
accuracy
(%)
Ground
accuracy
(%)
Degraded forest 90.8 87.6 79.6 48.62 71.62 34.8 73.4 81.6 59.9
Bareground/dirt road 88.2 88.2 77.9 48.53 55.93 27.1 51.5 50.7 26.1
Fallow/Bush/Grassland 86.7 88.8 77.0 65.32 64.57 42.2 78.6 71.2 56.0
Forest 98.7 99.9 98.6 98.23 94.48 92.8 99.1 98.0 97.2
Matured Cassava 98.0 95.2 93.4 47.06 47.52 22.4 60.8 79.5 48.3
Major River 97.8 97.8 95.6 88.89 100 88.9 93.3 100.0 93.3
Matured Maize 83.8 80.3 67.3 79.49 57.41 45.6 76.9 58.1 44.7
Very young Cassava 89.4 91.3 81.6 59.57 66.67 39.7 53.2 75.8 40.3
Young Cassava 88.9 81.4 72.3 46.3 86.21 39.9 50.0 64.3 32.1
Builtup 95.7 100.0 95.7 82.61 100 82.6 87.0 100.0 87.0
Tarred Road 100.0 100.0 100.0 100 92.31 92.3 100.0 100.0 100.0
Overall accuracy 94.75% 81.76% 86.17
Kappa coefficient 0.92 0.7239 0.793
GISTAM 2016 - 2nd International Conference on Geographical Information Systems Theory, Applications and Management
118

6 CONCLUSIONS
Our results demonstrate that WorldView-3 satellite
image product has good potentials in identifying
tropical crops such as cassava and maize at different
stages of growth. Moreover it identifies with high
accuracy other landcover types such as forest,
fallow/grassland and built up. However there is need
for more research in the use of this product for crop
identification especially during the main crop
growing season when cloud cover is most prevalent.
Results obtained using LANDSAT8 OLI
multispectral products also suggest that it can be
used for assessment of cropland at regional scale
with good reliability.
REFERENCES
Brewster, C.C., Allen, J.C. and Kopp, D.D., 1999. IPM
from space: using satellite imagery to construct
regional crop maps for studying crop insect
interaction. American. Entomologist, 45, 105–117.
Buechel, S.W., Philipson, W.R. and Philpot, W.D., 1989.
The effects of a complex environment on crop
separability with Landsat TM. Remote Sensing of
Environment, 27, 261–272.
Campbell, J.B., 1996. Introduction to Remote Sensing, 2nd
Edition. Guilford Press; 2nd edition, 622 pp.
Carfagna, E., Gallego, J.F., 2005. Using remote sensing
for agricultural statistics. Int. Stat. Rev. 2005,73, 389–
404.
Duda, R.O, Hart, P.E., 1973. Pattern classification and
scene analysis. New York, NY: Wiley.
Ehrlich, D., Estes, J.E., Scepan, J. and McGwire, K.C.,
1994. Crop area monitoring with an advanced
agricultural information system. Geocarto
International, 9, 31–42.
Fauquet C., Fargette D., 1990. "African Cassava Mosaic
Virus: Etiology, Epidemiology, and
Control" (PDF). Plant Disease 74 (6): 404–
11. doi:10.1094/pd-74-0404.
Foley, J.A., Ramankutty, N., Brauman, K.A, Cassidy,
E.S., Gerber, J.S., Johnston, M., Mueller, N.D.,
O’Connell, C., Ray, D.K., West, P.C., 2011. Solutions
for a cultivated planet. Nature 2011, 478, 337–342.
Foody G.M, Mathur A. 2004. A relative evaluation of
multiclass image classification by support vector
machines. IEEE Transactions on Geoscience and
Remote Sensing. 42: 1335–1343.
Hanna, R., Allah, M., Berry, A. and Sharobeem, Y., 2004.
Crop estimation using satellite based and ground-
based surveys (comparative study). In Proc. ASAE
Annual International Meeting, (St. Joseph, Michigan:
American Society of Agricultural Engineers).
Hsu, C. W., Chang, C. C., Lin, C. J., 2010. A practical
guide to support vector classification. Department of
Computer Science National Taiwan University, Taipei
106, Taiwan http://www.csie.ntu.edu.tw/~cjlin.
Jia, K, Wu, B.F., Li Q.Z. 2013. Crop classification using
HJ satellite multispectral data in the North China
Plain. Journal of Applied Remote Sensing. 7: 073576.
Jia, K., We, X., Gu, X., Yao, Y., Xie, X., Li, B., 2014.
Land cover classification using LANDSAT8
Operational Land Imager data in Beijing,
China. Geocarto International. Taylor & Francis. Vol.
29 No. 8, 941–951, http://dx.doi.org/
10.1080/10106049.2014.894586.
Lippmann, R.P., 1987. An introduction to computing with
neural nets. ASSP Magazine, IEEE 4 (2), 4-22.
Low, F., and Duveiller, G., 2014. Defining the Spatial
Resolution Requirements for Crop identification Using
Optical Remote Sensing; Remote Sens. 2014, 6, 9034-
9063; doi: 10.3390/rs6099034.
Lulla K, Duane Nellis M, Rundquist B. 2013. The
LANDSAT8 is ready for geospatial science and
technology researchers and practitioners. Geocarto
International. 28: 191–191.
Murmu S., Biswas S., 2015. Application of Fuzzy logic
and Neural Network in Crop Classification: A Review.
International conference on water resources, coastal
and ocean engineering (ICWRCOE 2015). Aquatic
Procedia 4 (2015) 1203 – 1210, Available online at
www.sciencedirect.com.
Omkar S.N., Senthilnath J., Mudigere D., and Kumar
M.M., 2008, Crop Classification using Biologically-
inspired Techniques with High Resolution Satellite
Image, Journal of Indian Society of Remote Sensing,
(36) 175-182.
Ozdarici-Ok, A.; Ok, A.O.; Schindler, K., 2015. Mapping
of Agricultural Crops from Single High-Resolution
Multispectral Images—Data-Driven Smoothing vs
Parcel-Based Smoothing. Remote Sens. 2015, 7, 5611-
5638; doi: 10.3390/rs70505611.
Pal, M., Mather, P.M., 2005. Support vector machines for
classification in remote sensing. Int. J. Remote
Sensing. 2005, 26, 1007–1011.
Phongaksorn N., Tripathi, N. K., Kumar, S., Soni, P.,
2012. Inter-Sensor Comparison between THEOS and
LANDSAT 5 TM Data in a Study of Two Crops
Related to Biofuel in Thailand. Remote Sens. 2012, 4,
354-376; doi: 10.3390/rs4020354.
Richards, J. A., Jia, X., 2006. Remote Sensing Digital
Image Analysis, An Introduction, Springer, Fourth
Edition.
Rodriguez, J.R., Miranda, D. and Alvarez, C.J., 2006.
Application of satellite images to locate and inventory
vineyards in the designation of origin ‘‘Bierzo’’ in
Spain. Transactions of the ASABE, 49(1), 277–290.
Sandoval, G., Roberto A., Vazquez, P. G., and Jose A.,
2014. Crop Classification Using Different Color
Spaces and RBF Neural Networks. Intelligent Systems
Group, Faculty of Engineering, La Salle University
Benjamin Franklin 47, Condesa, Mexico, DF, 06140.
L. Rutkowski et al. (Eds.): ICAISC 2014, Part I, LNAI
8467, pp. 598–609, 2014. Springer International
Publishing Switzerland 2014.
Investigating the Use of High Resolution Multi-spectral Satellite Imagery for Crop Mapping in Nigeria - Crop and Landuse Classification
using WorldView-3 High Resolution Multispectral Imagery and LANDSAT8 Data
119

Sonneveld B.G. J.S., 2005. Compilation of a soil map of
Nigeria: A nation-wide soil resource and landform
inventory. Nig. J. Soil Res. Vol. 6: 2005 71 – 83.
Srestasathiern P .and Rakwatin, P., 2014. Oil Palm Tree
Detection with High Resolution Multi-Spectral
Satellite Imagery. Remote Sens. 2014, 6(10), 9749-
9774; doi:10.3390/rs6109749.
Vapnik, V., 1979. Estimation of Dependences Based on
Empirical Data. Nauka, Moscow, pp. 5165–5184, 27
(in Russian) (English translation: Springer Verlag,
New York, 1982).
Vassilev V., 2013 Crop investigation using high-resolution
worldview-1 and quickbird-2 satellite images on a test
site in Bulgaria. Bulgarian Academy of Sciences.
Space Research and Technology Institute. Aerospace
Research in Bulgaria. 25, 2013, Sofia.
Xavier, B., Vanhalleb, L., and Defournya, P., 2005.
Efficiency of crop identification based on optical and
SAR image time series. Remote Sensing of
Environment, 96, 352–365.
Yang C., James H. E., Reginald S. F., Dale, M., 2007.
Using high resolution QuickBird imagery for crop
identification and area estimation. Geocarto
International Vol. 22, No. 3, September 2007, 219–
233.
Yuan H., Van Der Wiele C. F., Khorram, S., 2009. An
Automated Artificial Neural Network System for Land
Use/Land Cover Classification from LANDSAT TM
Imagery. Remote Sens. 2009, 1, 243-265; doi:
10.3390/rs1030243.
Zhu, G., Blumberg, D.G., 2002. Classification using
ASTER data and SVM algorithms; The case study of
Beer Sheva, Israel. Remote Sensing of Environment
80 (2), 233–240.
GISTAM 2016 - 2nd International Conference on Geographical Information Systems Theory, Applications and Management
120
