
“How Fear of Crime Affects Needs for Privacy & Safety”
Acceptance of Surveillance Technologies in Smart Cities
Julia van Heek, Katrin Arning and Martina Ziefle
Human-Computer Interaction Center, RWTH Aachen University, Germany
Keywords: Technology Acceptance, Crime Surveillance Technologies, Privacy, Safety, Smart Cities, Perceived Crime
Threat.
Abstract: These days, surveillance technologies are a key component of smart and networked cities preventing or
detecting crime and giving the residents a sense of safety. On the one hand, safety perceptions can be
supported by adequate surveillance technologies (e.g., cameras), however on the other hand, the systematic
use of surveillance technologies undermines individual privacy needs. In this empirical study, we explore
users’ perceptions on safety and privacy in the context of surveillance systems in urban environments.
Using an online survey, 119 users were requested to indicate their acceptance regarding different types of
surveillance technologies, differentiating perceived benefits and barriers as well as safety and privacy needs.
Also, we investigate acceptance differences towards surveillance technologies at various locations (private
and public). In this paper, we especially explore the impact of individual perceived crime threat on the
acceptance of surveillance technologies and on the needs for privacy and safety.
1 INTRODUCTION
One of the major challenges of modern societies is
to meet the complex demands of urbanization
processes and to maintain liveable, sustainable, and
smart cities. Up to 2030, more people will live in
cities than in other regions and this development is
forecasted to increase further. In line with these
fundamental urbanization processes, consecutive
challenges arise. Beyond issues of economy,
transportation or governance, nowadays’ major
keystones of urban planning are the broadly
accepted implementation of technical infra-
structures and (smart) city concepts (Ziefle et al.,
2014). All over the world, an increasing number of
surveillance technologies is used to prevent or time-
critically detect crime in order to improve safety (La
Vigne et al., 2011). Perceived safety represents an
essential prerequisite for the participation in social
and economic life and is a valuable good for cities.
However, the main drawback of surveillance
technologies is the perceived privacy violation by
the public through the recordings and processing of
data (Whitaker, 1999). Therefore, smart city
concepts must meet a wide range of residents´ needs,
including high comfort regarding safety,
sustainability, but also consider different levels of
perceived crime threat, and protection of privacy
(Ziefle and Wilkowska, 2015).
Facing the demographic change, smart city
concepts should also address the diversity of urban
residents. Although they are essential for all
dwellers, especially different ages of residents
should be taken into account. If individual needs
and wishes of both younger and older people are
considered, the fundament for liveable and safe
future cities is granted (Plouffe and Kalache, 2010).
2 ACCEPTANCE OF CRIME
SURVEILLANCE SYSTEMS
For a free, unrestricted and unworried life in urban
areas, people need to feel safe. In this context, crime
threat in cities is a central challenge (Smith and
Clarke, 2000; Marshall et al., 2007). The consequen-
ces of crime for urban safety and individual risk
perception are well described and represent a serious
barrier for many residents (e.g. Baumer, 1978;
Loewen et al., 1993). While it is undisputed that
safety and crime prevention are major goals for
urban development, the realization of effective
32
Heek, J., Arning, K. and Ziefle, M.
“How Fear of Crime Affects Needs for Privacy Safety” - Acceptance of Surveillance Technologies in Smart Cities.
In Proceedings of the 5th International Conference on Smart Cities and Green ICT Systems (SMARTGREENS 2016), pages 32-43
ISBN: 978-989-758-184-7
Copyright
c
2016 by SCITEPRESS – Science and Technology Publications, Lda. All rights reserved

safety measures is controversially evaluated (Isnard,
2001/Wiecek and Seatnan, 2002/Sheldon, 2011).
Technically, surveillance technologies are at
hand and are already widely used in urban
environments to increase safety (Chattopadhyayr,
2013/ Song et al., 2013). Most of all city centers use
close-circuit television in public spaces and in public
transport systems. However, the acceptance of these
systems in general and, more specific, the individual
perception of safety does not necessarily rise, when
surveillance systems are installed (Lewis and
Maxfield, 1980). Instead, perceived fear of crime in
urban environments is rather shaped by physical
features, such as visibility or lighting, prospect such
as open spaces, opportunities to escape (Blöbaum
and Hunecke, 2005). But not only physical charac-
teristics of urban spaces, but also perceived incivi-
lities in surrounding areas strongly affect fear of
crime (Lewis and Maxfield, 1980). Therefore, the
installation of technical safety measure needs to
carefully address individual perceptions of safety at
different locations to support safe living in smart
cities.
Apart from the goal of enhanced safety,
surveillance systems also pose ethical concerns. In
terms of privacy, protection is one of the key human
rights. Technical monitoring of people in urban
environments for safety reasons conflict with
individual rights for privacy (Gumpert and Drucker,
2001), which – beyond legal concerns – might lead
to a public rejection of monitoring technologies in
city locations (Arning et al., 2013b). Accordingly,
the relationship between individual needs for safety
from crime and the individual need for protecting
one’s own privacy is complex and does not follow a
simple arithmetic, but rather varies with usage
context, individual characteristics and city needs
(Arning et al., 2013a). The safety-privacy-
relationship for crime surveillance technologies can
only be understood if the trade-off between both
basic motives is empirically addressed.
3 INDIVIDUAL FACTORS
The population in cities is characterized by a high
heterogeneity. Residents’ needs and wishes towards
quality of city life as well as related experiences and
attitudes are affected by a multitude of individual
factors. Though there are individual key
characteristics, which allow defining groups with
specific needs regarding safety and privacy. One
important factor is age, which becomes even more
relevant with the on-going demographic change. For
instance, age-related changes in health conditions
and changed leisure time activities after retirement
lead to specific mobility and accessibility needs
(Alsnih and Hensher, 2003). Especially for older
people, perceived safety in their living environment
is essential for maintaining social contacts
(Dickerson et al., 2007). Apart from age, gender is
another factor, which strongly affects needs for
safety and privacy. Elderly women, for example,
have higher needs for safety than men, reducing
their willingness to use public transport-tation or
carpooling (Arning et al., 2013b). Beyond age and
gender, but strongly interrelated, the perceived level
of crime fear is another important factor for the
acceptance of surveillance techno-logies in smart
cities. Fear of crime, defined as the emotional
response to possible violent crime and physical harm
(Covington and Taylor, 1991), has been intensively
researched in the last decades by various scientific
disciplines in the context of urban development.
Two central findings are specifically noteworthy in
this context: a) crime fear is an individual perception
not necessarily associated with objectively
measurable crime statistics. Thus, even when
persons live in a comparably safe residence, they
might perceive higher levels of crime fear; b)
individual factors, as age, gender, and experience
with crime, further affect fear of crime. A well-
replicated finding in this context is the inverse
relationship of victimization rate and crime fear: the
most fearful individuals (elderly women) have the
lowest victimization rate, the least fearful (young
men) have the highest victimization rate
(Scarborough et al., 2010). The strong interrelations
of age, gender and crime fear suggest, that age and
gender serve as “carrier variables” for different
levels of perceived crime fear. Accordingly, the
present study focuses on the inter-individually
different effects of crime fear on surveillance
technology acceptance.
The usage of crime surveillance technologies in
urban environments is one (technical) approach to
enhance perceived safety and to reduce crime rates.
Yet, only sparse knowledge is available about
acceptance patterns of residents towards benefits and
barriers of crime surveillance technologies, which
are assumed to increase safety perceptions in the
context of smart cities. The goal of the present study
is, thus, to understand peoples’ acceptance of crime
surveillance technologies in urban environments,
taking needs of safety and privacy as well as
individual factors such as perceived crime threat into
account.
“How Fear of Crime Affects Needs for Privacy Safety” - Acceptance of Surveillance Technologies in Smart Cities
33

4 METHODOLOGY
In the following section, the questionnaire, the
sample and the applied statistical procedures are
detailed.
4.1 Questionnaire
Questionnaire items were developed based on the
findings of focus group interviews carried out prior
to this study. The questionnaire was arranged in six
sections. The first part addressed demographic
characteristics of the participants, namely age,
gender, family status, children status, number of
persons living in a household together, type and
place of residence, housing status (homeowner or
tenant), educational level, (current or last) job sector
and current or last occupation.
The second part focused on the individual
perception of crime threat (PCT) and potential
experiences with crime. First, we asked for PCT at
different places by day and by night. For clarity
reasons, locations were arranged into four categories
(private (e.g., garden), semi-private (e.g., own
street), semi-public (e.g., shopping mall), and public
(e.g., train station) locations) based on results of
previous focus groups interviews. The question “to
what extent do you feel threatened by crime during
the day?” had to be evaluated for more than 20
different public and private locations (see Fig. 1).
Threat perceptions had to be rated on a six-point
Likert scale (1=not at all; 6=very strong PCT). In
addition, looking for possible differences of PCT
during day- and nighttime, participants had to
evaluate on a five-point scale (-2=much lower; -1
=lower; 0=no difference; 1=higher t; and 2=much
higher) if they would feel a different crime threat at
the same locations by night.
Based on PCT ratings for different locations the
between-factor “perceived crime threat” (PCT) was
calculated. Respondents’ PCT ratings were summed
up (max=156), transformed to a value of 100 and a
median split was conducted (cut-off=34.62), which
separated two groups with low PCT and high PCT.
Second, we asked for individual crime threat
concerning different crime offenses, which had to be
evaluated by the participants on a six point Likert
scale. The final aspect of this part of the
questionnaire focused on experiences with crime.
Here, participants indicated whether they, their
family, friends, relatives or acquaintances had
become victims of various crimes offenses
themselves, e.g. theft or bodily injury.
The third part assessed technologies and
traditional measures enhancing perceived safety in
private and public environments. Thus, different
technologies (e.g., camera surveillance, ambient
lighting, microphones) but also social measures
(e.g., police presence) had to be rated on a six-point
Likert scale (1=strongly disagree; 6=strongly agree)
for a private as well as a public context of use.
The fourth part of the questionnaire asked about
the acceptance of crime surveillance technologies at
different locations. First, the participants were asked
to evaluate to what extend they would accept
technologies like standard cameras, microphones,
cameras with face recognition and location
determination in their private living environment.
Then, participants had to do the same in the case of a
public environment. Further, we asked for
acceptance of surveillance cameras at different
private and public locations, which also had to be
evaluated on a six point Likert scale (1=strongly
disagree; 6=strongly agree). The next part of the
questionnaire asked about perceived benefits and
barriers of crime surveillance (also 6-point Likert
scale, see above). Benefits of crime surveillance
were examined in seven items, which referred to
safety aspects, e.g., prevention of crime, sense of
safety or the felt deterrent effect for potential
criminals. Barriers referred to eight items relating to
privacy aspects, e.g., protection of civil rights and
personal freedom, storage of recorded data or
inference of being under general suspicion.
The fifth and last part focused on the trade-off
between the need for safety, on the one hand, and
the need for individual privacy, on the other hand.
Participants were explicitly asked to trade-off
between their individual needs for safety and privacy
when considering the employment of crime
surveillance technologies at different locations on a
10-point scale (1=increase of safety; 10=protection
of privacy). Completing the questionnaire took about
20 minutes. Data was collected in an online survey
conducted in Germany. By using the online link, all
parts of Germany had been addressed, however,
participants predominately originated in North-
Rhine Westphalia. Overall, the questionnaire was
made available for about 8-10 weeks in the
beginning of 2013. In that time, there was no high
impact society event (e.g. terrorist attacks) and data
collection was also accomplished prior to the current
flow of refugees, which are moving to European
countries.
4.2 Sample
In total, 119 participants took part in the study. As
SMARTGREENS 2016 - 5th International Conference on Smart Cities and Green ICT Systems
34
only complete questionnaires (no missing answers)
could be used for further statistical analyses, 99 data
sets were analysed in the end. The mean age of the
participants was 37.8 (SD=15.5) with 58.6% females
and 41.4 % males. Asked for having children, the
majority of 65.7% answered to have no children.
Demanded for the number of persons living in their
household, 38.4% reported to live in pairs, 31.3%
live alone, 15.2% live in a threesome, 9.1% live with
four persons, 3.0% live with five persons and also
3.0% live with more than five persons in their
household. Asked for their residence, 23.2%
reported to live in a detached, 13.1% in a semi-
detached and also 13.1% in a townhouse. The
majority of 50.5% reported to live in an apartment
building. The participants were also asked for their
housing conditions: 45.5% reported to be the house
owner and 54.5% reported to rent. Regarding their
area of residence, 35.4% live in a city centre, 29.3%
in outskirts, 21.2% in suburban areas and 14.1% live
in rural areas. Participants volunteered to take part in
the study and were not gratified for their efforts.
5 RESULTS
The general results of the study concerning crime
surveillance acceptance have been published already
(van Heek et al., 2015). In this paper, the influence
of the user diversity factor perceived crime threat on
crime surveillance acceptance is focused.
First, the results of PCT regarding day- and
nighttime at various locations are described. In a
second step, the impact of individual perceived
crime threat on crime surveillance acceptance is
presented in detail. Initially, the segmentation of
two PCT groups is introduced. Afterwards the
influence of PCT on crime surveillance acceptance
in terms of technologies and traditional measures
enhancing perceived safety is shown. Further, the
results of surveillance technologies regarding
different locations as well as perceived benefits and
barriers of crime surveillance are presented
(depending on PCT). Finally, the results of the
trade-off between the needs for safety and privacy
are shown for both PCT groups. Data was analysed
descriptively and, with respect to the effects of user
diversity, by (M)ANOVA procedures (significance
level at 5%).
5.1 Perceived Crime Threat at Different
Public and Private Locations
Perceived crime threat at daytime: In total, i.e.
summed up for all locations, the PCT during
daytime was rather low (M=36.3 on a scale with
max = 100; SD=12.9).
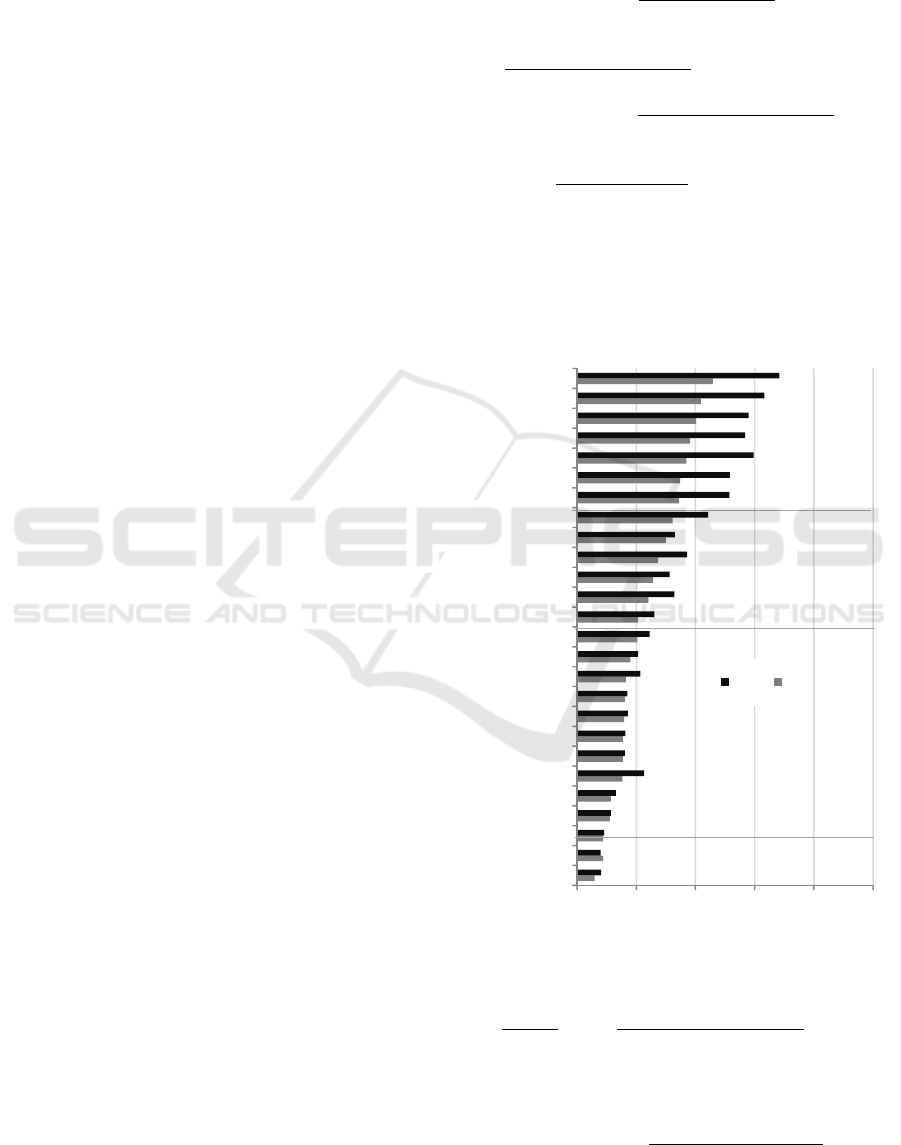
The majority of private locations was perceived
as only lightly threatening, e.g., own garden (M=1.3;
SD=0.6) or own home (M=1.4; SD=0.8, see Figure
1). Semi-private locations were noticed as lightly
threatening, e.g., own street (M=1.8;SD=1) or hotel
(M=1.8;SD=0.9). Semi-public locations were
observed as slightly threatening, e.g., market
(M=2.4; SD=1.2) and public transport (M=2.6;
SD=1.3). Public locations were perceived as more
threatening, e.g., parks (M=2.8; SD=1.3), train
station (M=3.0; SD=1.4) or underground car park
(M=3.3; SD=1.6). Night time: In total, PCT
nighttime ratings were significantly higher (M=43.4;
SD=15.5) compared to daytime ratings
(F(1,97)=15.4,p<0.01). However, the PCT at night
did not vary strongly across the different locations.
Figure 1: Perceived crime threat by day and by night.
Private and semi-private locations were not
perceived differently by day or by night, except for
own street (M
Night
=2.1; SD=1.4; M
Day
=1.8; SD=1.0;
F(1,98)=18.7;p<0.01) and own house entry
(M
Night
=2.1; SD=1.5;M
Day
=1.8;SD=1,1; F(1,98)=8.7;
p<0.01). Concerning semi-public locations a higher
123456
own garden
own home
own…
restaurants
own car
your street
hotel room
public…
hotels
departme…
own…
schools
cellar
main roads
shopping…
pubs
market
tourist…
public…
parking…
stations
parks
station…
train station
car park
u-car park
evaluation (min=1; max=6)
night day
private
semi-
private
semi-
public
public
n
not at
all
strongly
“How Fear of Crime Affects Needs for Privacy Safety” - Acceptance of Surveillance Technologies in Smart Cities
35
PCT was found, e.g., for market (M
Night
=2.9;
SD=1.4; M
Day
=2.4; SD=1.2; F(1,98)=35.7;p<0.01)
or public transport (M
Night
=3.2; SD=1.6; M
Day
=2.6;
SD=1.2; F(1,98)=51.7; p<0.01) by night. Regarding
public locations, nearly all locations were perceived
significantly more threatening by night, e.g., train
station (M
Night
=3.9; SD=1.8; M
Day
=3.0; SD=1.4;
F(1,98)=102.1;p<0.01) as well as parks (M
Night
=4.0;
SD=1.5; M
Day
=2.8;SD=1.2; F(1,98)=175.6; p<0.01).
5.2 Effects of Perceived Crime Threat
as User Diversity Factor
So far, the acceptance of crime surveillance
technologies with related benefits and barriers was
reported for the whole group of respondents (van
Heek et al., 2015). However, residents in urban
environments are highly heterogeneous. Since we
assumed that the perceived necessity and acceptance
of crime surveillance technologies is affected by
individual levels of crime fear, we systematically
included “perceived crime threat” as group splitting
variable in our analyses.
5.2.1 Segmentation of PCT Groups
Based on respondents’ ratings of crime threat at
different locations two groups with high and low
levels of perceived crime threat (high and low PCT,
cut-off=34.6 on scale with max=100) were formed
by median split. Below, groups are described by
socio-demographic factors. The group with high
PCT consisted of a higher proportion of women than
in the low PCT group (though not significant).
Concerning age there was a similar distribution in
groups 1 and 2 without significant differences.
Table 1: Segmentation of PCT Groups.
Group 1 (n=50)
„low PCT“
Group 2 (n=49)
„high PCT“
p
gender 52% female
48% male
65,3% female
34,7% male
n.s.
age M = 36.68
SD=14.42
M=38.88
SD=16.54
n.s.
familiy
status
single 60%
partner/married 38%
divorced 2%
single 36,7%
partner/married 59,2%
divorced 4,1%
<
.05
children
status
yes 24%
no 76%
yes 44,9%
no 55,1%
<
.05
type of
residence
detached house 16%
semi-detached house
14%
townhouse 10%
apartment building 60
%
detached house 30,6%
semi-detached house
12,2%
townhouse 16,3%
apartment building 40,8
%
n.s.
place of
residence
city centre 46%
outskirts 22%
suburban area 16%
rural area 16%
city centre 24,5%
outskirts 36,7%
suburban area 26,5%
rural area 12,2%
n.s.
Both groups differed in terms of family status and
children status significantly (p<0.05). Group 1 (low
PCT) consists mainly of singles (60%), while group
2 (high PCT) mainly consisted of married people or
people living with a partner. Regarding children
status there was a higher percentage of people with
children (44,9%) in the high PCT group than in the
low PCT group (24%). In terms of type and place of
residence there were in parts slightly different
distributions, which failed to meet significance level.
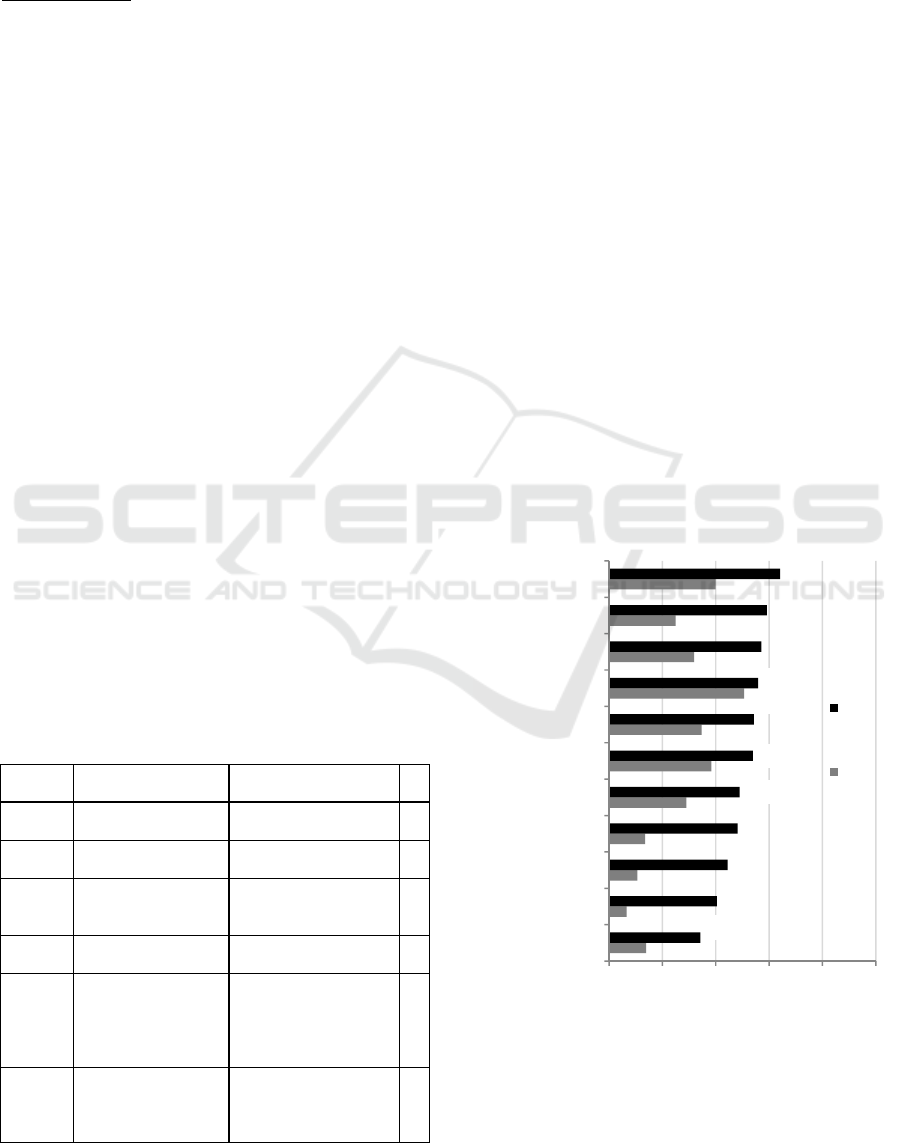
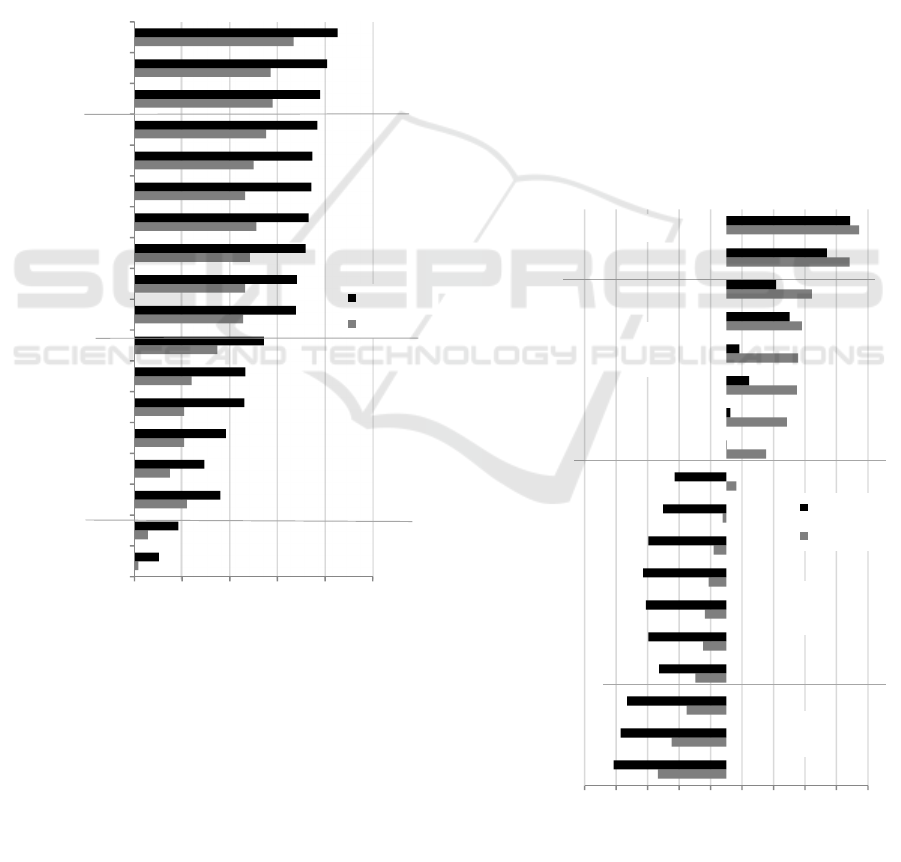
5.2.2 Fear of Crime Offenses
In a first step, we analysed to what extent people
with high and low PCT differ with regard to fear of
several crime offenses (see Figure 7). People with
high PCT reported to feel significantly more
threatened than those with low PCT
(F(1,97)=48.1;p<0.01), except for the item “bicycle
theft”. This result pattern applied for “light”
offenses, e.g. material damage (M
Low
=3.0; SD=1.3;
M
High
=4.2; SD=1.2; F(1,97)=22.9; p<0.01) or theft
(in/from house) (M
Low
=2.6; SD=1.4; M
High
=3.9;
SD=1.3; F(1,97)=20.9; p<0.01) as well as for
“serious” offenses, for example sexual crimes
(M
Low
=1.7; SD=1.2; M
High
=3.4; SD=1.5; F(1,97)=
40.1;p<0.01), offenses against life (M
Low
=1.5;
SD=1.0; M
High
=3.2; SD=1.5; F(1,97)=44.4; p<0.01)
and terrorism (M
Low
=1.3; SD=0.8; M
High
=3.0;
SD=1.4; F(1,97)= 54.5; p<0.01).
Figure 2: Fear of crime offenses for low and high PCT
groups.
All PCT group differences were highly
1,7
1,3
1,5
1,7
2,4
2,9
2,7
3,5
2,6
2,2
3,0
2,7
3,0
3,2
3,4
3,4
3,7
3,7
3,8
3,9
4,0
4,2
123456
stalking
terrorism
offenses against
life
sexual crimes
(own) car theft
fraud
theft (in/from my
car)
bicycle theft
theft in/(from the
own house)
bodily injury
material damage
evaluation (min=1; max=6)
high
PCT
low
PCT
not at
all
strongly
SMARTGREENS 2016 - 5th International Conference on Smart Cities and Green ICT Systems
36
significant. However, for serious offenses (e.g.
offenses against life) the differences between fear of
crime ratings for people with low and high PCT
were stronger pronounced.
5.2.3 Acceptance of Crime Surveillance
Technologies in Private Environments
In a next step, we examined how PCT influences the
acceptance of crime surveillance technologies and
traditional measures in private environments (see
Figure 3). First of all, using visible and invisible
technologies in private environments was both
accepted by the high PCT group, while it was rather
rejected by the low PCT group (Visible: M
low
=3.0;
SD=1.7; M
High
=4.2, SD=1.4; F(1,98)=15.8; p<0.01;
Invisible: M
low
=2.7; SD=1.6; M
High
=4.0; SD=1.3;
F(1,98)=18.1; p< 0.01).
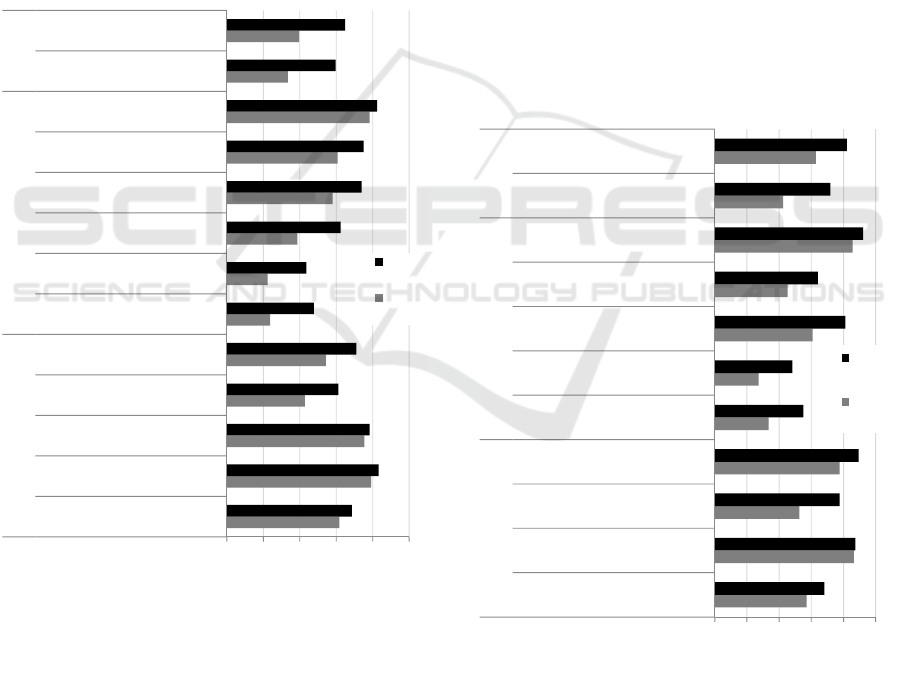
Figure 3: Acceptance of surveillance technologies and
traditional measures at private environments for low and
high PCT groups.
Concerning the technology type there was no
difference between the PCT groups for ambient
lighting, which was most accepted. All other types
of technology were significantly more accepted by
the high PCT group, e.g. cameras (M
Low
=2.9;
SD=1.7; M
High
=4.1; SD=1.4; F(1,98)=13.8; p<0.01)
or location determination (M
Low
=2.2; SD=1.2;
M
High
=3.2; SD=1.2; F(1,98)=24.3; p<0.01). The
group with low PCT even rejected the usage of
cameras, microphones, and location determination.
Regarding traditional measures more police
presence (M
Low
=3.7; SD=1.7; M
High
=4.6; SD=1.2;
F(1,98)=7.8;p<0.01) and more presence of private
safety services (M
Low
=3.1; SD=1.7; M
High
=4.1;
SD=1.3; F(1,98)=8.6; p<0.01) were more accepted
by the high PCT group than by the low PCT group.
Both groups did not differ in their evaluations of
other traditional measures like contact to
neighbours, present awareness of others and a dog.
5.2.4 Acceptance of Crime Surveillance
Technologies in Public Environments
To compare different contexts of application we also
asked for the acceptance of the same crime
surveillance technologies and nearly the same
traditional measures in public environments (see
Figure 4).
Figure 4: Acceptance of surveillance technologies and
traditional measures at public environments for low and
high PCT groups.
In general, use of surveillance technologies was
more accepted in public (M=71.5; SD=15.4) than in
4,1
5,0
4,8
3,1
3,7
2,2
2,1
2,9
3,9
4,0
4,9
2,7
3,0
4,4
5,2
4,9
4,1
4,6
3,4
3,2
4,1
4,7
4,8
5,1
4,0
4,2
123456
dog
present awareness of others
contact to neighbors
presence of private security
services
police presence
location determination
microphones
camera surveillance
alarm system
motion detectors
ambient lighting
invisible technologies
visible technologies
traditional measures type of technology technology
evaluaton (min=1; max=6)
high
PCT
low
PCT
rejection support
3,9
5,3
3,6
4,9
2,7
2,4
4,0
3,3
5,3
3,1
4,1
4,4
5,4
4,9
5,5
3,8
3,4
5,1
4,2
5,6
4,6
5,1
123456
to be only on the road by day
present awareness of others
presence of private security
services
police presence
location determination
microphones
camera surveillance
motion detectors
ambient lighting
invisible technologies
visible technologies
traditional measures type of technology technology
evaluation (min=1; max=6)
high
PCT
low
PCT
rejection support
“How Fear of Crime Affects Needs for Privacy Safety” - Acceptance of Surveillance Technologies in Smart Cities
37
private environments (M=66.0; SD=16.0; F(1,98)=
18.4; p<0.01). First, using visible and invisible
technologies in public environments was also
significantly more accepted by the high PCT group
than by the low PCT group (Visible: M
low
=4.2;
SD=1.6; M
High
=5.1; SD=1.1; F(1,98)=11.6; p<0.01;
Invisible: M
low
=3.2; SD=1.8; M
High
=4.6; SD=1.3;
F(1,98)=20.8; p< 0.01).
Concerning different technology types all
technologies are evaluated more positively by the
high PCT group. So there is an higher acceptance of
surveillance technologies by the high PCT group
than by the low PCT group, for example for cameras
(M
low
=4.0; SD=1.5; M
High
=5.1; SD=1.1; F(1,98)=
13.5; p<0.01) and motion detectors (M
low
=3.3;
SD=1.7; M
High
=4.2; SD=1.4; F(1,98)=8.4; p<0.01).
Interestingly, the use of cameras was evaluated
positively by both groups for being used in public
environments. For people with low PCT cameras
were even the only accepted crime surveillance
technology. Regarding traditional measures
enhancing perceived safety more police presence
(M
Low
=4.9; SD=1.2; M
High
=5.5; SD=0.6; F(1,98)=
9.8; p<0.01) and more presence of private safety
services (M
Low
=3.6; SD=1.7; M
High
=4.9; SD=1.1;
F(1,98)=18.7; p<0.01) were more accepted by the
high PCT group than by the low PCT group. Both
PCT groups did not differ in their ratings of present
awareness of others and to be travelling by day.
5.2.5 Perceived Benefits of Crime
Surveillance Technologies
In a next step we analysed to what extent perceived
benefits of crime surveillance were influenced by
PCT (see Figure 5).
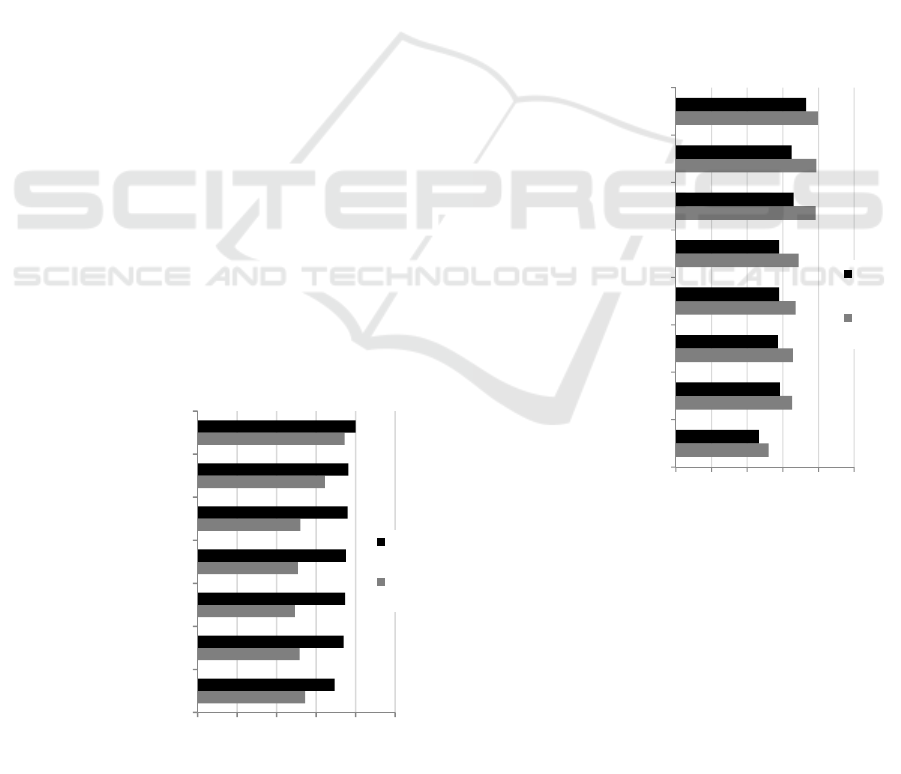
Figure 5: Perceived benefits of crime surveillance
technologies for high and low PCT groups.
Nearly all benefits were significantly more
accepted by the high PCT group, except
investigation of crimes, which was most accepted,
but not evaluated differently by the two PCT groups.
Deterrent effect (M
Low
=4.2; SD=1.6; M
High
=4.8;
SD=1.1; F(1,98)=4.5; p<0.05), safer feeling in
darkness (M
Low
=3.6; SD=1.7; M
High
=4.8; SD=1.3;
F(1,98)=14.7; p<0.01), sense of safety (M
Low
=3.5;
SD=1.5; M
High
=4.8; SD=1.2; F(1,98)=20.0; p<0.01),
safer feeling when traveling alone (M
Low
=3.5;
SD=1.6; M
High
=4.7; SD=1.3; F(1,98)=18.8; p<0.01),
and measure against safety risks (M
Low
=3.6;
SD=1.6; M
High
=4.7; SD=1.3; F(1,98)=15.2; p<0.01)
were also accepted and favoured by the high PCT
group.
5.2.6 Perceived Barriers of Crime
Surveillance Technologies
We also examined, how perceived barriers of crime
surveillance technologies were influenced by PCT
(see Figure 6).
Figure 6: Perceived barriers of crime surveillance
technologies for high and low PCT groups.
The highest concern for both groups was the
protection of personal information. Interestingly,
both PCT groups did not differ significantly in this
concern. This also applied to the barriers reuse of the
stored data, implies being under general suspicion,
violation of personal data and protecting civil rights
and personal freedom. In contrast, group differences
were found for risk of violating personal rights
(M
Low
=4.9; SD=1.3; M
High
=4.2; SD=1.3; F(1,98)=
3,7
3,6
3,5
3,5
3,6
4,2
4,7
4,5
4,7
4,7
4,8
4,8
4,8
5,0
123456
prevention of crimes
measure against security
risks
safer feeling when
traveling alone
sense of security
safer feeling in darkness
deterrent effect
investigation of crimes
evaluation (min=1; max=6)
high
PCT
low
PCT
rejection
support
3,6
4,3
4,3
4,4
4,4
4,9
4,9
5,0
3,3
3,9
3,9
3,9
3,9
4,3
4,2
4,7
123456
implies being under general
suspicion
privacy is violated
protect civil rights and
personal freedom
reuse of the stored data
storage of recorded data
continuous observation
risk of violating personal
rights
protection of personal
information
evaluation(min=1; max=6)
high
PCT
low
PCT
rejection support
SMARTGREENS 2016 - 5th International Conference on Smart Cities and Green ICT Systems
38
6.9; p<0.01), continuous observation (M
Low
=4.9;
SD=1.4; M
High
=4.3; SD=1.5; F(1,98)=4.4; p<0.05)
and storage of recorded data (M
Low
=4.4; SD=1.4;
M
High
=3.9; SD=1.3; F(1,98)=4.2; p<0.05). These
barriers were rated higher by the low PCT group
than by the high PCT group.
5.2.7 Acceptance of Crime Surveillance
Technologies at Different Locations
Further, we analysed to what extent PCT influences
the acceptance of crime surveillance technologies at
different locations. First of all, the usage of crime
surveillance technology was generally more
important for people with a high PCT (see Figure 7).
Figure 7: Influence of PCT on the acceptance of crime
surveillance at different locations.
The high PCT group evaluated the usage of
crime surveillance technologies significantly more
positively independent of different locations.
Although crime surveillance was not desired at
private locations, there was a broader acceptance for
it in the high PCT group, e.g. for living room
(M
Low
=1.3; SD=0.6; M
High
=1.9; SD=1.3; F(1,98)=
10.0;p<0.01). At semi-private locations crime
surveillance technology acceptance was also rather
low, while at this point there were higher ratings of
the high PCT group as well, e.g. favourite pub
(M
Low
=2.0; SD=1.2; M
High
=3.3; SD=1.4; F(1,98)=
22.1; p<0.01) or own house entry (M
Low
=2.7;
SD=1.8; M
High
=3.7; SD=1.6; F(1,98)=7.9; p<0.01).
At semi-public locations the low PCT group rather
rejected crime surveillance, while it was accepted by
the high PCT group, e.g. schools (M
Low
=3.3;
SD=1.7;M
High
=4.4,SD=1.5; F(1,98)=12.2; p<0.01)
or parks (M
Low
=3.3; SD=1.7; M
High
=4.7; SD=1.2;
F(1,98)=22.3; p<0.01). Finally, at public locations
crime surveillance technologies were rather accepted
by the low PCT group, while it was strongly desired
by the high PCT group, e.g. public transport
(M
Low
=3.9; SD=1.7; M
High
=4.9; SD=1.2; F(1,98)=
11.4; p<0.01) or train station (M
Low
=4.3; SD=1.6;
M
High
=5.3; SD=1.0; F(1,98)=11.4; p<0.01).
5.2.8 Trade-off between Safety and Privacy
In a last step, we examined the effects of PCT on the
trade-off between looking for safety and protecting
one’s own privacy (see Figure 8).
Figure 8: Influence of PCT on the trade-off between need
for safety and privacy.
1,1
1,3
2,1
1,7
2,0
2,0
2,2
2,7
3,3
3,3
3,4
3,6
3,3
3,5
3,8
3,9
3,9
4,3
1,5
1,9
2,8
2,5
2,9
3,3
3,3
3,7
4,4
4,4
4,6
4,7
4,7
4,7
4,8
4,9
5,0
5,3
123456
bedroom
living room
garden
car
church
favourite pub
cellar
own house entry
schools
museum
main roads
shopping mall
park
market
public buildings
public transport
station
train station
evaluation (min=1; max=6)
high PCT
low PCT
public
semi-
public
semi-
private
private
rejection support
3,3
3,8
4,2
4,5
4,8
4,8
4,9
5,1
5,4
5,8
6,8
7,4
7,7
7,8
7,9
8,2
9,4
9,7
1,9
2,1
2,3
3,4
3,0
2,9
2,9
3,0
3,5
3,9
5,5
5,6
6,2
5,9
7,5
7,1
8,7
9,4
12345678910
need for safety need for privacy
(1=strong; 5=low) (6=low; 10=strong)
high PCT
low PCT
private
semi-
private
semi-
public
public
bedroom
living room
garden
car
cellar
church
favourite pub
ownhouse entry
museum
school
shopping mall
main road
market
park
public buildings
public transport
station
train station
“How Fear of Crime Affects Needs for Privacy Safety” - Acceptance of Surveillance Technologies in Smart Cities
39

All in all, there were significant differences in the
assessment of the relationship between safety and
privacy concerning both PCT groups. Concerning
private locations there were no differences between
both PCT groups, because both groups desired to
protect their own privacy at those locations.
Regarding semi-private locations, the low PCT
group had a significantly greater need for protecting
own privacy than the high PCT group for nearly all
semi-private locations, e.g. cellar (M
Low
=7.8;
SD=2.5; M
High
=5.9; SD=3.1; F(1,98)=10.7;p<0.01),
garden (M
Low
=8.2; SD=2.3; M
High
=7.1; SD=2.9;
F(1,98)= 4.7; p<0.05) or favourite pub (M
Low
=7.4;
SD=2.4; M
High
=5.6; SD=2.8; F(1,98)=11.8; p<0.01).
At semi-public locations there were significant
differences for all locations: for the low PCT group
privacy was more important, while the high PCT
group preferred safety, e.g. schools (M
Low
=5.4;
SD=3.2; M
High
=3.5; SD=2.6; F(1,98)=10.2; p<0.01),
main roads (M
Low
=4.9; SD=3.0; M
High
=2.9; SD=2.1;
F(1,98)=15.9; p<0.01). Concerning public locations,
the low PCT group had a significantly stronger need
for privacy, while the high PCT group strongly
favoured safety, e.g. train station (M
Low
=3.3;
SD=2.7; M
High
=1.9; SD=1.5; F(1,98)=10.3; p<0.01)
or public transport (M
Low
=4.2; SD=3.1; M
High
=2.3;
SD=1.9; F(1,98)=13.3;p<0.01).
6 DISCUSSION
This study revealed insights into acceptance patterns
regarding the use of crime surveillance technologies
in urban environments. In order to understand the
specific needs of a diverse resident population, we
examined the tolerance towards such technologies at
various public and private urban locations. The
results provide valuable insights for city planners
regarding an acceptable employment of crime
surveillance technologies at different locations in
urban environments, which consider individual
needs for privacy and safety.
6.1 Acceptance of City Surveillance
Surveillance technologies are accepted in those
locations in which crime threat is present. Crime
threat reports were higher in public spaces such as
train stations or parks, especially during nighttime.
Accordingly, conventional crime surveillance
technologies (i.e. CCTV systems), but also
conventional measures such as lighting are well
accepted - as long as they are visible and installed in
public spaces. Especially in urban transportation
hubs such as train stations, stations or main roads,
where a high number of people passes by,
surveillance technologies are strongly accepted.
Accordingly, a map or cartography of acceptable
locations for the acceptable installation of
surveillance technologies in urban environments can
be derived from our findings. A completely different
acceptance picture can be drawn for the acceptance
of surveillance technologies in private spaces. Here,
perceived crime threat is comparably low, and the
use of cameras or microphones for the surveillance
of private spaces is distinctly rejected. Instead,
lighting and motion detectors are the only accepted
measures. However, this finding does not allow
jumping to the conclusion that surveillance
technologies in private space are rejected in general.
Combined with different functionalities than crime-
stopping functions, surveillance technologies already
have entered private spaces, e.g. webcams for
medical monitoring or “nanny- or mummy-cams”
(Kientz et al., 2007). Moreover, the context-
specificity of technology-acceptance was already
shown for wireless technologies either used for ICT-
or for medical monitoring purposes (Himmel et al.,
2013). Future studies will have to investigate in
more detail the effects of usage context and
“monitoring target” (myself or others) on the
acceptance of surveillance technologies.
6.2 Influential Factors on Crime
Surveillance Technology
Acceptance
The assessment of individual privacy and safety
needs provides an explanation for the identified
acceptance patterns. In public spaces, people have a
higher need for safety, i.e. they “sacrifice” their
privacy rights for a higher safety from potential
crime assaults. In turn, in private spaces, where
perceived safety is higher, the need for privacy is
dominating. However, in the present study,
surveillance technology was operationalized as
“presence of a camera”, without giving information
about further processing or usage purposes of
recorded data. We assume, that this
operationalization is ecologically valid, since people
usually do not know, which of their actions are
monitored and how or for what purpose surveillance
data is further processed and used (Patton, 2000).
Accordingly, we doubt that people are fully aware of
potential privacy violations, which might occur
during the following data processing stages. A next
step of our research agenda is, to investigate the
effects of information about potential privacy
SMARTGREENS 2016 - 5th International Conference on Smart Cities and Green ICT Systems
40

violations of subsequent processing stages on
privacy perceptions and behaviour. Research on
privacy issues and user behaviour in social networks
showed, that people – although claiming to be aware
of their privacy rights – show a completely different
behaviour pattern, i.e. exposing huge amounts of
personal information (Debatin et al., 2009). Looking
at perceived barriers and benefits of crime
surveillance technologies, which might serve as
explanatory variables for acceptance, we were rather
surprised by the result pattern. Almost all benefit
items received comparable levels of affirmation,
which might be explained by a biased response
behaviour or by an insufficient item design. For
barrier-items we found a slightly more differentiated
result pattern. The barrier “being under general
suspicion” received the lowest affirmation in our
study. This is especially noteworthy, since the issue
of “general suspicion” is a widely used counter-
argument in research literature ethical implications
of surveillance technologies (e.g., Marx, 1998), but
is apparently not reflected in individual perceptions.
This result further indicates, that the ethical-
normative approach of technology acceptance
research needs to be complemented by a “user-
focused” perspective to derive implications and
design guidelines which meet public acceptance.
6.3 Effects of Perceived Crime Threat
User diversity in terms of different crime threat
levels is a crucial factor in the context of crime
surveillance acceptance. The contrast of people with
high and low crime fears shows – not surprisingly –
that crime surveillance measures and their related
benefits are more accepted by people with higher
fear levels. Interestingly, the two groups with high
and low crime fears did not differ in their age or
gender. There is not a hypothetically typical
distribution with mainly women and older people
who feel more threatened by crime than men and
younger people. The distribution of segmented PCT
groups indicates that nearly each city dweller could
be part of the group with a high PCT and that
perceived PCT should be the starting point for the
development of urban surveillance concepts.
Overall, the predominantly technology-centered
planning of infrastructural city concepts, without
integrating citizens into the decision-making
processes, seems not sufficient to cover persons’
attitudes regarding safety and privacy concerns in
the context of smart cities.
6.4 Limitations and Future Research
Our empirical research approach was provided
valuable insights into the acceptance of crime
surveillance technologies. Some methodological
issues should be taken into account, though.
First, some aspects have to be criticized in terms
of content. The very similar evaluation of perceived
benefits of crime surveillance showed that the item
content might have been too similar. For further
studies it would be desirable to use more specific
and tangible items concerning perceived safety
aspects, e.g. a quantifiable potential decrease in
criminality rates. The same applies for perceived
barriers of crime surveillance: participant’s feedback
showed that the queried items could be more
differentiated. In further studies more specifications
regarding privacy aspects will be examined
(different handling of recorded data, storage issues
or even face recognition). Concerning crime
surveillance technologies this study focuses on the
distinction between visible and invisible
technologies. Future studies should differentiate
between specific visible and invisible technology
types. Another note refers to the classification of
locations. Here, we assumed the classifications that
were made by the participants of previous focus
groups. The distinction between public and private
locations is comprehensive and uncontroversial,
whereas the difference between semi-public and
semi-private locations is rather small. Therefore, in
further studies a more precise definition of location
categories is necessary. Besides terms of content, for
further studies other methodological approaches
should be applied. Since four relevant attributes
(location types, safety aspects, privacy aspects and
technology type) were identified in this study, the
implementation of a conjoint analysis could be
useful to gain a deeper insight into the acceptance of
crime surveillance. This way, the relative
importance of different attributes could be
determined and the trade-off between safety and
privacy could be characterized precisely.
Also, some aspects concerning the sample could
be improved and continued in further studies: first,
the sample size of this study was rather small, so the
findings should be replicated in larger and more
representative samples, which contain a higher
number of men and a higher number of older
persons. To involve place of residence as a
hypothetically influencing variable, further samples
have to contain a higher number of people living in
rural areas. Finally, as this study only focuses
German city dwellers, our approach and findings
“How Fear of Crime Affects Needs for Privacy Safety” - Acceptance of Surveillance Technologies in Smart Cities
41

could be replicated in other countries to compare
crime surveillance needs and desires of city dwellers
of different countries and cultures.
A similar remark is directed to the flow of
refugees and emigrants from Arabic countries into
all parts of Europe. Under these conditions, where so
different cultural values and norms regarding
intimacy, protection needs as well as personal
nearness and distance meet if not clash, perceptions
of security might be different. Therefore, future
studies should replicate the findings.
A final note regards the development of
communal or political policies. Even though the
findings here do not allow the formulation of
concrete recommendations for the use of
surveillance technologies, still, the findings could be
integrated in the education of communal workers
which need to know both sides of the coin: security
for the individual and the commune as such but also
the respect of keeping privacy of the individual and
the commune.
REFERENCES
Arning, K., Ziefle, M. and Mühlhans, H., 2013a. Join the
ride! User requirements and interface design
guidelines for a commuter carpooling platform. In
Marcus, A. [ed.], Design, User Experience, and
Usability, Berlin Springer, pp. 10-19.
Arning, K., Kowalewski, S., and Ziefle, M., 2013b.
Modelling User Acceptance of Wireless Medical
Technologies. Wireless Mobile Communication and
Healthcare, 61, pp. 146–153.
Alsnih, R. and Hensher, D. A., 2003. The mobility and
accessibility expectations of seniors in an aging
population. Transportation Research Part A. Policy
and Practice, 37(10), pp. 903–916.
Baumer, T. L., 1978. Research on fear of crime in the
United States. Victimology, 3, pp. 254–264.
Blöbaum, A. and Hunecke, M., 2005. Perceived Danger in
Urban Public Space The Impacts of Physical Features
and Personal Factors. Environment and Behavior,
37(4), pp. 465–486.
Chattopadhyayr, D., Dasgupta, R., Banerjee, E, R. and
Chakraborty, A., 2013. Event Driven Video
Surveillance System using City Cloud. Proceedings of
the first International Conference on Intelligent
Infrastructure at the 47th Annual National Convention
Computer Society of India.
Covington, J. and Taylor, R. B., 1991. Fear of Crime in
Urban Residential Neighborhoods. Sociological
Quarterly, 32 (2), pp. 231–49.
Debatin, B., Lovejoy, J. P., Horn, A.-K., and Hughes, B.
N., 2009. Facebook and Online Privacy: Attitudes,
Behaviours, and Unintended Consequences. Journal of
Computer-Mediated Communication,15(1),pp.83–108.
Dickerson, A. E., Molnar, L. J., Eby, D. W., Adler G.,
Bédard, M., Berg-Weger, M., and Trujillo, L., 2007.
Transportation and Aging: A Research Agenda for
Advancing Safe Mobility. The Gerontologist, 47(5),
pp. 578–590.
Gumpert, G. and Drucker, S. J., 2001. Public boundaries:
Privacy and surveillance in a technological world.
Communication Quarterly, 49(2), pp. 115–129.
Himmel, S., Ziefle, M. and Arning, K., 2013. From Living
Space to Urban Quarter: Acceptance of ICT
Monitoring Solutions in an Ageing Society. In Kuroso,
M. (Ed.) Human-Computer Interaction. Users and
Contexts of Use, Berlin Springer, pp. 49-58.
Isnard, A., 2001. Can surveillance cameras be successful
in preventing crime and controlling anti-social
behaviours. Proceedings of the character, impact and
prevention of crime in regional Australia Conference,
Townsville, 2.-3.8.2001.
Kientz, J. A., Arriaga, R. I., Chetty, M., Hayes, G. R.,
Richardson, J., Patel, S.N., and Abowd, G.D., 2007.
Grow and Know: Understanding Record-keeping
Needs for Tracking the Development of Young
Children. Proceedings of the SIGCHI Conference on
Human Factors in Computing Systems, San José, CA,
30.4. - 3.5.2007, NY, USA, ACM, pp. 1351–1360.
La Vigne, N. G., Lowry, S. S., Markman, J. A., and
Dwyer, A. M., 2011. Evaluating the Use of Public
Surveillance Cameras for Crime Control and
Prevention. Final Technical Report. Washington, DC,
The Urban Institute.
Lewis, D. A. and Maxfield, M. G., 1980. Fear in the
Neighborhoods: an Investigation of the Impact of
Crime. Journal of Research in Crime and
Delinquency
, 17(2), pp. 160–189.
Loewen, L. J., Steel, G. D., and Suedfeld, P., 1993.
Perceived safety from crime in the urban environment.
Journal of environmental psychology,13(4), pp. 323-
331.
Marshall, R. D., Bryant, R. A., Amsel, L., Suh, E. J.,
Cook, J.M. and Neria, Y., 2007. The psychology of
ongoing threat: relative risk appraisal, the September
11 attacks, and terrorism-related fears. American
Psychologist, 62(4), p. 304.
Marx, G. T., 1998. Ethics for the new surveillance. The
Information Society, 14(3), pp. 171–185.
Patton, J. W., 2000. Protecting privacy in public?
Surveillance technologies and the value of public
places. Ethics and Information Technology, 2(3),
pp.181–187.
Plouffe, L., and Kalache, A, 2010. Towards Global Age-
Friendly Cities: Determining Urban Features that
Promote Active Aging. Journal of Urban Health,
87(5), pp. 733–739.
Scarborough, B. K., Like-Haislip, T. Z., Novak, K. J.,
Lucas, W. L., and Alarid, L. F., 2010. Assessing the
relationship between individual characteristics,
neighborhood context, and fear of crime. Journal of
Criminal Justice, 38(4), pp. 819–826.
Sheldon, B., 2011. Camera surveillance within the UK:
Enhancing public safety or a social threat?
SMARTGREENS 2016 - 5th International Conference on Smart Cities and Green ICT Systems
42

International Review of Law, Computers &
Technology, 25(3), pp. 193–203.
Smith, M. J. and Clarke, R. V., 2000. Crime and public
transport. Crime & Justice, 27, pp. 169-233.
Song, M., Tao, D., and Maybank, S.J., 2013. Sparse
Camera Network for Visual Surveillance – A
Comprehensive Survey. Cornell University.
Van Heek, J., Arning, K., and Ziefle, M., 2015. Safety and
privacy perceptions in public spaces: An empirical
study on user requirements for city mobility. In
Giaffreda, R., Caganova, D., Li, Y., Riggio, R., and
Voisard, A. (Eds.). Internet of Things 2014, LNICST
151, Springer Berlin Heidelberg.
Whitaker, R., 1999. The end of privacy: How total
surveillance is becoming a reality. Ney York, NY, The
New Press.
Wiecek, C. and Saetnan, A.R., 2002. Restrictive?
Permissive? The Contradictory Framing of Video
Survei-llance in Norway and Denmark, Norwegian
University of Science and Technology, Working Paper
4.
Ziefle, M., Schneider, C., Valeé, D., Schnettler, A.,
Krempels K.-H. and Jarke, M., 2014. Urban Future
outline (UFO) A roadmap on research for livable
cities. ERCIM News (N. 98): http://ercim-
news.ercim.eu/en 98/keynote-smart-cities.
Ziefle, M., and Wilkowska, W., 2015. What makes people
change their preferences in public transportation –
opinions in different user groups. In Giaffreda, R.,
Caganova, D., Li, Y., Riggio, R., Voisard, A. (Eds.).
Internet of Things 2014, LNICST 151, Springer Berlin
Heidelberg, pp. 137-144.
“How Fear of Crime Affects Needs for Privacy Safety” - Acceptance of Surveillance Technologies in Smart Cities
43
