
Privacy-preserving and IoT-capable Crowd Analysis and Detection of
Flow Disturbances for Enhancing Public Safety
Hans G. Ziegler
University of London, Birkbeck College, Malet St, London WC1E 7HX, U.K.
Adesso Schweiz AG, Bahnhaldenstrasse 7, 8052 Zürich, Switzerland
Keywords: Crowd Analysis, Critical Infrastructures, Critical Infrastructure Security, Pedestrian Flow Analysis, Internet
of Things, Safety Applications, Privacy-preserving Surveillance.
Abstract: This paper describes a solution for monitoring and detection of crowds and analysis of density structures
and movement characteristics, to enhance safety of citizens and security of critical infrastructures. The
system leverages the Internet of Things concept and heterogenous, energy efficient, networked sensors, with
support for wireless communication. Privacy protection, instant deployability and auto configuration are
hereby underlying core objectives. The solution, which will be described, comprises two novel distributed
crowd analysis algorithms, allowing on the one hand the localisation of critical areas within large crowds
and on the other hand the recognition of counter streams, which can cause severe impacts on the crowd flow
and movement velocity and which can transform crowding scenarios into threatening situations.
1 INTRODUCTION
Crowd analysis and modelling is a research area
with a long history involving a variety of disciplines.
Different types of surveillance systems have been
proposed in the past and analysis of person streams
and crowd densities are ongoing research topics.
However crowd surveillance for identification of
critical situations is a complex problem and
establishing a solution, taking into account the
majority of obtainable information (e.g. velocity,
density, movement directions, flow), can be
difficult. To process all the data a global solution is
necessary with an appropriate set of rules defined
and with observation in an integrated manner. There
seems to be still a lack of solutions, which take most
obtainable crowd parameters into account and
reason about the information in a comprehensive
way. Defining rules for identifying critical states of
dynamic crowds, which evolve over time and can
change their location, size, density structure,
direction composition and velocity properties within
a short time period, is difficult and requires detailed
information about the crowd. For example a density
analysis rule, which initiates an alert when a critical
density value is reached, will not be activated if the
average crowd density is low and only a small area
of the crowd exceeds the critical threshold.
Information about the intrinsic structure of the
crowd is needed here.
Video surveillance is a concerning topic in the
general public and societal acceptance and
perception of surveillance are delicate topics. Thus it
is of importance to develop solutions that have
privacy protection as an underlying objective, aiming
at respecting privacy of individuals as far as possible.
The main part of this paper is dedicated to crowd
analysis mechanisms, with the capability to perform
a density structure analysis to localise critical areas
inside of crowds and moreover to identify counter
streams, which were the main causes for related
mass disasters in the past. The mechanisms focus on
robust analysis of density structures and movement
patterns and are principal parts of a safety and
security solution, which was developed in the
context of the French-German research project
SAFEST (Baccelli et al., 2014). Additional
objectives of the developed system are intrusion
detection, identification of critical situations and
provision of crucial information to security
personnel using lightweight and networking-capable
sensors and devices. Privacy preservation is
addressed via specific cameras (e.g. infrared),
providing less information about persons,
application of a vertical camera perspective and
early-stage anonymisation in the data processing.
Ziegler, H.
Privacy-preserving and IoT-capable Crowd Analysis and Detection of Flow Disturbances for Enhancing Public Safety.
In Proceedings of the 5th International Conference on Smart Cities and Green ICT Systems (SMARTGREENS 2016), pages 55-62
ISBN: 978-989-758-184-7
Copyright
c
2016 by SCITEPRESS – Science and Technology Publications, Lda. All rights reserved
55

Figure 1: Infrared overhead camera recording.
2 RELATED WORK
In a wider sense on the one hand previous work
addressing pedestrian flow analysis, crowd
dynamics, modelling and simulation of pedestrians
(Helbing et al., 2000, Helbing et al., 1995,
Hoogendoorn et al., 2005, Schadschneider et al.,
2009) is related to this work, but also crowd density
estimation (Eiselein et al., 2013, Rahmalan et al.,
2006, Ma et al., 2004) and identification of crowd
anomalies (Mahadevan et al., 2010, Mehran et al.,
2009). More closely related are the concept by
Krausz and Bauckhage for realtime detection of
threatening situations in crowds (Krausz et al., 2011,
2012), the work for crowd anomaly recognition
based on the social-force model and video-analysis
and also the adoption of concepts from pedestrian
dynamics, which were used for the design of visual
tracking systems (Mehran et al., 2009).
Detection of dense crowds can be covered for
instance by anomaly recognition algorithms.
However analysis of inner density structures and
detection of flow disturbances were not covered yet
in previous work to the authors knowledge.
3 SOFTWARE PLATFORM
The requirements for the software platform in the
Safest-project includes the capability of processing
significant amounts of data from video and audio
monitoring devices with a low energy footprint and
the support for adding and connecting substantial
numbers of nodes to the system. In addition to the
video monitoring nodes, which require powerful
hardware, also light-weight nodes for intrusion
detection have to be supported by the system. The
support for heterogenous hardware is therefore a
requirement. To fulfil these requirements a specific
IoT middleware (RIOT) has been applied to ensure
reliable communication and connectability for
heterogenous sensing hardware.
The crowd analysis software is realised as a
component-based architecture, in which each
analysis functionality is encapsulated in its own
component. Each software component contains a
middleware for asynchronous communication with
other components, using the publish-subscribe
principle, and additionally encompasses a rule
engine with data stream analysis and reasoning
capabilities, inherited from temporal modal logic.
For each component a set of rules, such as
thresholds for critical density values, is defined and
observed by the respective rule engine. Critical
situations detected by components are
communicated and published as events to message
queues, to which other components can subscribe in
order to receive the events instantly. The underlying
component-based framework applied is the
Fraunhofer Knowledgefusion Toolkit (Kriegel et al.,
2013) and the communication platform is realised
using a Redis-infrastruture.
4 CROWD ANALYSIS
The crowd analysis components address the
following functionalities:
Density thresholds and value ranges, which are
predefined in the system, are applied to
measured values to detect critical or
unexpected situations.
Movement Directions of people are measured
and analysed via frequency distribution. The
distribution values are then compared with
expected values for respective directions. The
directions covered are the four cardinal
directions and the four inter-cardinal directions.
Counter Streams which can cause severe
disturbances in pedestrian flows and tend to
have a significant velocity-decreasing effect are
identified and located and as corresponding
event information made available.
Velocities of moving people are determined
and compared with expected values, allowing
to detect escape scenarios or unexpected
velocity distributions in general.
Flow density and velocity values are compared
to a density-velocity graph by definition of an
SMARTGREENS 2016 - 5th International Conference on Smart Cities and Green ICT Systems
56
integral in the surrounding of the graph, to
assess flow characteristics.
Due to the extent only density analysis and counter
streams will be covered here.
5 DENSITY STRUCTURE
ANALYSIS
In this section a comparison of two technical
approaches will be described, which was performed
in order to determine an appropriate algorithm for
accurate identification of crowds and for analysis of
intrinsic structures. The two approaches are data
clustering and image contouring. The density
structure is important to assess crowds with respect
to criticalness. The capability to localise a crowd is
important, however to detect threatening high-
density areas inside of low-average-density crowds,
knowledge about the composition is needed.
5.1 Clustering Algorithms
The datasets that were constructed for comparing
and applying clustering algorithms represent
density-centric, arc-shaped and homogenous low-
density crowds.
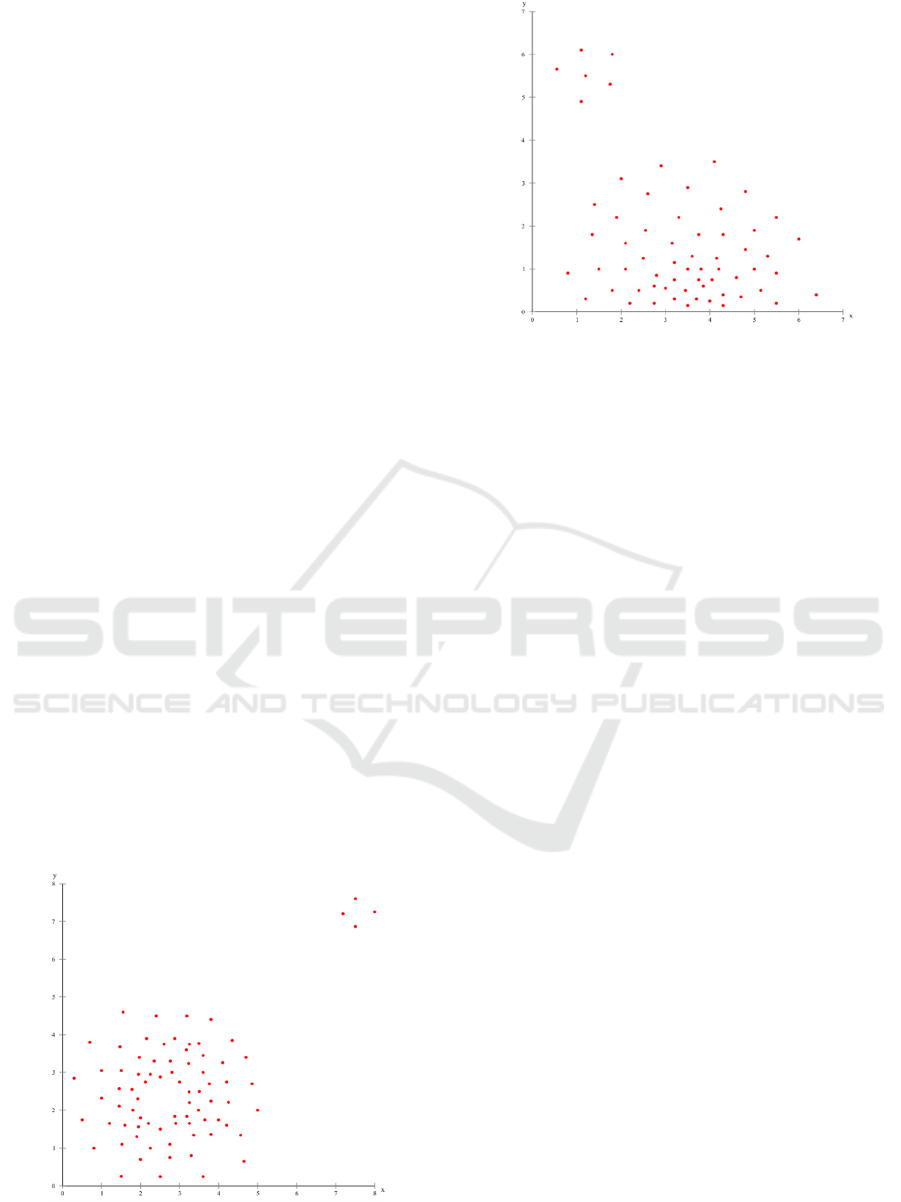
The first crowd type has a centric structure (Fig.
2) and has been chosen, since crowds with high-
density values towards the center and lower density
in the outer area tend to appear often in real life with
significantly varying sizes, often with only small
high-density regions, sometimes with larger regions
in relation to the overall area size. To detect low-
density areas as separate clusters is an important
requirement to make judgments. Pedestrians
Figure 2: Centric formation.
Figure 3: Arc-shaped formation.
standing near to the crowd but not belonging to it
also need to be recognised as such. Often crowds are
formed around columns, obstacles or barred areas
and appear in the pedestrian coordinate data as
holes.
The second crowd type is arc-shaped (Fig. 3) and
contains a high-density region, opposed to the
previous example, in the outer area. Hence the high-
density area is not fully surrounded by a lower
density structure. This type of crowd also appears
often in real life, such as in front of blocked exits,
narrow pathways or doors with insufficient flow
capacities. The difficulty here is to detect the low-
density area together with the high-density area as
one single crowd. Moreover algorithms that look for
certain distributions, such as Gaussian, now face the
difficulty that the distribution is not continuous at
one side.
In the third formation three homogenous low-
density pedestrian groups of the same shape and
geometry were chosen. These were defined, as here
the density distribution is flat, which might be
relevant for distribution-based algorithms. Also due
to the flat density distribution neither dense areas
nor any density transitions do exist, which might be
of relevance for density-based algorithms.
The types of clustering algorithms that were
considered include partitioning methods, density-
based clustering, hierarchical density-based
clustering and distribution models. Thus a broad
range of conventional clustering algorithms as well
as advanced algorithms are applied. For each
clustering type a representative algorithm was
chosen. The respective selections are KMeans
(MacQueen, 1967), DBSCAN (Ester et al., 1996),
Expectation-Maximization (Moon, 1996) and
OPTICS (Ankerst, 1999), which will be described
briefly in the following. KMeans is an conventional
Privacy-preserving and IoT-capable Crowd Analysis and Detection of Flow Disturbances for Enhancing Public Safety
57
partitioning algorithm, which calculates iteratively
cluster means and associates data to the cluster with
the closest mean. Data are assigned to Voronoi cells.
The algorithm DBSCAN is based on the density of
data points and is especially for density-based
clustering problems appropriate. It requires for each
point p a cluster ࣝ to have at least a minimum
number MinPts of points q within its neighbourhood
of radius ߳. DBSCAN utilizes the concept of
density-reachability. The algorithm Expectation-
Maximization determines maximum likelihood
values for models involving latent variables. It is an
iterative method which can be applied to different
mathematical models, however is computationally
expensive. In the context of this work it will be
applied to a Gaussian mixture model. The fourth
algorithm investigated is called OPTICS, which is a
hierarchical density-based clustering algorithm that
creates an ordering of the data and determines
information about intrinsic cluster structures.
In the following the results of the analysis will be
described.
1. Centric Crowd: For the first dataset, which
involves a centric crowd structure, the following
results were obtained: KMeans did not detect the
two clusters correctly. This is due to the fact that it
partitions the data into Voronoi cells based on the
centroids, which however did not move to the
location to represent a correct data assignment to the
clusters. DBSCAN and Expectation-Maximization
in contrast detected the clusters correctly. The
missing data points in the center did not cause
difficulties here. OPTICS recognised clusters and
inner density structures however not with the
required accurateness. The two main clusters here
were not separated sufficiently.
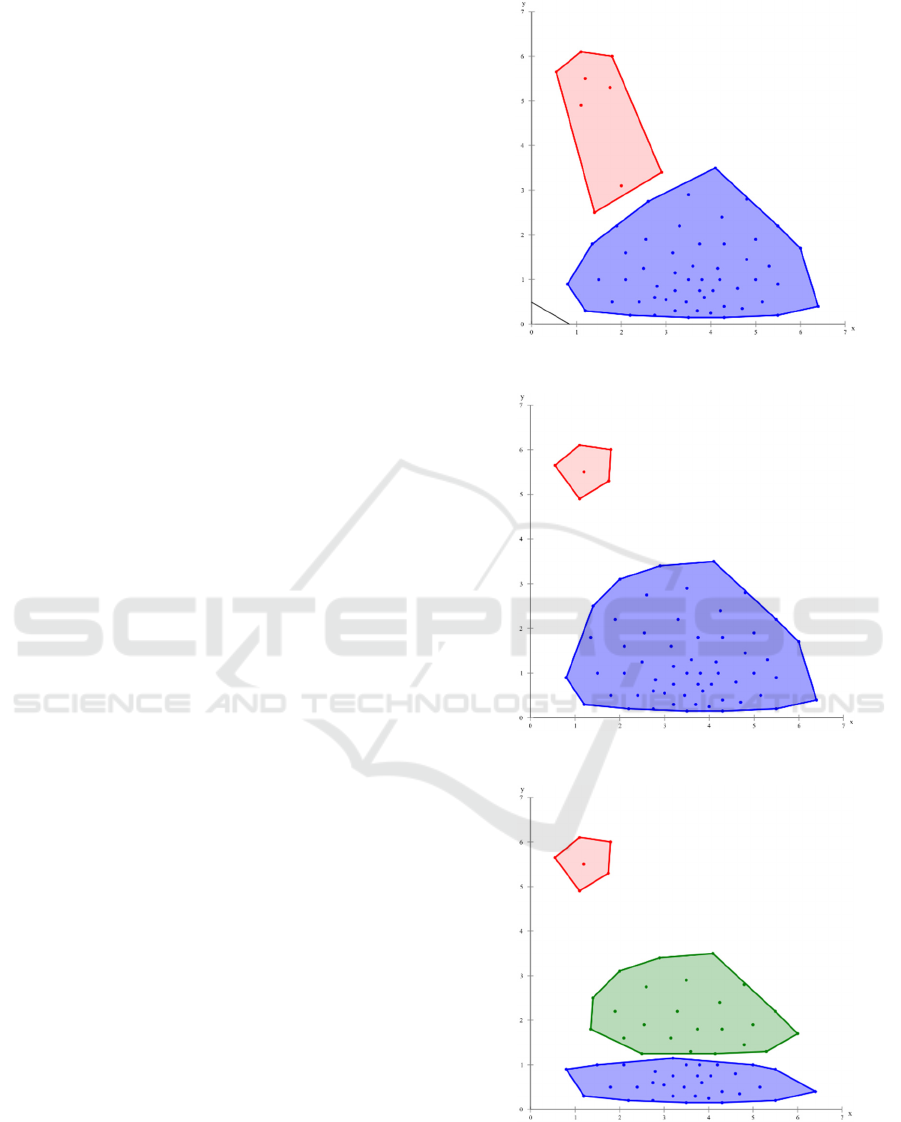
2. Arc-Shaped Formation: For the arc-shaped
dataset KMeans did not identify the clusters in a
sufficient way. DBSCAN and Expectation-
Maximization detected the clusters appropriately. As
shown in the illustration for the EM-clustering the
number of clusters k was set to 3, resulting in three
clusters with different densities. If k is set to 2, EM
returns the same clusters as DBSCAN. OPTICS
created a cluster hierarchy however the results are
not satisfying by means of density structures. In the
figures 4-7 the results are illustrated for this
scenario.
Figure 4: KMeans.
Figure 5: DBScan.
Figure 6: Expectation-Maximization.
SMARTGREENS 2016 - 5th International Conference on Smart Cities and Green ICT Systems
58
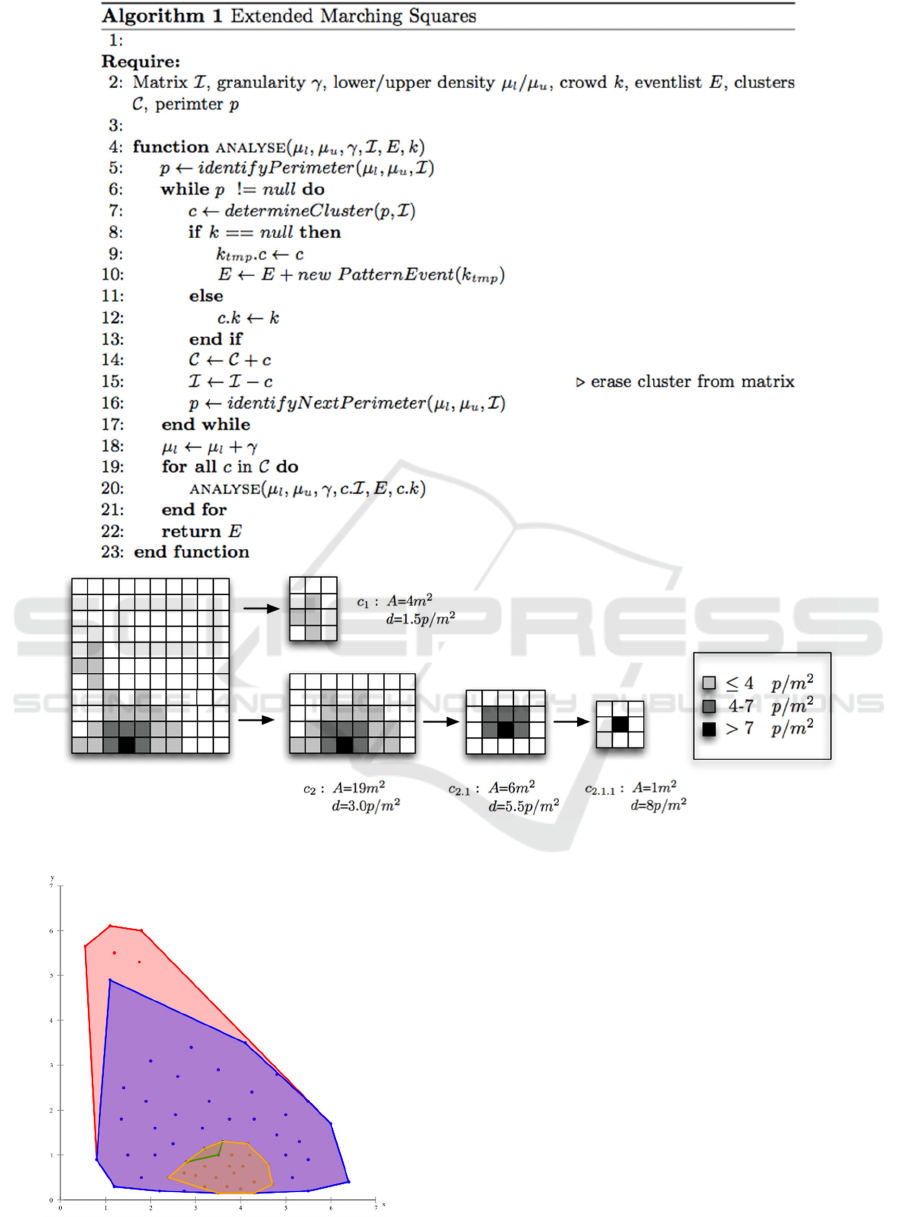
Figure 8: Recursive interval-based Marching-Squares.
Figure 7: OPTICS.
3. Low-Density Clusters: The results for the third
scenario, which are not illustrated here, KMeans,
DBSCAN and Expectation-Maximization detected
and differentiated the three clusters correctly. The
algorithm OPTICS however did not identify the
clusters sufficiently for the chosen parameters.
Once the data clusters have been formed, the hull
of the cluster, the size and the average density are
determined as this information is decisive for further
event processing, decision making and alerting. To
determine the hull an algorithm implementing
DeLaunay-triangulation is applied, Afterwards the
area size and the person density are calculated.
Limitations: As the results demonstrated,
clustering algorithms are appropriate to detect
crowds in a given set of pedestrian coordinates.
Privacy-preserving and IoT-capable Crowd Analysis and Detection of Flow Disturbances for Enhancing Public Safety
59
However the analysis of intrinsic density structures
causes some difficulties and the clustering results
were not fully suffcient for this particular criterion.
5.2 Image Contouring - Adapted
Marching Squares
Alternatively to data clustering also image
contouring methods were investigated, in particular
the Marching Squares algorithm. Initially the
pedestrian coordinates are transformed to a 2-
dimensional density map, which is composed of
cells representing the respective number of persons
in it. On the basis of the original Marching Squares
various modifications and extensions had to be
made. This includes the capability to specify a
specific person-density interval and a granularity
parameter for the degree of accuracy of the density
structure. Additionally the algorithm had to be
changed to support recursion and to support its
infinite application to detected crowds to identify
dense areas inside of the crowds. The algorithm
requires a different set of input parameters and
returns a list of pattern-events which contain meta-
information about the identified crowd, including
sub clusters with information about average-density,
area size, location and number of persons.
Opposed to the clustering algorithms this
solution also permits inner structure analysis in a
configurable and customisable way and to
decompose crowds, revealing decisive information
such as the location of dense areas. In addition the
algorithm is robust and especially appropriate for
application on low-power platforms with limited
processing capabilities and resource constraints, as it
is computationally inexpensive.
Figure 8 shows the application of the algorithm
to scenario 2 involving an arc-shaped formation. The
algorithm begins with a low density interval and
identifies corresponding paths. The result of the first
call are the clusters c
1
and c
2
including
corresponding meta-information. After the first call
the density interval will be increased by the
specified granularity level and now applied to all
previously detected clusters, in this case c
1
and c
2
,
which were extracted and transformed to a separate
matrix. Within c
2
a sub-cluster c
2.1
is detected, which
is again analysed. The call-sequence ends with the
identification of cluster c
2.1.1
.
6 COUNTER STREAMS AND
FLOW DISTURBANCES
Pedestrian counter streams within moving crowds,
which can be caused by single persons or groups of
people, moving into an opposite direction of the
crowd, can decrease the movement velocity
substantially and can cause severe congestions. In
past crowd disasters such as the Loveparade 2010 in
Duisburg (Krausz et al., 2010) or in Mecca 2006
(Helbing et al., 2007) counter streams had occurred
and had a negative impact on the situations.
In the following a monitoring and analysis
component will be described, which is part of the
above described system and which is capable of
revealing disturbances in person flows and to
localise counter streams. The component interacts
with the crowd-analysis component and is notified
upon detection of critical events, involving low
movement velocities or dense areas. Upon reception
of a critical event the crowd data will be analysed by
application of the clustering algorithm DBSCAN.
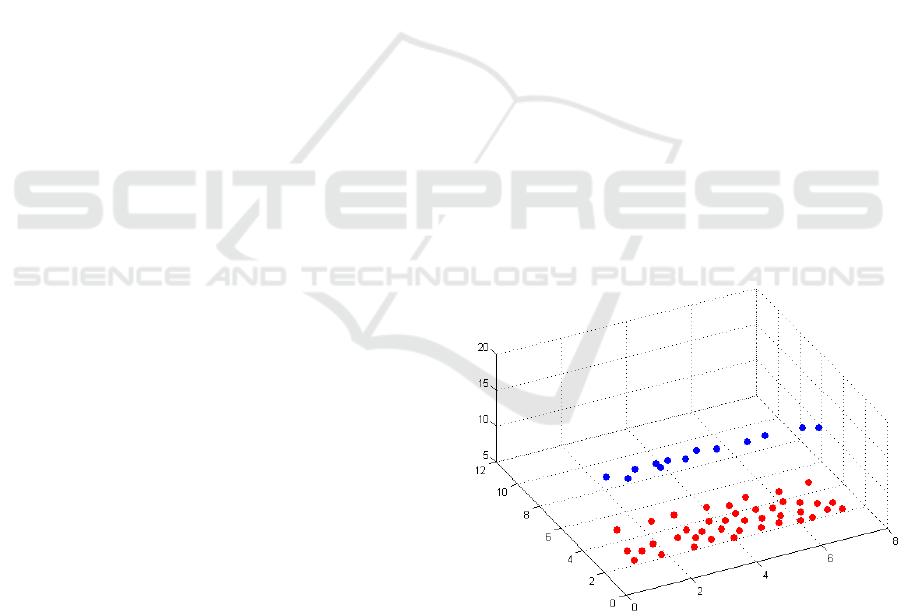
The processed data contains three dimensions,
which area the person coordinates x and y and the
movement direction z. The information is pre-
processed and normalised in a next step, so that data
can be clustered in a robust way and data involving
opposite movement directions are separated
accordingly (Fig. 9).
Figure 9: Counter stream detection: 3D-DBScan
clustering.
After creation of clusters the hulls are computed
using Delaunay hull detection and then area size and
locations are analysed.
SMARTGREENS 2016 - 5th International Conference on Smart Cities and Green ICT Systems
60
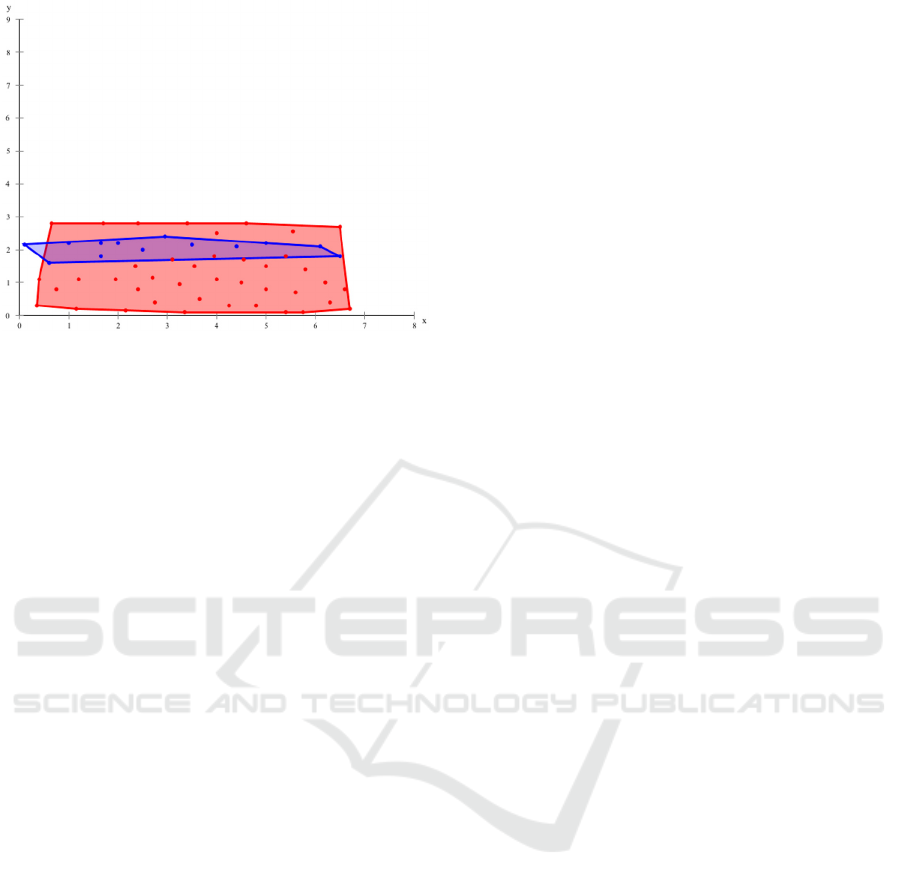
Figure 10: Counter stream detection: Delaunay hull
identification.
In the next step rules with corresponding threshold
values are applied, assessing severity by person
quantity limits and velocity thresholds. Regarding
the location it is differentiated between counter
streams at the borders with only one disturbance side
and streams with two disturbance sides, causing a
stronger impact. In the final step the computed meta
information is aggregated into an event and
published on the respective message channel, to
which other system components can listen.
7 CONCLUSIONS AND
OUTLOOK
In this paper a comparison of different clustering
algorithms was demonstrated for robust and
performant detection of crowds and analysis of
density structures. The clustering results were
satisfying for the detection, but not for structure
analysis. A recursive image-contouring algorithm
was developed on the basis of the Marching Squares
algorithm and 2D density grids, which has the
capability to analyse intrinsic structures in a
customisable way, making it possible to identify
critical areas inside of crowds. Moreover a novel
analysis component has been described for
identification of flow disturbances, in particular
counter streams, and emission of corresponding
events, which can be received by listening
components. It supports rapid deployability on
smart-nodes and light-weight platforms and is
capable of being integrated into distributed
surveillance systems.
ACKNOWLEDGEMENTS
This work was partially funded by the Federal
Ministry of Education and Research (BMBF).
Special thanks goes to the members of the SAFEST
project consortium and especially to the Fraunhofer
Institute FOKUS, where significant parts of the
work were performed.
REFERENCES
D. Helbing, I. Farkas, & T. Vicsek. Simulating dynamical
features of escape panic. Nature, 407(6803), 487-490,
2000.
E. Baccelli, G. Bartl, A. Danilkina, V. Ebner, F. Gendry,
C. Guettier, O. Hahn, U. Kriegel, G. Hege, M. Palkow,
H. Petersen, T.C. Schmidt, A. Voisard, M. Whlisch,
H. Ziegler. Area & Perimeter Surveillance in SAFEST
using Sensors and the Internet of Things. Proceedings
of the French Interdisciplinary Workshop on Global
Security (WISG), Troyes, France, 2014.
R. Mehran, A. Oyama, and M. Shah. Abnormal crowd
behavior detection using social force model. In CVPR,
2009.
D. Helbing, & P. Molnar. Social force model for
pedestrian dynamics. Physical review E 51(5), 4282,
1995.
S. P. Hoogendoorn, & W. Daamen. Pedestrian behavior at
bottlenecks. Transportation Science, 39(2), 147-159,
2005.
A. Schadschneider, W. Klingsch, H. Klpfel, T. Kretz, C.
Rogsch, & A. Seyfried. Evacuation dynamics:
Empirical results, modeling and applications. In
Encyclopedia of complexity and systems science (pp.
3142-3176). Springer New York. 2009.
B. Krausz & C. Bauckhage. Automatic detection of
dangerous motion behavior in human crowds. AVSS,
2011.
B. Krausz, & C. Bauckhage, Loveparade 2010: Automatic
video analysis of a crowd disaster. CVIU, p. 307-319,
2012.
M. Ester, H. P. Kriegel, J. Sander & X. Xu. A density-
based algorithm for discovering clusters in large
spatial databases with noise. KDD. Vol. 96. 1996.
J.B. MacQueen. ”Some methods for classification and
analysis of multivariate observations”. 5th Berkeley
Symposium on Mathematical Statistics and
Probability, pp. 281-297. 1967.
M. Ankerst, M. M. Breunig, H. P. Kriegel & J. Sander.
Optics: Ordering points to identify the clustering
structure. SIGMOD Vol. 28, No. 2, pp. 49-60. 1999.
T.K. Moon.The expectation maximization algorithm.
Signalprocessing magazine, 13(6), 47-60. 1996.
V. Eiselein, H. Fradi, I. Keller, T. Sikora & J. L. Dugelay.
Enhancing human detection using crowd density
measures and an adaptive correction filter. In AVSS,
pp. 19-24, 2013.
Privacy-preserving and IoT-capable Crowd Analysis and Detection of Flow Disturbances for Enhancing Public Safety
61

H. Rahmalan, M. S. Nixon & J. N. Carter, J. N. On crowd
density estimation for surveillance. In Crime and
Security, IET, pp. 540-545, 2006.
R. Ma, L. Li, W. Huang & Q. Tian. On pixel count based
crowd density estimation for visual surveillance. In
Cybernetics and Intelligent Systems, Vol. 1, pp. 170-
173. 2004.
V. Mahadevan, W. Li, V. Bhalodia & N. Vasconcelos.
Anomaly detection in crowded scenes. In CVPR, pp.
1975-1981, 2010.
E. U. Kriegel, S. Pfennigschmidt & H. G. Ziegler.
Practical aspects of the use of a Knowledge Fusion
Toolkit in safety applications. In Autonomous
Decentralized Systems. ISADS, pp. 1-4, 2013.
C. M. Bishop. Pattern recognition and machine learning,
Springer, Singapore, p. 439, 2006.
J. L. Carlson, Redis in Action, Manning Publications,
ISBN: 9781617290855, 2013. 26.
D. Helbing, A. Johansson, and H. Z. Al-Abideen.
Dynamics of crowd disasters: An empirical study.
Physical Review E 75(4):04610917, 2007.
SMARTGREENS 2016 - 5th International Conference on Smart Cities and Green ICT Systems
62
