
Extracting Navigation Hierarchies from Networks
with Genetic Algorithms
Stefan John
1
, Michael Granitzer
1
and Denis Helic
2
1
Chair of Media Computer Science, University of Passau, Passau, Germany
2
Knowledge Technologies Institute, Graz University of Technology, Graz, Austria
Keywords:
Decentralized Search, Genetic Algorithm, Optimization, Heuristic, Network Hierarchy.
Abstract:
Information networks are nowadays an important source of knowledge, indispensable for our daily tasks.
Because of their size, however, efficient navigation can be a challenge. Following the idea to use network
hierarchies as guidance in human as well as algorithmic search processes, this work focuses on the creation of
optimized navigation hierarchies. Based on an established model of human navigation, decentralized search,
we defined two quality criteria for network hierarchies and propose a genetic algorithm applying them. We
conducted experiments on an information as well as a social network and analyzed the optimization effectivity
of our approach. Furthermore, we investigated the structure of the resulting navigation hierarchies. We found
our algorithm to be well-suited for the task of hierarchy optimization and found distinct structural properties
influencing the quality of navigational hierarchies.
1 INTRODUCTION
Although the Internet has become the primary plat-
form of information retrieval and social interaction
only over the last years, the analysis of human nav-
igation in networks in general and the Internet in par-
ticular has been part of scientific research for several
decades already. One of the most famous publications
initiating the research on social networks is Milgram’s
small-world experiment (Milgram, 1967), which led
to two assumptions. First, social networks are struc-
tured in a way that arbitrarily chosen people are con-
nected by short chains of relationships, a property re-
ferred to as the “small world phenomenon”. And sec-
ond, humans are able to find these short paths among
the nearly endless number of possible routes.
Incited by these results, a lot of effort was put into
analyzing human navigation in networks. Describing
the navigational concept applied in Milgram’s exper-
iment, Kleinberg formed the notion of decentralized
search and investigated the human ability to find short
paths to arbitrary people in social networks (Klein-
berg, 2000a; Kleinberg, 2000b; Kleinberg, 2002).
Along with analyzing “the structure of networks in
which this phenomenon emerges” (Kleinberg, 2002),
Kleinberg showed that using additional hierarchical
knowledge, decentralized search can efficiently be
used to navigate in such networks, suggesting the
existence of human hierarchical background knowl-
edge.
Based on this insight, Adamic and Adar imple-
mented a decentralized search algorithm using back-
ground knowledge for its greedy navigation (Adamic
and Adar, 2005). Feeding their implementation with a
naturally existent hierarchy (the hierarchical structure
of an organization), they were able to confirm Klein-
berg’s theoretical findings. Additionally, they found
their algorithm to be less efficient using background
knowledge which could not be represented as a hi-
erarchy, further pointing out the importance of hier-
archical structures for both, algorithmic and human
navigation processes. Since then, various studies have
shown humans to be efficient navigators in social as
well as information networks. Unfortunately, our lim-
itation of knowledge sometimes hinders us from tak-
ing shortcuts, slowing down search processes.
Problem. Previous research has shown that back-
ground knowledge and in particular a hierarchical
background knowledge is of primary importance in
human navigation in networks. Traditionally, in infor-
mation systems category hierarchies are often used to
support user navigation. Although the goal of these
hierarchies is to support navigation they are typically
optimized for semantics. Previous work has shown
that semantically optimal categories often posses de-
sirable navigational properties—at least in the domain
John, S., Granitzer, M. and Helic, D.
Extracting Navigation Hierarchies from Networks with Genetic Algor ithms.
In Proceedings of the 12th International Conference on Web Information Systems and Technologies (WEBIST 2016) - Volume 2, pages 63-74
ISBN: 978-989-758-186-1
Copyright
c
2016 by SCITEPRESS – Science and Technology Publications, Lda. All rights reserved
63

of social tagging systems (Strohmaier et al., 2012).
However, the question if and how these results can
be generalized to other information networks still re-
mains an open one in our community.
Objective. Therefore, in this work, we take another
approach for obtaining navigationally sound hierar-
chies. We aim for automatic extraction of hierarchies
while optimizing their navigational properties. The
final goal of our work is to enhance navigational sup-
port for users by embedding such navigationally opti-
mal hierarchies in a typical user interface of an infor-
mation system.
Approach. To that end, we develop an approach for
evaluating navigational properties of hierarchies. We
base our approach on optimization of shortest paths
between arbitrary pairs of nodes in extracted hierar-
chies. To tackle the complexity of the optimization
problem we resort to a genetic algorithm for which
we develop a novel crossover rule. Finally, we illus-
trate our approach by performing experiments on real
datasets.
Contributions. With our work we make the follow-
ing three contributions:
1. A methodology for assessing the quality of navi-
gational network hierarchies.
2. An algorithmic approach for the creation of opti-
mized navigation hierarchies.
3. Novel insights about the structure of navigation-
ally good hierarchies.
An implementation of the algorithmic approach is
publicly available at GitHub
1
.
2 RELATED WORK
In recent years, several studies have investigated the
relationship of decentralized search and human nav-
igation in networks. For our work, especially those
dealing with information networks were of interest.
2.1 Decentralized Search
With regard to navigation in networks, this work fo-
cuses on the concept of decentralized search first for-
malized by Kleinberg (Kleinberg, 2000b). Accord-
ingly, a search starting at node s of a network has to
be performed without global knowledge of the net-
work. In order to reach a target node t, only local
information may be used. This comprises knowledge
of the direct neighbors of the currently visited node as
1
https://github.com/Leative/STOA (Feb. 2016)
well as some intuition about their distance to the tar-
get. Limited to local decisions, decentralized search
is an iterative process. In each step, the search pro-
gresses by greedily selecting the neighbor closest to
the target.
In the hierarchical network model introduced by
Kleinberg (Kleinberg, 2002), a hierarchy of the stud-
ied network is used to measure distances. The length
of a shortest path connecting two nodes in that hierar-
chy determines their distance. Therefore, each greedy
step of a search depends on the nodes “proposed” by
the hierarchy. Assuming the existence of a hierarchi-
cally structured background knowledge, this model
can be applied to human search processes.
2.2 Model of Human Navigation
Gamifying the navigational concept of decentralized
search, West and Leskovec studied human navigation
in an online game
2
based on Wikipedia (West and
Leskovec, 2012). Their work confirms that the effi-
ciency of human navigation is not limited to social
networks, but that we are also able to find short paths
in information networks. Furthermore, it shows that
people tend to visit network nodes of high degree,
called hubs, in early stages of a search before clos-
ing in on the target.
Going one step further, Trattner et al. tried to
model the observed human behavior using a de-
centralized search algorithm (Trattner et al., 2012).
Based on the ideas of Adamic and Adar (Adamic
and Adar, 2005), their approach relies on hierarchi-
cal background knowledge to determine the distance
of nodes. To that end, they used two different types
of hierarchies. Their results show that, paired with
their algorithm, hierarchies built directly from the link
structure of the underlying network are better suited to
simulate human navigation than hierarchies built from
external knowledge (like an existing semantic catego-
rization). However, using such hierarchies, their al-
gorithm slightly outperforms the human counterpart.
Helic et al. continued with this study by extending
the greedy mechanism of pure decentralized search
with stochastic decision processes (Helic et al., 2013).
They invented a new selection mechanism for decen-
tralized search, called decaying ε-greedy action se-
lection. Applying this selection mechanism instead
of simple greedy navigation, hierarchical decentral-
ized search proves to be well suited for modeling hu-
man navigation. Picking up on the results of West
and Leskovec (West and Leskovec, 2012), they also
investigated the development of human search paths
and conclude that human navigation can roughly be
2
http://www.wikispeedia.net (Oct. 2015)
WEBIST 2016 - 12th International Conference on Web Information Systems and Technologies
64

divided into two stages. Starting with an orienta-
tion phase, referred to as exploration, people try to
reach familiar nodes. In this stage, while trying to
reach hubs, humans are more likely to perform ran-
dom decisions on where to go next. In later steps,
however, as people become more confident in their
background knowledge, they switch to exploitation,
efficiently following their intuitions more often.
The above insights suggest that a the efficiency of
human navigation may be increased by, for example,
shortening the exploration phase. Intuitively, this can
be achieved by offering additional hierarchical infor-
mation extending the human background knowledge.
In current information networks, a semantic catego-
rization often serves as an additional layer of infor-
mation. However, category hierarchies do not con-
sider navigational properties of the underlying net-
work. Therefore, this work focuses on the extraction
of navigationally optimized hierarchies to further en-
hance the support of human navigation.
3 METHODOLOGY
In the following, a network is represented by an un-
weighted graph G(V, E) with V being the set of nodes
and E the set of edges of the network.
3.1 Hierarchy Creation
To our knowledge, the methods available to create
hierarchies for information networks can roughly be
split into two groups. Those following a probabilis-
tic approach (Clauset et al., 2008) and those trying
to uncover hierarchical structures inherently exist-
ing in the underlying network (Heymann and Garcia-
Molina, 2006; Muchnik et al., 2007). The latter, usu-
ally rely on some notion of structural or semantic gen-
erality in order to relate the hierarchies’ nodes to each
other. Although these methods have shown to be vi-
able for structural analysis or the generation of se-
mantic overviews, our work follows a different path.
Rather than retaining semantic or structural re-
lations, our approach seeks to optimize the quality
of the produced hierarchies with respect to definable
quality criteria. Relying on genetic algorithms, we
perform a global search on the set of possible hierar-
chies of a network. This approach allows for an easy
adaption to different use cases. By defining custom
quality criteria, the created hierarchies can be opti-
mized for the task at hand.
Focusing on the enhancement of human naviga-
tion, the quality criteria proposed in this work are
tailored towards the navigational optimality of hier-
archies. While most likely loosing structural infor-
mation of the original network, this optimization fa-
cilitates the application to human search scenarios as
well as algorithmic search processes based on hierar-
chical decentralized search.
3.2 Quality Criteria
In the context of decentralized search, efficiency can
be defined considering the length of the search path
used to succeed in a search. At the same time, an
agents success rate determines her effectivity. Ideally,
hierarchies created by our approach should increase
both, the efficiency as well as the effectivity of a nav-
igating agent.
In order to gain maximum effectivity, our created
hierarchies have to meet a simple constraint. To fa-
cilitate success regardless of the search scenario, each
pair of network nodes needs to be connected by at
least a single path in the hierarchy. For this reason,
we decided to restrict ourselves to spanning trees, for
which this property naturally holds. Besides being
optimal regarding search effectivity, this restriction
also vastly reduces the search space for our optimiza-
tion algorithm. As a drawback, however, to create
spanning trees on directed networks we had to treat
them as undirected.
As per above definition, improving the efficiency
of a search requires an agent, either man or machine,
to find a short path to the target. Intuitively, propos-
ing a node lying on a shortest path to the target in each
step of the search would yield unbeatable results. In
general, however, many edges of the underlying net-
work have to be sacrificed to create a meaningful hi-
erarchy. Thereby, a lot of shortest paths become un-
available. To counter this problem, our work proposes
two quality criteria for navigation hierarchies aimed
at preserving as many of the shortest paths of a net-
work as possible.
3.2.1 Global Stretch
For our first criterion, we resort to a measure used in
a similar context by Helic et al. (Helic et al., 2013)
and refer to it as global stretch. Given a spanning
tree T of a network N(V
N
, E
N
), for two nodes s and
t we compare their distance d
T
(s,t) in the tree with
their distance d
N
(s,t) in the network. In each case,
the distance is measured by the length of a shortest
path between s and t. We call this measure τ(s, t) the
local stretch (eq. 1). By averaging over all combi-
nations of network nodes, where n is the number of
nodes in the network, we get the global stretch (eq. 2).
Extracting Navigation Hierarchies from Networks with Genetic Algorithms
65

τ(s,t) =
d
T
(s,t)
d
N
(s,t)
, s 6= t (1)
τ(T ) =
1
n(n − 1)
∑
s,t∈V
N
s6=t
d
T
(s,t)
d
N
(s,t)
(2)
Although it does not make a general statement about
the quality of a solution, since we do not know the
possible optimum, global stretch enables us to com-
pare hierarchies.
3.2.2 Local Tree Fitness
Local tree fitness, is a bit more complex. Instead of
comparing complete paths, we consider the neighbor-
hood and the possible navigation steps proposed by
the hierarchy at each node. N(s) being the set of
neighbors of a node s in our network, we first have
to define two subsets of neighbors. Those which are
lying on a shortest network path from s to a target
node t (eq. 3) and those lying on a shortest path in the
evaluated tree (eq. 4).
M
N
= argmin
n∈N(s)
d
N
(n,t) (3)
M
T
= argmin
n∈N(s)
d
T
(n,t) (4)
Considering a human navigation being stuck at node
s, with these sets we can calculate the probability
f
L
(s,t) (eq. 5) that the spanning tree proposes a node
as the next navigation step which is lying on a short-
est path to target t in the original network. As we did
for stretch, we average over all source-target pairs to
gather the overall local tree fitness F
L
(T ), defined in
eq. 6.
f
L
(s,t) =
|
M
T
∩ M
N
|
|
M
T
|
(5)
F
L
(T ) =
1
n(n − 1)
∑
s,t∈V
N
s6=t
f
L
(s,t) (6)
4 OPTIMIZATION ALGORITHM
Both of the presented quality criteria consider short-
est paths, in general requiring computationally inten-
sive all pairs shortest path calculations to be con-
ducted on the studied network as well as on evalu-
ated hierarchies. However, restricting the hierarchies
to be spanning trees—thereby treating all networks as
undirected—simple breadth first search can be used
Population
Substitute population
Create offspring
Starting
Population
Created by DFS
Mutation
Alter parent relation
Crossover
Exchange random path
Selection
Roulette wheel + elite
Fitness
Quality criteria Parent relations
Encoding
Figure 1: Overview of the spanning tree optimization algo-
rithm (STOA).
for this purpose. Although this restriction also de-
creases the search space of our global search, the up-
per bound for the number of possible spanning trees
of a network with n nodes is still n
n−2
, according to
Caley’s formula. Therefore, optimizing the quality
of navigation hierarchies still constitutes a hard op-
timization problem.
Because of their versatility and modularity we de-
cided to tackle this problem by applying genetic al-
gorithms, a heuristic optimization approach. Genetic
algorithms mimic natural evolution processes. In par-
ticular, they follow Darwin’s theory of natural selec-
tion to optimize a population of solutions. Genera-
tion by generation, good individuals, hierarchies in
our case, are chosen to “breed” offspring, while bad
individuals are condemned to extinction.
Genetic algorithms are highly extensible and offer
several ways to allow this natural selection to hap-
pen. However, our spanning tree optimization algo-
rithm (STOA) mainly relies on the core components
of simple genetic algorithms as described by Gold-
berg (Goldberg, 1989). Figure 1 shows an overview
of our algorithm. The optimization process starts by
providing a starting population of solutions (hierar-
chies). In each iteration (generation) of the algorithm,
the fitness (quality) of all individuals of the current
population is evaluated. A selection mechanism cre-
ates an intermediate population from which random
matings are drawn. During the following reproduc-
tion step, the mated individuals are subject to two ge-
netic operators. Crossover, where parts of the genetic
information of the mates are interchanged and muta-
tion, randomly altering single “genes” of solutions. In
the following, the components of STOA are explained
in more detail.
4.1 Starting Population
The creation of a starting population is the first task
which has to be accomplished in order to run a ge-
netic algorithm. As proved by Lov
´
asz (Lov
´
asz, 1993),
random spanning trees could be generated with equal
probability by conducting random walks on the un-
derlying network. However, in large networks, ran-
WEBIST 2016 - 12th International Conference on Web Information Systems and Technologies
66

dom walks can take a considerably long time to visit
every node. For this reason, we chose a less ran-
dom, yet simple and fast approach. After selecting
a random node as root, a depth first search is con-
ducted, naturally generating a spanning tree. This
approach is biased towards linear spanning trees, i.e.
trees which are deep but not broad. Although leav-
ing room for improvement, we accepted this approach
to be sufficient for our study. Ultimately, the experi-
ments showed that our recombination and mutation
mechanisms can overcome the linearity in the first
few generations.
4.2 Fitness
In genetic algorithms a fitness function is used to de-
termine the fitness of individuals. Since our goal of
optimization was to produce hierarchies of high qual-
ity with regard to the defined quality criteria, these
quality criteria were also used as fitness functions for
the algorithm.
4.3 Encoding of Spanning Trees
In our use case, the hierarchies we want to optimize
constitute the solutions (individuals) the genetic al-
gorithm is working with. Similar to nature, solu-
tions in a genetic algorithm need to be defined by a
set of “genes“ on which changes can be performed.
This is usually done by choosing a proper encoding
rather than working directly on the parameters rel-
evant to the fitness function. We based the encod-
ing on the work of Carvalho et al. (Carvalho et al.,
2001). Considering a spanning tree to be rooted and
directed, we encode it by the set of parent relations of
its nodes. Each parent relation P(a, b), representing
an edge from a to b in the tree, can be considered a
gene, constituting the smallest alterable unit of a tree.
4.4 Roulette Wheel Selection with
Elitism
Being responsible for the selection of parents for the
reproduction, the selection mechanism is crucial for
every genetic algorithm. To this end, we rely on a
commonly used strategy, known as roulette wheel se-
lection. Enforcing survival of the fittest, individu-
als are chosen for an intermediate population with a
probability proportional to their fitness value. How-
ever, while being an intriguingly simple concept, this
purely probabilistic approach does not guarantee for
the best individuals to be selected. For this reason,
we extended the simple roulette wheel selection by
the concept of elitism.
With elitism, the best k individuals of a genera-
tion (where k has to be specified as a parameter) are
directly copied to the offspring, guaranteeing their ge-
netic information to be available in the next iteration.
Additionally, these individuals are still eligible for se-
lection.
4.5 Random Path Crossover
Working with spanning trees as individuals im-
poses two requirements on viable recombination al-
gorithms:
i) Spanning tree properties have to be preserved.
ii) Valuable partial structures of good trees should
not be destroyed.
Built upon their proposed encoding, Carvalho et al.
also presented a recombination algorithm, which sat-
isfies both of these requirements (Carvalho et al.,
2001). In the scenario of planning electrical dis-
tribution networks, which can also be formulated
as a spanning tree problem, their approach outper-
formed the combination of binary encoding and one-
point crossover (a standard approach for genetic algo-
rithms) as well as an approach of randomly generating
new spanning trees from the set of edges of the par-
ent trees. It also has shown to be effective in mov-
ing towards better solutions in both theoretical and
real world problems. Based on their work, we im-
plemented a crossover operator which we refer to as
random path crossover.
4.5.1 Mating
In random path crossover, pairs of trees are drawn
at random from the intermediate population created
by the selection mechanism. In case of an odd num-
ber of individuals in the population, the remainder of
this mating passes the crossover process unchanged.
Some approaches to genetic algorithms make use of
a crossover probability, i.e. there is a fixed chance
that a couple stays unaffected by crossover. As will
be shown in the next section, our process of inter-
changing genetic information is not guaranteed to
succeed. Inherent to the interchange algorithm, for
a pair of trees a slight chance already exists to not be-
ing changed by random path crossover. Therefore, we
decided to always apply crossover to all of the chosen
pairs, as a side effect reducing the effort needed for
parameterizing STOA.
4.5.2 Recombination
To recombine genetic information between the mated
individuals, random path crossover interchanges ran-
Extracting Navigation Hierarchies from Networks with Genetic Algorithms
67
1
2
5
34
1
5
4
32
2
5
4
1
5
4
32
2
5
4
1
5
4
32
5
4
1
5
4
32
(a) Valid crossover
1
2
5
34
1
5
4
32
4
5
1
5
4
32
4
5
1
5
4
32
(b) Invalid crossover
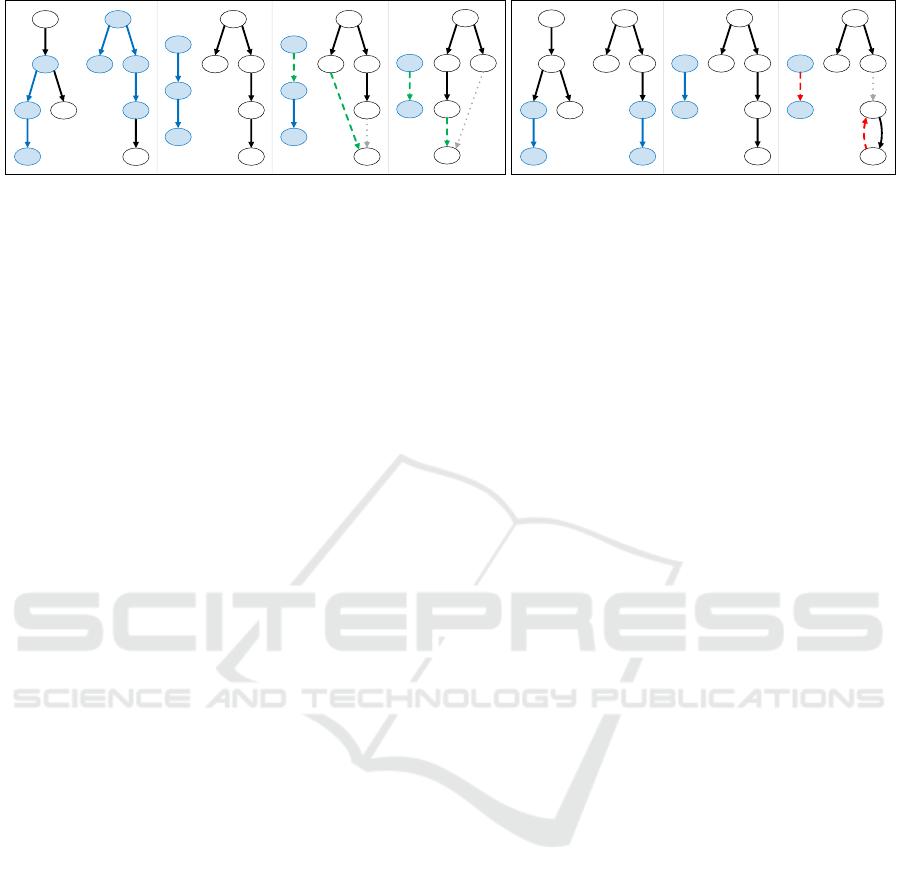
Figure 2: Concept of crossover. In the first section of each subfigure, a path between two nodes (blue filled nodes) is chosen
for both trees. Afterwards, crossover tries to inject the path of the first tree into the second one (gray dotted lines indicate the
original parent relation which is about to be substituted). While in subfigure (a) the injection succeeds for both path elements
(injected parent relations are depicted by green dashed lines), subfigure (b) shows an invalid try. Injecting the red dashed
parent relation would create a circle.
domly chosen paths of the trees. Originally, our en-
coding represents a spanning tree as a rooted tree and
therefore imposes a direction on its edges. To choose
paths, we have to abstract from this representation for
a moment and consider the parent relations to be undi-
rected. A path can then be defined by the parent rela-
tions connecting two nodes.
The algorithm randomly selects two nodes and
identifies the paths connecting them in both of the par-
ent trees. To exchange genetic information, the parent
relations defining the path of the first tree are injected
into the second tree (figure 2a) and vice versa. To pre-
serve the spanning tree properties, and thereby fulfill
requirement (i), each injection is tested and rejected if
substituting the parent relation would result in a cycle
(figure 2b). The order at which the crossover tries to
substitute the single relations of a path is important,
here. To avoid the rejection of valid paths, the parent
relations have to be substituted in ascending order of
their distance to the root, i.e. edges closer to the root
of a path’s tree have to be chosen first.
If a path is rejected during a recombination at-
tempt, the process is canceled and a new pair of ran-
dom nodes is chosen. This procedure is repeated until
either a couple of interchangeable paths is found or
a threshold of attempts is reached. In the latter case,
both trees are passed unchanged to the next step of the
genetic algorithm. Depending on the threshold, this is
usually a rarely occurring event.
By exchanging paths, random path crossover only
considers coherent structural units for the recombina-
tion of trees. In doing so, in accordance with the sec-
ond requirement (ii), structures responsible for a high
fitness are likely to either remain unchanged or to be
transferred to the partner tree.
4.5.3 Random Root Switching
Performing the above recombination, a path can never
be injected if it contains a parent relation where the
root node of the mated tree is the child. This can be
shown considering the following scenario. Let r be
the root of tree T
2
. Furthermore, let P(a, r) be the
parent relation found in the path chosen for tree T
1
.
During recombination, a will be chosen to substitute
the original parent of r in T
2
. Since r is the root, it is an
ancestor of all other nodes in T
2
. Therefore, selecting
any of the other nodes as parent of r results in a cycle,
which in turn is followed by the rejection of the path.
If the root nodes chosen for the initial population
are never changed during an evolution, this behav-
ior biases the exploration of the search space. Cer-
tain solution variants will be harder to generate than
others, due to the limited ways of combining mated
trees. Hence, before applying recombination, a new
common root node is chosen randomly for the mated
trees.
4.6 Random Edge Mutation
To prevent an early stagnation of the search, we im-
plemented a mutation operator suitable for spanning
trees. The genes of a tree, i.e. its parent relations, are
independently mutated with a fixed mutation proba-
bility, which can be set as parameter for the genetic
algorithm. Excluding the root of the tree, mutation of
a parent relation is done by randomly selecting a new
parent for the respective child node from the set of
its neighbors in the original network. Depending on
the actual structure of the spanning tree, not all of the
neighbors are valid choices. Mutation attempts which
would introduce cycles are ignored and, as long as
other neighbors are available, another parent is tried.
A relation remains unchanged if all neighbors were
tested without success. Similar to crossover, the order
in which parent relations are mutated influences the
outcome. To prevent any unwanted bias, the list of
parent relations is shuffled before applying mutation.
WEBIST 2016 - 12th International Conference on Web Information Systems and Technologies
68

5 EXPERIMENTAL SETUP
To analyze the effectivity of our approach and gain in-
sights on the structural properties of navigational hier-
archies, we conducted experiments with two medium
sized test networks. First, a condensed version of
Wikipedia, which was already part of the studies of
West et al. (West et al., 2009; West and Leskovec,
2012). Second, a sample of the Facebook network,
collected by McAuley and Leskovec in the course of
an analysis of social circles (McAuley and Leskovec,
2012). Both networks are offered by Stanford Uni-
versity as part of the Stanford Network Analysis
Project
3
. In the following we will refer to them just
as Wikipedia and Facebook network, respectively.
5.1 Parametrization Experiments
In order to gather the best possible hierarchies, we
conducted a series of parametrization experiments to
determine the settings needed to optimize the perfor-
mance of our genetic algorithm. Both of the test net-
works are known to be scale-free and to reveal a sim-
ilar structure. Hence, we based the parametrization
solely on the Wikipedia network. However, due to
the runtime of STOA being quadratically dependent
on the size of the input network, we used a network
sample to facilitate a meaningful number of optimiza-
tion runs within an acceptable period of time.
5.1.1 Sampling
To guarantee the representativeness of the sample, we
focused on retaining two measures of the original net-
work which we assumed to be highly influential for
the outcome of the fitness functions: its degree distri-
bution and its density.
Changing the distribution of node degrees influ-
ences the availability of shortest paths in the net-
work. Biasing the distribution towards lower degrees
for example, weakens nodes of relatively high degree
(known as hubs), which are important connectors and
might lie on many shortest paths. This bias is likely to
lead to a higher average length of shortest paths which
in turn are the basis of the fitness evaluation.
The density for an undirected network N with
n nodes and m edges, in accordance with Wasser-
man (Wasserman, 1994), is defined by eq. 7.
density(N) =
2m
n(n − 1)
(7)
It reflects how many of the possible edges are actu-
ally present in the network. In relative terms, a lower
3
http://snap.stanford.edu (Oct. 2015)
density means less available edges. This in turn can
also negatively affect the average length of shortest
paths. An extreme example to demonstrate this effect
is that of a spanning tree of a complete network, i.e. a
network where all pairs of nodes are connected by an
edge. Containing only n −1 edges, almost all shortest
paths of the original network (having a length of one)
are lost and substituted by longer paths.
Furthermore, working with spanning trees, con-
nectedness of the underlying network is a hard con-
straint. Accordingly, the generated sample had to
be connected to be useable with STOA. Consider-
ing this restriction and our measures, we implemented
and compared three sampling concepts. A bare ran-
dom walk as discussed by Leskovec and Falout-
sos (Leskovec and Faloutsos, 2006). An induced ran-
dom walk, inspired by the TIES algorithm proposed
by Ahmed et al. (Ahmed et al., 2011), adding addi-
tional edges to the sample in an induction step. And a
random deletion method similar to the one described
by Krishnamurthy et al. (Krishnamurthy et al., 2005).
For each algorithm we considered five different
sample sizes and conducted ten sampling runs for
each combination. Without going into detail here,
we found the random deletion implementation to be
most effective in retaining the original degree distri-
bution. For sample sizes of at least 500 nodes (about
9% of the network size), it also showed reasonably
good results with regard to the density. Hence, for our
parametrization we used the best sample generated by
this method.
5.1.2 Parametrization
We first had to decide on the two fundamental param-
eters of genetic algorithms: the size of the popula-
tion and the number of generations each optimization
run should evolve. For an optimal parallel process-
ing, we let 24 individuals form our population. Con-
ducting several test runs with different parameter set-
tings, we found 50 generations to be enough for the
genetic algorithm to converge, i.e. new offspring so-
lutions being only marginally better than those of the
last generation. To provide meaningful and compa-
rable results, we performed 40 independent optimiza-
tion runs with the same starting population for all of
the parametrization experiments.
The parametrization experiments comprised the
evaluation of two parameters: the size of the elite be-
ing copied directly to the offspring and the probability
by which mutation should be applied to the evolved
individuals. Assuming that the prevention of degra-
dation introduced by elitism might highly affect the
usefulness of mutation, we chose to investigate and
determine the optimal size for the elite first. Further-
Extracting Navigation Hierarchies from Networks with Genetic Algorithms
69
5
6
7
8
9
0 1 2 3 4 5 6 7 8 9 10
Size of Elite
Global Stretch
Figure 3: Global stretch results for different elite sizes.
Lower values being better.
more, after settling both parameters, we investigated
how changes to the population size and generation
count affect the outcome in this setting.
The results of the optimization runs are presented
for all tested parameter values as boxplots (Field
et al., 2014) summarizing the fitness values of the best
individuals of each run (e.g. figure 3). The horizon-
tal line dividing each box denotes the median of the
sample. The lower end of the box shows the value
of the first quartile (25% of the results lie below that
value), likewise the upper end of the box represents
the third quartile (25% of the results lie above that
value). Consequently, the box itself covers the 50%
in the middle. The whiskers indicate the total range
of values, with outliers exceeding a certain threshold
plotted as separate dots.
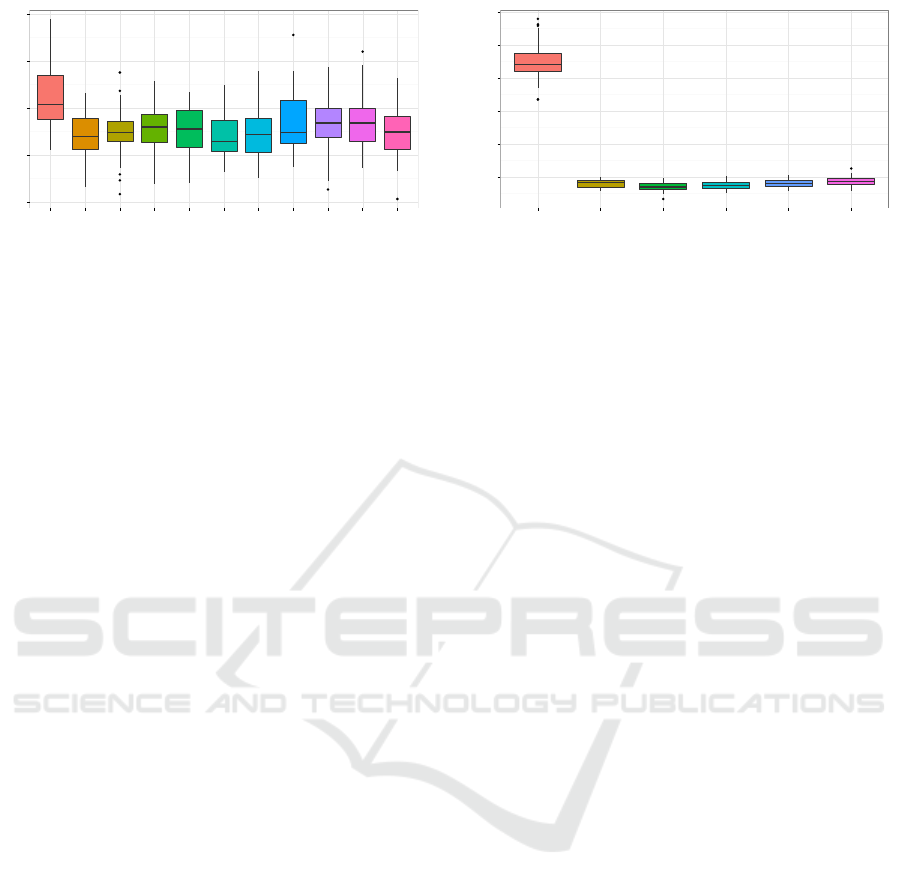
Size of Elite. For the elite size we tried 0–10 indi-
viduals. This equals approximately 4% steps up to
a value of 40% of the population. We did not find
recommendations on how to use elitism in literature,
but we assumed any values greater than 40% of the
population size to be counterproductive. Figure 3 de-
picts the results for the first fitness function, the global
stretch. Obviously, completely forgoing elitism deliv-
ers the worst optimization results. This finding con-
firms the negative impact of potentially replacing the
best individual when evolving a new generation. Ac-
cording to the median, preserving the best 5 individu-
als for the next generation slightly outperforms other
elite sizes. For higher values a small degradation can
be observed acknowledging our decision to limit the
test range. The situation for the local tree fitness was
similar. However, the best results were achieved for a
slightly larger elite with 6 individuals.
Mutation Probability. Applying the determined
elite sizes, we started with a mutation probability of
0%, stepwise increasing it by 5%. As low proba-
bilities (smaller than 20%) have shown to perform
well (Haupt, 2000), we limited our experiments for
that parameter to a maximum value of 25%. The re-
sults, shown in figure 4, are similar to those gained
3
4
5
6
7
8
0 5 10 15 20 25
Mutation Probabillity (%)
Global Stretch
Figure 4: Global stretch results for different mutation prob-
abilities. Lower values being better.
for elitism. Without mutation, the expected loss in the
variety of genetic information is reflected by the cre-
ation of less optimal hierarchies. As soon as mutation
is applied, the used probability plays only a secondary
role. For both fitness functions, a probability of 10%
produces the best individuals with regard to their me-
dian fitness values.
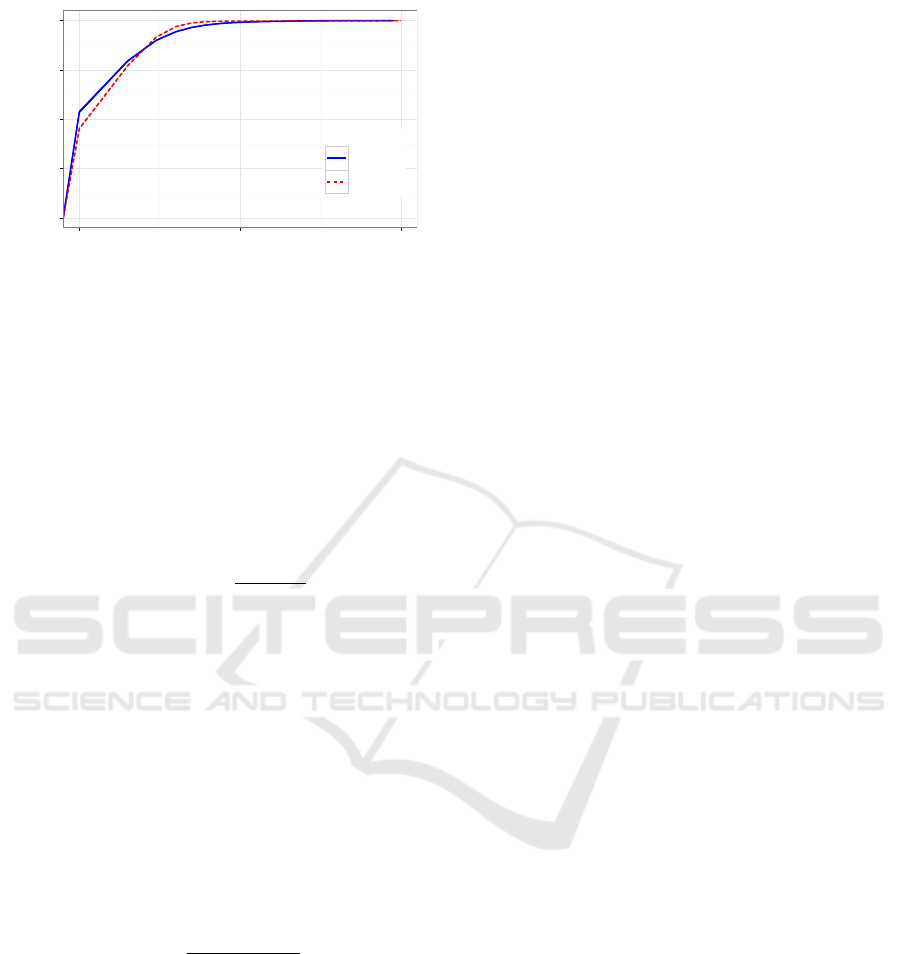
Population Size vs. Generations. Although with the
above parameters the genetic algorithm starts to con-
verge, for the experiments on the original networks
we wanted to go beyond that point. To facilitate the
algorithm to produce even better optimized hierar-
chies, we had two options. Either to increase the size
of the population, allowing the algorithm to choose
from a larger gene pool and to create more offspring
in each generation, or to increase the number of gen-
erations, spending more time on refining already good
solutions. To decide between those options, we per-
formed another experiment. First, we doubled the size
of our population using the parameters determined be-
fore. However, to check whether or not the size of the
elite needs to be kept at a certain percentage, we in-
cluded another test set where the elite size was dou-
bled as well. Finally, we tested the algorithm’s per-
formance for 100 generations instead of 50 without
changing the other parameters. Again, for both fitness
functions we observed similar results (those for global
stretch shown in figure 5). While all changes further
increased the fitness of the best individuals, doubling
the number of generations had the most notable ef-
fect. Compared to the values gathered in the muta-
tion probability experiments the global stretch could
be improved by approximately 10%. Aside from that,
the size of the elite reveals to be a parameter which
should be changed proportional to the population size.
5.2 Final Setup
Based on the findings of the parametrization exper-
iments, we used mostly the same settings for both
fitness functions when generating hierarchies for the
WEBIST 2016 - 12th International Conference on Web Information Systems and Technologies
70

2.4
2.6
2.8
Population Size (Elite 5) Population Size (Elite 10) Generation Count
Doubled Value
Global Stretch
Figure 5: Global stretch results for different improvements
of the optimization process. Lower values being better.
Table 1: Fitness values (global stretch) and standard devia-
tions of the best individuals of the starting populations and
the last generations.
Wikipedia Facebook
Starting
pop.
Last
gen.
Starting
pop.
Last
gen.
Best 497.47 8.54 192.06 6.16
Median 500.18 10.68 198.65 7.04
SD 1.21 1.05 11.68 0.48
original networks. For a population of 24 individu-
als we relied on a mutation probability of 10% and
used 100 generations as a hard termination condition.
The size of the elite was set to 5 individuals for the
global stretch and 6 individuals for the local tree fit-
ness, respectively. With respect to the time needed
for evolving one generation on the original networks,
we additionally used a stagnation soft limit, terminat-
ing the optimization when no improvement could be
observed for 20 generations.
6 RESULTS
Applying global stretch as the fitness function, we
performed 50 experimental runs on both original net-
works. The evaluation of the local tree fitness, how-
ever, showed to be about 20 times slower than evalu-
ating a hierarchy’s global stretch. For this reason, we
had to rigorously limit the extent of the experiments
using this quality criterion. In fact, we only conducted
5 runs on the Wikipedia network. Consequently, the
following analysis of the quality and structure of op-
timized hierarchies, is based on the much larger data
set collected for the global stretch. To compensate
for this shortcoming, we analyzed the progression of
the evolution processes for both fitness functions and
compared the generated hierarchies.
6.1 Optimality of Hierarchies
In the course of the parametrization, increasing the
number of generations showed to be an effective mean
for extending the optimization process. However, in
the final experiments, 74% of the evolutionary pro-
cesses ended before the limit of 100 generations was
reached. In average, the best hierarchy was already
found after 51 generations. Without further experi-
ments, we can only speculate whether or not an in-
crease of the population size might yield better results
for these networks, though.
Despite this discrepancy to the parametrization
experiments, the optimization results are promising
(table 1). Comparing the best hierarchy of all start-
ing populations to the overall best hierarchy obtained
by our experiments, a decrease in the global stretch
of over 96% can be observed for both networks. Al-
though we do not know the possible optimum values,
this outcome at least indicates a good optimization
performance. Since the Facebook network is about
10% smaller than the Wikipedia network, the better
quality of the Facebook hierarchies is not a surprise.
Interestingly, however, the relative improvement is
nearly the same for both networks. This suggests that
our algorithm performs well independently of the size
and structure of the network. The best Wikipedia hier-
archy has a fitness of 8.54, meaning its shortest paths
are in average 8 times longer than those of the orig-
inal network. For the smaller Facebook network, at
least a value of 6.16 was reached. Taking into ac-
count that the hierarchies contain less than 5% of the
network edges, these results can still be considered
good. Additionally, the standard deviations for the
best hierarchies of the last generation are pleasantly
low. Although we have seen some outliers, our algo-
rithm shows to deliver hierarchies of rather constant
quality.
6.2 Hierarchy Structure
To get an idea about how valuable navigation hier-
archies look like, we examined several measures re-
vealing information about the structure of a network.
We considered two centrality measures, which can be
used as indicators for the importance of nodes. For a
node v of a graph G = (V, E) containing n > 1 nodes,
we define the degree centrality to be the fraction of
nodes v is directly connected to (eq. 8).
c
D
(v) =
deg(v)
n − 1
(8)
Like the node degree itself, this measure reveals net-
work hubs (high degree nodes), which have been
Extracting Navigation Hierarchies from Networks with Genetic Algorithms
71
0.00
0.25
0.50
0.75
1.00
1 10 100
Degree
P(X ≤ x)
network
Wikipedia
Facebook
Figure 6: Average degree distribution functions of the best
hierarchies. Confidence intervals are too small to be shown.
shown to be important for human navigation in infor-
mation networks. In the following, such nodes will
be called degree hubs. Furthermore, we investigated
betweenness centrality, a measure indicating the im-
portance of a node for the shortest paths of a net-
work (Brandes, 2008). More precisely, in a directed
network for a node v the betweenness centrality sums
up the fractions of all shortest paths in the graph that
pass through v (eq. 9).
c
B
(v) =
∑
s,t∈V
N
s6=v6=t
sp(s, t|v)
sp(s, t)
(9)
While sp(s, t) is the number of shortest paths between
the nodes s and t, sp(s,t|v) denotes the number of
those paths passing through v. In an undirected net-
work the score is typically halved to account for all
pairs of nodes being considered twice. We addition-
ally averaged that value by the total number of node
combinations relevant for node v to get a more expres-
sive and comparable score (eq. 10). We refer to this
measure by the term average betweenness centrality.
Analogous to degree hubs, in the following we refer
to nodes with a high average betweenness centrality
as navigational hubs.
avg(c
B
(v)) =
2
(n − 1)(n − 2)
· c
B
(v) (10)
Along with the centrality measures, we analyzed
the hierarchies’ degree distribution. Additionally, we
compared their diameter, i.e. the length of the longest
shortest path, to that of the networks. Naturally, we
also considered the hierarchies’ fitness values.
6.2.1 Good Hierarchies
First, we analyzed the best hierarchies of each run of
our algorithm. We noticed that there is nearly no dif-
ference in the degree distribution between the hierar-
chies of one network. Furthermore, averaged over all
of the hierarchies of one network, the distributions of
both networks show to be similar (figure 6). While
the major fraction of nodes are leaves, i.e. nodes only
connected by a single edge, the optimized hierarchies
also contain a small number of degree hubs. Since
these have shown to be important first steps in human
search paths (West and Leskovec, 2012), we further
investigated them. Therefor, for a centrality measure
c, a hierarchy H and a node m having the highest cen-
trality value in H, we defined hubs of H as shown in
equation 11.
v is a hub of H ⇐⇒ c(v) ≥ 0.75 · c(m) (11)
Although this approach might be problematic in net-
works without distinctive hubs, for our use case this
showed to be a viable definition. Considering both
centrality measures, we observed an interesting dif-
ference between the hierarchies of both networks. In
all of the Wikipedia hierarchies there exists exactly 1
degree hub. At the same time, the number of naviga-
tional hubs varies between 1 and 10, with a median of
2 nodes. The Facebook hierarchies show a contrary
structure. While 75% of them have exactly 1 naviga-
tional hub, in average 4 hubs of high degree can be
found. We found, that in general the degree central-
ity of navigational hubs strongly correlates with their
average betweenness centrality (r > 0.61). For de-
gree hubs, however, this correlation is far less distinct
(r < 0.36).
Analyzing the compactness of the hierarchies, in
terms of their diameter, for both networks we found
nearly identical, but high median values (≈ 75). Com-
pared to the diameters of the underlying networks
(Wikipedia: 5, Facebook: 8), this poses a drastic in-
crease. To estimate how the diameter is reflected in
the structure of the hierarchies, we analyzed the distri-
bution of nodes around the most central navigational
hub. We found a notably amount of nodes being situ-
ated far away of the central nodes. With this in mind,
the high diameter is unlikely to be caused by single
linear branches leading away from the core of the hi-
erarchy. Instead, an overall widespread structure can
be assumed.
6.2.2 The Good, the Bad and the Ugly
Calling to mind table 1, the linear structure of the
starting population is obviously a degrading factor for
the quality of hierarchies. Apart from this extreme,
knowledge about the subtle differences distinguish-
ing the best solutions from the second best might be
of use. Either for manually improving hierarchies or
estimating their optimality. To this end, we also ex-
amined the worst hierarchies of the last generation of
our experimental runs.
WEBIST 2016 - 12th International Conference on Web Information Systems and Technologies
72

(a) The good (b) The bad (c) The ugly
Figure 7: Three Wikipedia hierarchies of different quality (layouts are based on a spring model). Subfigure (a) shows the best
hierarchy created, with a global stretch of 8.54. In subfigure (b) the global stretch is 11.97. A subtree splitting off from the
navigational core can be observed. The last hierarchy’s global stretch is 22.35. A linear structure is clearly noticeable.
Starting off by comparing the distribution of node
degrees, no differences between good and bad hier-
archies can be detected. A major difference, how-
ever, can be observed for the number of navigational
hubs. While the navigational core of good hierarchies
(figure 7a) is composed of very few dominant naviga-
tional hubs as well as some nodes of lower between-
ness centrality, the core of bad hierarchies is dis-
tributed amongst a much larger set of nodes, skewed
towards lower centrality. As discussed in the last sec-
tion, this distribution and the lack of a specific central
node are likely to introduce a separation of parts of the
hierarchy (figures 7b and 7c). Consequently, for bad
hierarchies a much higher spread, reflected by large
average diameters, can be recognized. These observa-
tions suggest that the distribution of navigational hubs
can be used as an indicator for the quality of naviga-
tional hierarchies. Condensed navigational cores of
only few nodes with very high average betweenness
centrality are beneficial. On the other hand, numer-
ous nodes of mediocre centrality introduce linearity,
which has been shown to be fatal.
6.3 Comparing the Fitness Functions
As the basis of comparison of our fitness functions,
we chose one of the experimental runs in which the
local tree fitness had been applied. In particular, we
considered the run which created the best of all hier-
archies with regard to local tree fitness. Throughout
the evolutionary process of this run 3588 hierarchies
were created. To get a comparable data set, we addi-
tionally calculated the global stretch for all of them.
Analyzing this data, we first found the values of both
fitness functions to highly and significantly correlate
(r = −0.52, p < 2.2 · 10
−16
). Interpreting the corre-
lation, care has to be taken. Both fitness functions
indicate improvement in opposite directions. There-
fore, the negative correlation of the fitness values cor-
responds to a positive correlation of the quality of the
generated hierarchies. This result confirms that our
quality criteria are likely to be interchangeable and,
on the long run, should lead to the same hierarchies.
7 CONCLUSION
With the size and importance of information networks
growing constantly, the necessity for retaining effi-
cient navigation arises. Inspired by human exam-
ple, our work focuses on network hierarchies used as
means for efficient navigation. We offer a method for
the creation of optimized navigation hierarchies based
on genetic algorithms. Although ultimate optimal-
ity is unlikely to be reached by a heuristic approach,
the hierarchies created for two sample networks are
promising. Good hierarchies share structural proper-
ties. They possess a large number of leaf nodes, ac-
companied by a few degree hubs. Additionally, their
navigational core consists of a few, extraordinary nav-
igational hubs. From there, a rather homogenous net-
work of nodes emerges, leading to hierarchies more
widespread than their underlying networks.
By integration in user interfaces or back-ends
these optimized navigation hierarchies might be valu-
able for guiding human navigation. Especially in
early stages of a search, they can offer structural in-
formation about the network, which can be used to
overcome human knowledge gaps in foreign domains.
Focusing on the preservation of shortest paths, they
might also be of interest for improving the perfor-
mance of decentralized search algorithms.
Apart from applying optimized navigational hier-
archies in practice there are other interesting aspects
which should be considered in future work. Due to the
Extracting Navigation Hierarchies from Networks with Genetic Algorithms
73

modularity of genetic algorithms, STOA is change-
able in various ways. As a side-effect of an early
bug in the implementation of random edge mutation,
for example, we conducted a few experiments with
an unintentionally and randomly decaying mutation
probability. Surprisingly, the optimization performed
slightly better in these cases suggesting the purposeful
application of a decaying mutation probability. Ad-
ditionally, we did not rigorously analyze the perfor-
mance of our optimization approach. Applying our
algorithm to networks with known optima in future
analysis, might clarify how much room for improve-
ment is left.
REFERENCES
Adamic, L. and Adar, E. (2005). How to search a social
network. Social Networks, 27(3):187–203.
Ahmed, N., Neville, J., and Kompella, R. R. (2011). Net-
work sampling via edge-based node selection with
graph induction. Technical report, Purdue University.
Brandes, U. (2008). On variants of shortest-path between-
ness centrality and their generic computation. Social
Networks, 30(2):136–145.
Carvalho, P. M. S., Ferreira, L. A. F. M., and Barruncho, L.
M. F. (2001). On spanning-tree recombination in evo-
lutionary large-scale network problems-application to
electrical distribution planning. Evolutionary Compu-
tation, IEEE Transactions on, 5(6):623–630.
Clauset, A., Moore, C., and Newman, M. E. (2008). Hier-
archical structure and the prediction of missing links
in networks. Nature, 453(7191):98–101.
Field, A., Miles, J., and Field, Z. (2014). Discovering statis-
tics using R. SAGE Publications.
Goldberg, D. E. (1989). Genetic Algorithms in Search, Op-
timization, and Machine Learning. Addison-Wesley
Professional.
Haupt, R. L. (2000). Optimum population size and muta-
tion rate for a simple real genetic algorithm that op-
timizes array factors. In Antennas and Propagation
Society International Symposium, 2000. IEEE, vol-
ume 2, pages 1034–1037. IEEE.
Helic, D., Strohmaier, M., Granitzer, M., and Scherer, R.
(2013). Models of human navigation in information
networks based on decentralized search. In Proceed-
ings of the 24th ACM Conference on Hypertext and
Social Media, pages 89–98. ACM.
Heymann, P. and Garcia-Molina, H. (2006). Collaborative
creation of communal hierarchical taxonomies in so-
cial tagging systems. Technical report, Stanford Info-
Lab.
Kleinberg, J. (2000a). Navigation in a small world. Nature,
406(6798):845–845.
Kleinberg, J. (2000b). The small-world phenomenon: An
algorithmic perspective. In Proceedings of the thirty-
second annual ACM symposium on Theory of comput-
ing, pages 163–170. ACM.
Kleinberg, J. (2002). Small-world phenomena and the dy-
namics of information. Advances in neural informa-
tion processing systems, 1:431–438.
Krishnamurthy, V., Faloutsos, M., Chrobak, M., Lao, L.,
Cui, J.-H., and Percus, A. G. (2005). Reducing large
internet topologies for faster simulations. In NET-
WORKING 2005. Networking Technologies, Services,
and Protocols; Performance of Computer and Com-
munication Networks; Mobile and Wireless Commu-
nications Systems, pages 328–341. Springer.
Leskovec, J. and Faloutsos, C. (2006). Sampling from large
graphs. In Proceedings of the 12th ACM SIGKDD in-
ternational conference on Knowledge discovery and
data mining, pages 631–636. ACM.
Lov
´
asz, L. (1993). Random walks on graphs: A survey.
Combinatorics, Paul erdos is eighty, 2(1):1–46.
McAuley, J. J. and Leskovec, J. (2012). Learning to dis-
cover social circles in ego networks. In NIPS, volume
272, pages 548–556.
Milgram, S. (1967). The small world problem. Psychology
today, 2(1):60–67.
Muchnik, L., Itzhack, R., Solomon, S., and Louzoun, Y.
(2007). Self-emergence of knowledge trees: Extrac-
tion of the wikipedia hierarchies. Physical Review E,
76(1):016106.
Strohmaier, M., Helic, D., Benz, D., K
¨
orner, C., and Kern,
R. (2012). Evaluation of folksonomy induction algo-
rithms. ACM Trans. Intell. Syst. Technol., 3(4):74:1–
74:22.
Trattner, C., Singer, P., Helic, D., and Strohmaier, M.
(2012). Exploring the differences and similarities be-
tween hierarchical decentralized search and human
navigation in information networks. In Proceedings
of the 12th International Conference on Knowledge
Management and Knowledge Technologies, page 14.
ACM.
Wasserman, S. (1994). Social network analysis: Methods
and applications, volume 8. Cambridge university
press.
West, R. and Leskovec, J. (2012). Human wayfinding in in-
formation networks. In Proceedings of the 21st inter-
national conference on World Wide Web, pages 619–
628. ACM.
West, R., Pineau, J., and Precup, D. (2009). Wikispeedia:
An online game for inferring semantic distances be-
tween concepts. In IJCAI, pages 1598–1603.
WEBIST 2016 - 12th International Conference on Web Information Systems and Technologies
74
