
In Situ Observation of Diffusion Mixing in a Micro-fluidic Mixer
Yuta Morizane and Toshiyuki Horiuchi
Tokyo Denki University, 5 Senju-Asahi-cho, Adachi-ku, Tokyo 120-8551, Japan
Keywords: Micro-Fluidic Device, Diffusion Mixing, Projection Exposure, Micro-Mixer, Phenolphthalein.
Abstract: Mixing of laminar two-liquid flows in micro-mixers was visualized and analyzed by mixing alkaline solution
and phenolphthalein. Micro-mixers with flow paths fabricated by optical projection lithography were used.
The two liquids were injected using a syringe pump from Y-shape inlets, and states of mixing were observed
using an optical microscope with a high-resolution digital camera. By using above mentioned two liquids,
transparent liquids were colored in red when they were mixed. For this season, the mixing was clearly
visualized. Because Reynolds number of the flow was so small as 0.27-17.7, the flow became the laminar
one. Accordingly, two liquids were not mixed near the junction where they were joined together. However,
they were gradually mixed by diffusion during they flowed in the mixer paths. It was clarified that the mixing
ratio varied depending on the flow-path shape, flow rate, and flow-path width.
1 INTRODUCTION
Recently, various analyses using micro-fluidic
devices are proposed in chemical, bio, and medical
fields (Akhtar, et al., 2015) (Inami, et al., 2009) (Pu
and Liu, 2004) (Stone, et al., 2004) (Somaiyeh, et al.,
2015) (Watts and Wiles, 2007). There are many
advantages for using micro-fluidic devices. For
example, fluids can be mixed in a narrow area, and
even dangerous chemicals can be safely mixed. In
addition, because the contact area per unit volume of
liquids is increased, high mixing efficiency is
obtained, and mixing speed is improved. For this
reason, it is expected that such micro-fluidic devices
are applicable to analyses of DNAs, genomes, and
proteins. They will be especially useful for low-
volume wide-variety manufacturing of
pharmaceutical devices in the future.
In the field of bio-technology, among various
micro-fluidic devices, micro-mixers are conveniently
used for various analyses and diagnoses. There are
two types of micro-mixers. One is a type in which
external mixing energies are supplied. For example,
electric fields (Harnett, et al., 2008) (Oddy, et al.,
2001) or vibrations (Yang, et al., 2001) are given.
Second-type devices are the ones using no external
energies (Liu, et al., 2000). It is reported that mixing
efficiencies are improved by contriving channel
shapes (Wang and Hu, 2010) (Wang, et al., 2002)
(Wang, et al., 2012).
Using external energy, efficient mixing is
realized. However, the structure of mixer becomes
complicated. In addition, in the case of bio-liquids,
external mixing energy sometimes gives harmful
influence to the liquids. On the other hand, micro-
mixers without using external energies are easily used
under any circumstances. In addition, because a large
number of micro-fluidic devices are often used
simultaneously, they had to be easily made with low
costs. For this reason, simply manufacturable mixers
without using external energies are preferred.
Therefore, such type simple micro-mixers are
investigated here.
In this research, micro-mixers were fabricated
using a newly developed low-cost 1:1 projection
exposure system (Morizane et al., 2014)
(Morizane
and Horiuchi, 2015). The system has a 20-mm square
exposure field, and straight-type, snail-type, and
meander-type mixers with sizes of 10×15 mm
2
,
10×15 mm
2
,
and 15×15 mm
2
were fabricated. The
flow paths with a width of 100 μm were directly
fabricated using resist patterns with vertical side
walls. The mixers were assembled by binding acrylic
lid plate and vessel plate sandwiching the flow path
substrates by four screws.
To evaluate the states of mixing clearly, alkaline
solution and phenolphthalein are mixed, reffering to
the past researches. In the first past research, a snail-
type micro-mixer was fabricated in 2-mm square area
using 1/19 projection lithography (Horiuchi, et al.,
Morizane, Y. and Horiuchi, T.
In Situ Observation of Diffusion Mixing in a Micro-fluidic Mixer.
DOI: 10.5220/0005757902090215
In Proceedings of the 9th International Joint Conference on Biomedical Engineering Systems and Technologies (BIOSTEC 2016) - Volume 1: BIODEVICES, pages 209-215
ISBN: 978-989-758-170-0
Copyright
c
2016 by SCITEPRESS – Science and Technology Publications, Lda. All rights reserved
209
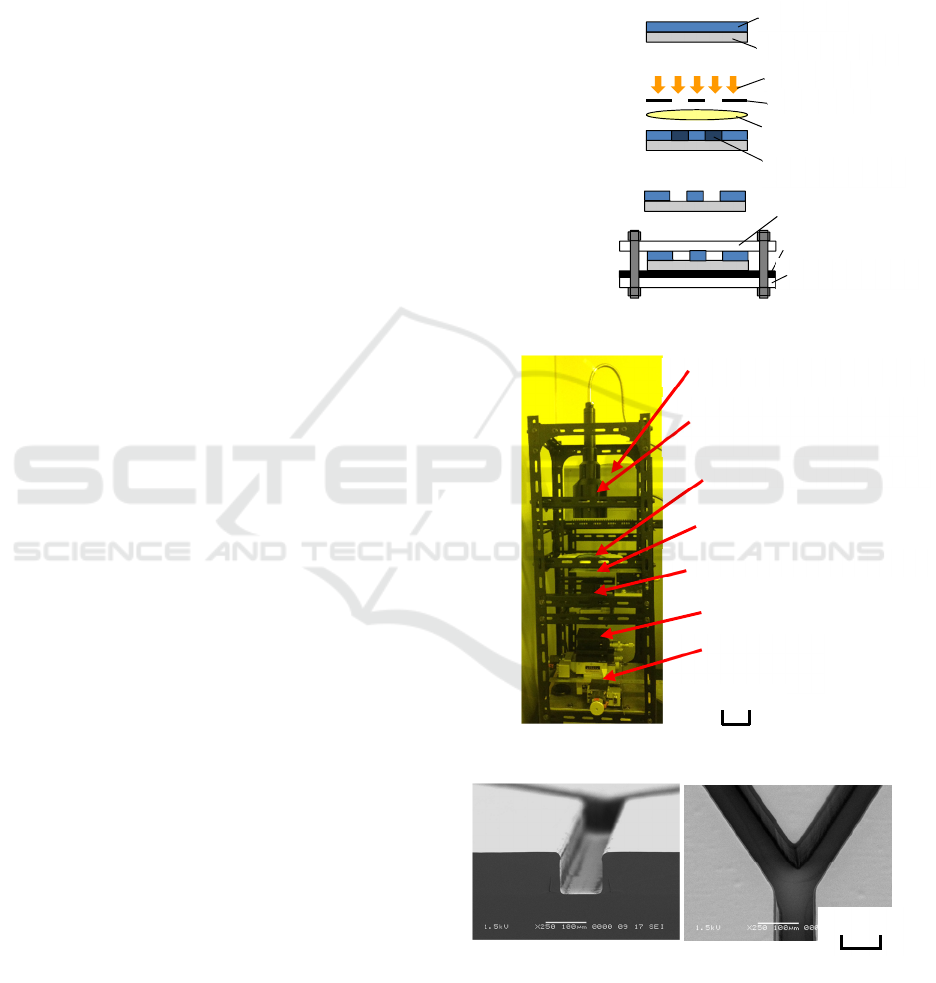
② Exposure
① Resist coating
③ Development
④ Assemble
2000), and in the second past research, meander-type
micro-mixer was fabricated in 6×15 mm
2
area using
contact lithography (Horiuchi and Yoshino, 2014). In
these past researches, mixing performances were
observed and evaluated using colored waters.
However, it was difficult to quantitatively evaluate
the mixing, and clarify what parameters mainly
influence the mixing. For this reason, above
mentioned liquids were selected. It is considered that
because the color of mixed parts are changed from no
color to vivid red, they are distinguished clearly.
Two liquids are injected using a syring pump, and
the mixing states are in situ observed by an optical
microscope with a digital camera. As a results,
mixing states are clearly visualized. Mixing ratio and
main parameters influencing the mixing are
investigated and discussed in detail.
2 FABRICATION OF
MICRO-MIXERS
Micro-mixers were fabricated, by the procedure
shown in Figure 1. At first, flow path patterns were
fabricated on a synthetic quartz substrate using
projection lithography. Negative resist SU-8 (Micro
Chem) with a thickness of 100 µm was used. Next,
the substrate was softly baked at 65 °C for 20 min and
at 95 °C for 50 min continuously. Then, the resist was
exposed to the shape of flow paths using the 1:1
projection exposure system shown in Figure 2. The
sizes of the system were 300 mm wide, 600 mm deep,
and 1,100 mm high. As a light source, an ultra-violet
lamp with a main wavelength of 365 nm (Inflidge,
UV-CURE120) was used. A macro lens for a camera
(Sigma, 50 mm, F2.8 EX DG MACRO) was used as
the projection lens. Numerical aperture was set to
0.089. The exposed substrate was rebaked. The post-
exposure bake was done at 65 °C for 10 min and 95
°C for 30 min. After cooling down the substrate to
room temperature, the resist on the substrate was
developed in SU-8 developer for 10 min. By exposing
the resist under appropriately defocused conditions,
flow path patterns with almost vertical side walls
were obtained, as shown in Figure 3.
Three types of mixers with different flow-path
patterns were fabricated, as shown in Figure 4. One
was a straight-type mixer with Y-shaped inlets.
Second one was a snail-type mixer. Third one was a
meander-type mixer. The quartz substrate with the
flow path pattern was sandwiched by acrylic vessel
and lid plates, and assembled to a micro-mixer by
binding the four corners using M3 screws. Teflon
tubes with an outer diameter of 1.6 mm and inner
diameter of 0.7 mm were attached to two inlets and
one outlet using an adhesive. To prevent the
distortions of lid and vessel plates, and improve the
sealing, a rubber sheet was inserted between the
vessel plate and the substrate.
Figure 1: Fabrication method of micro-mixer.
Figure 2: Exposure system used for the research.
Figure 3: Profiles of flow-path patterns.
(b) Bird’s-eye view. (a) Cross section.
100 μm
Reticle
Quartz substrate
placed on Z stage
Illumination optics
Collective lens
Projection lens
XY stage
UV light source
100 m
m
Resist
Quartz substrate
Light rays
Reticle
Projection lens
Sensitized parts
Lid plate
Rubber sheet
Vessel plate
BIODEVICES 2016 - 9th International Conference on Biomedical Electronics and Devices
210
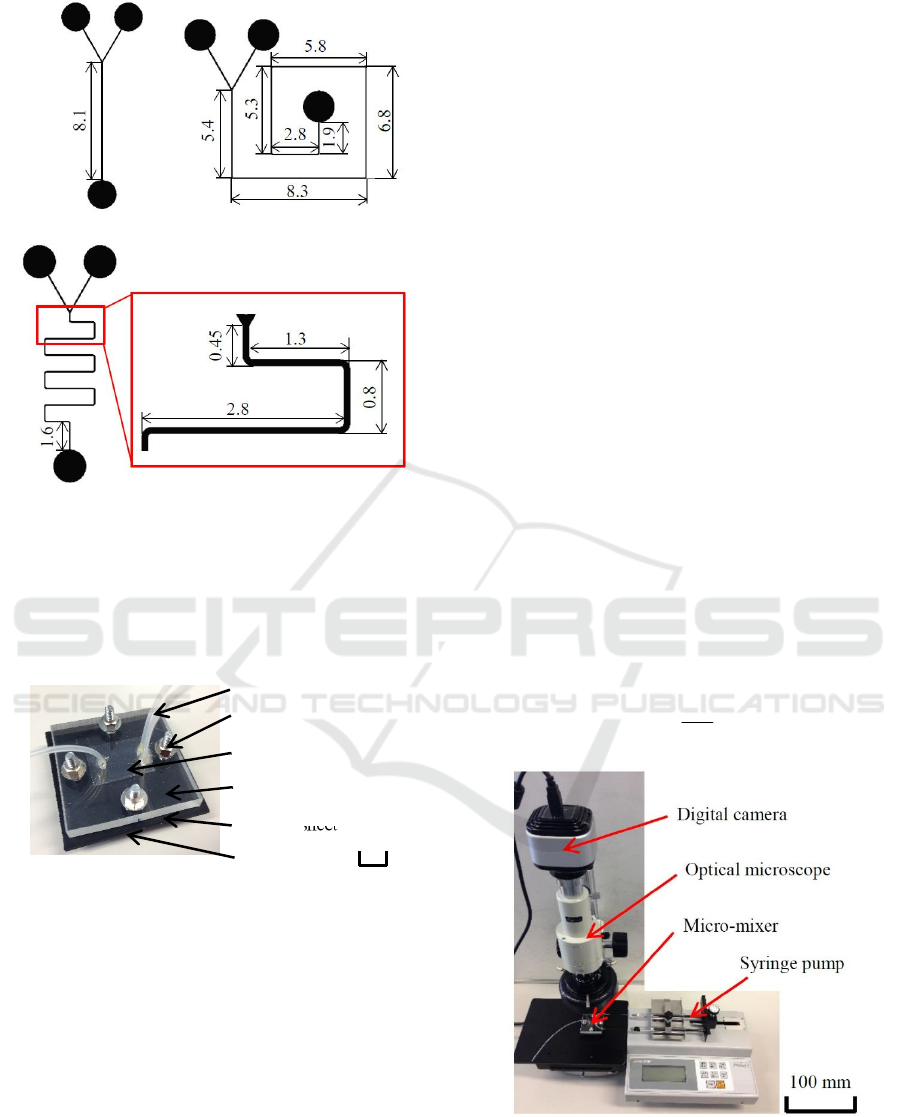
(a) Straight-type. (b) Snail-type.
(c) Meander-type.
Figure 4: Shapes and sizes of fabricated micro-mixers.
Assembled micro-mixer is shown in Figure 5. By
grace of elasticity of the rubber sheet and SU-8, the
flow paths of mixers were successfully sealed and no
leaks were observed.
Figure 5: Assembled micro-mixer.
3 TWO LIQUID MIXING
3.1 Evaluation Method
Mixing of two liquids injected in micro-fluidic paths
were in situ observed. Micro-mixers explained in
section 2 were used for the experiments. The in situ
observation method is shown in Figure 6. The mixers
were placed one by one on the stage of optical
microscope (Arms system, IMZ-20CU) with a high-
resolution digital camera (Arms system, HV-20CU).
The two liquids were simultaneously injected using a
syringe pump (AS ONE, MSP-3D). Because all of the
acrylic lid, resist flow path, and synthetic quartz
substrate were transparent, and a white paper sheet
was laid under the quartz substrate, liquids were
observed as they were in natural colors, if they were
colored. In the past researches, waters colored in
advance were mixed. However, it was difficult to
observe the mixing state clearly. For this reason, as a
method for evaluating liquid mixing more clearly,
two transparent liquids colored only when they were
mixed were chosen. In concrete, strong alkali and
phenolphthalein were mixed. As the alkali, 3%
TMAH (Tetra methyl ammonium hydroxide) with pH
of 13 (Tokyo Ohka Kogyo, PMER P-7G) was used.
The phenolphthalein was dissolved in ethanol, and
measured pH was 7. When they were mixed, they
were colored in vivid red. According, weather they
were mixed or not were clearly discriminated. Red
and colorless parts were very easily distinguished.
Thus, mixing of two liquids was visualized on a
monitor display as the in situ image of the digital
camera attached to the optical microscope.
To evaluate the mixing ratio quantitatively, the red
and colorless areas were binarized to black and white.
The threshold was decided by the red color of the
fully mixed area. Next, the black and white ratio in
the width direction of the flow paths was calculated
as the mixing ratio R
m
. The mixing ratio R
m
was
defined by eq. (1), as shown in Figure 7, and
evaluated at the points shown in Figure 8.
f
m
m
w
w
R =
(1)
Figure 6: Set up for injecting liquids in the micro-mixer and
in situ observation system.
Vessel plate
Tube
Bolt and nut
Quartz substrate
with flow paths
Lid plate
Rubber sheet
10 m
m
In Situ Observation of Diffusion Mixing in a Micro-fluidic Mixer
211
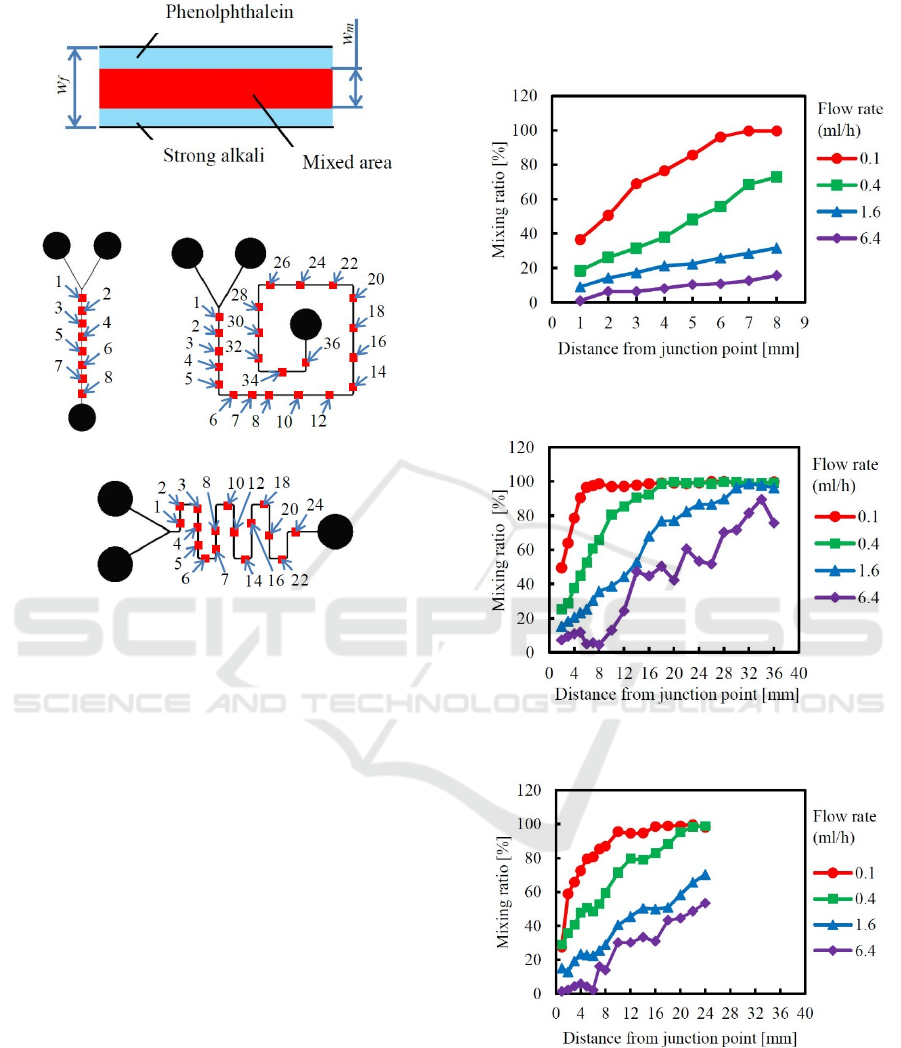
Figure 7: Figure for explaining mixing ratio R
m
.
(a) Straight-type. (b) Snail-type.
(c) Meander-type.
Figure 8: Points where the mixing ratio R
m
was evaluated.
3.2 Mixing Ratio Dependence on Flow
Rate and Flow-Path Shape
Mixing ratios were measured along each flow path by
1 or 2 mm intervals, and the results are shown in
Figures 9-11. It was known that the red part widths
gradually increased along the flow paths after the two
liquids were joined using the Y-shape inlets. When
the flow rate was changed from 0.1 (Re=0.27) to 6.4
(Re=17.7) ml/h, the mixing ratio changed almost
regularly. Here, Re is the Reynolds number. It was
clarified that the mixing ratio strongly depended on
the flow rate. Because Reynolds numbers were very
small, and the liquids were mixed by diffusion, the
mixing ratio became large for small flow rate.
Next, by comparing the mixing ratios between the
snail-type and the meander-type channels, difference
of the mixing ratio was investigated. Under all the
flow rate conditions of 0.1-6.4 ml/h, mixing ratios of
the snail-type mixer were a little higher than that of
the meander-type mixer. It was observed that the
liquids in the snail-type channel were rapidly mixed
after passing corners. Accordingly, it was considered
that the right-angled corners like those used in the
snail-type channel were effective for mixing.
A panoramic photograph of the visualized
meander-type channel (flow rate=0.4) is shown in
Figure 12.
Figure 9: Mixing ratio of straight-type micro-mixer with a
flow-path width of 100 μm.
Figure 10: Mixing ratio of snail-type micro-mixer with a
flow-path width of 100 μm.
Figure 11: Mixing ratio of meander-type micro-mixer with
a flow-path width of 100 μm.
Visual difference of mixed flow are shown in
Figure 13. These photographs were taken at the point
3 of the snail-type mixer. It is clearly known that the
mixed area or mixing ratio decrease depending on the
flow rate.
BIODEVICES 2016 - 9th International Conference on Biomedical Electronics and Devices
212
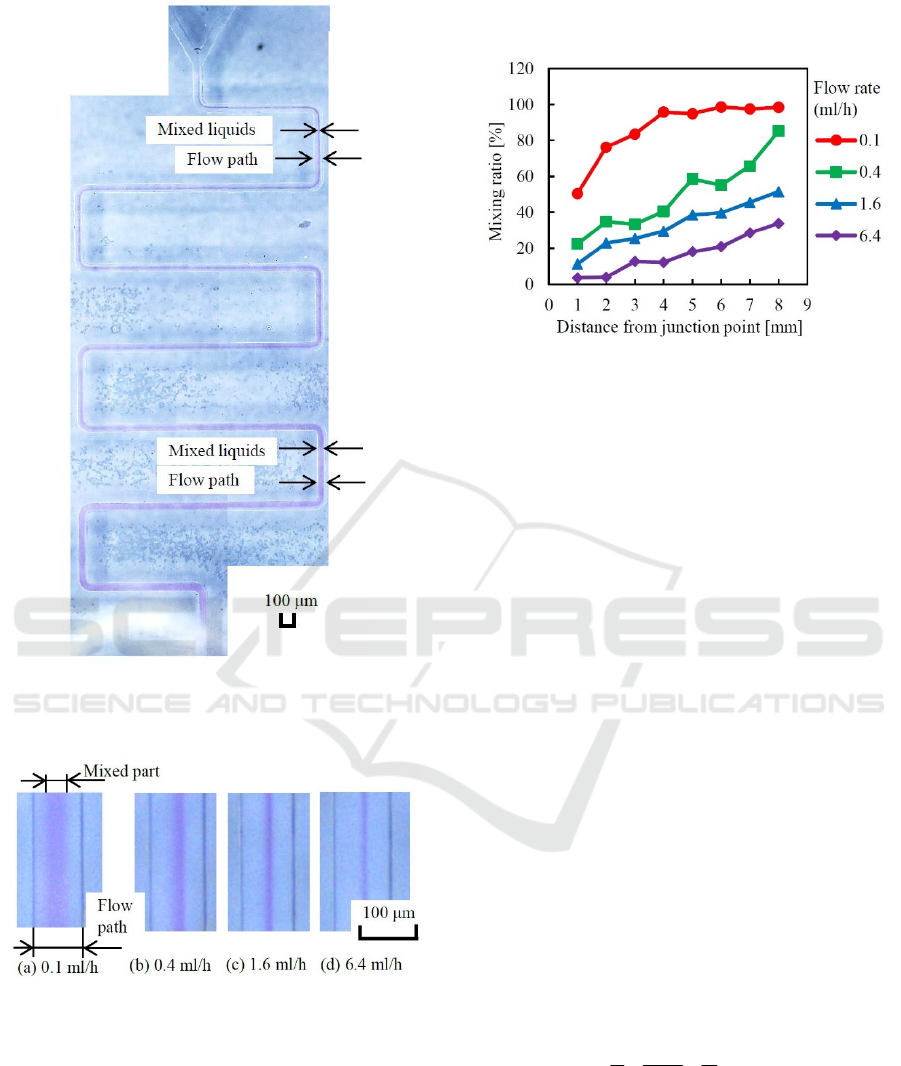
Figure 12: Panoramic photograph of meander-type mixer.
It is clearly observed that the flow width of mixed liquids
increases gradually from the junction point to the outlet.
Figure 13: Visual differences of mixed flows observed at
point 3 of the snail-type mixer.
3.3 Influence of Flow-Path Width
Mixers with a width and depth of 100 μm were used for the
experiments shown in section 3.2. In this section, a straight-
type mixer with a width of 50 μm and a depth of 100 μm
was used, and the mixing performances were compared.
Figure 14 shows the results. Comparing Figure 14 with
Figure 9, it was found that the mixing ratios of the channel
with a narrow flow path were higher than those with a wide
flow path.
Figure 14: Mixing ratio of straight-type micro-mixer with a
flow-path width of 50 μm.
4 DISCUSSION
Changes of mixing ratios caused by differences of
flow rate and flow path were discussed. In the case of
micro-fluidic devices, the width and depth of flow
path are very small. For this reason, Reynolds number
becomes very small, and the flow becomes laminar.
In a laminar flow, mixing by turbulences of flow is
not expected, and giving external forces for stirring
the flow in the micro-flow path is also difficult.
Therefore, molecular diffusion becomes the most
probable mixing phenomenon.
In diffusion mixing, diffusion time t is expressed by
t ≈ L
2
/ D (yamamoto, et al., 2013).
(2)
Here, D and L are diffusion coefficient and length,
respectively. Accordingly, t is proportional to L
2
, if
the diffusion coefficient D is constant. In the case of
micro-mixer investigated here, diffusion length L
corresponds to (w
m
/2) because the mixing of liquids
expand from the flow-path center to the outside. On
the other hand, diffusion time t corresponds to the
distance d from the junction point. If the flow rate Q
and the cross section A of flow path are constant, t is
calculated by the following equation because the flow
velocity v is obtained by v = Q/A.
.
/
d
Q
A
AQ
d
v
d
t ===
(3)
Referring to the experimental results shown in
Figures 9-14, the mixing ratio gradually saturates and
approaches to 100 %, and roughly speaking, the
curves seem almost parabolic, as shown in Figure 15.
If the curve is parabolic, d is proportional to
.
Because R
m
equals to w
m
/ w
f
= 2L/ w
f
and d = (Q/A)
In Situ Observation of Diffusion Mixing in a Micro-fluidic Mixer
213
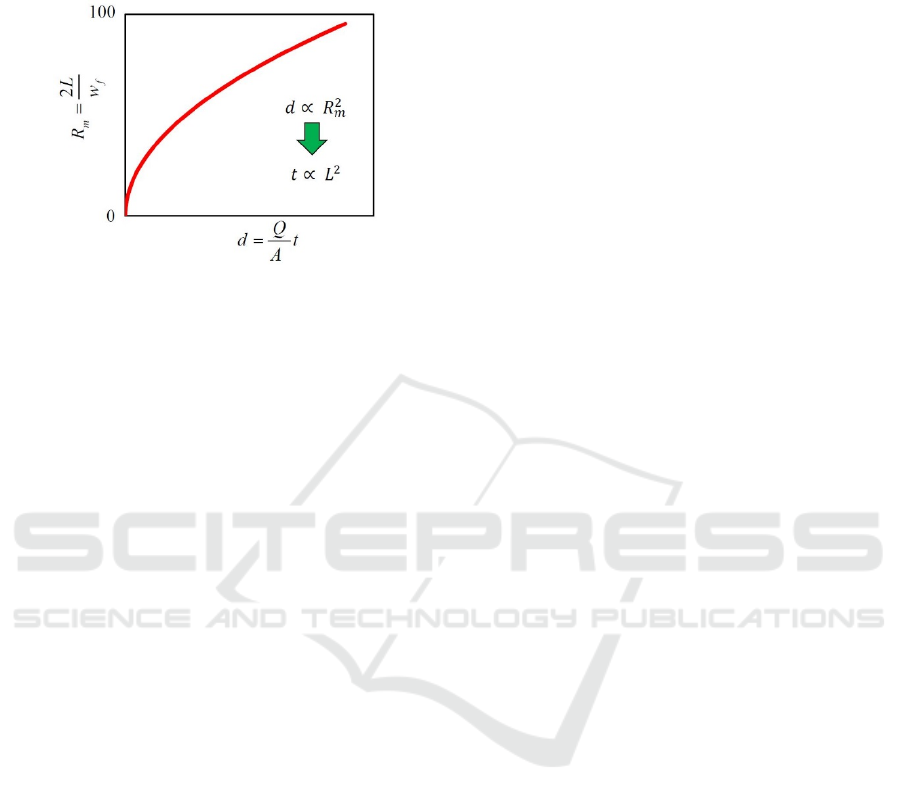
t, t is proportional to L
2
. Therefore, it is thought that
the experimental results have a tendency
approximately agreed with eq. (2).
Figure 15: Almost parabolic relationship between the
mixing ratio R
m
and the distance d from the junction point.
If the curve is parabolic, t is proportional to L
2
.
5 CONCLUSIONS
Micro-fluidic mixer patterns were formed on quartz
substrates using 1:1 optical projection lithography
system, and three types of micro-mixers were
fabricated sandwiching the quartz substrates by
acrylic lid and vessel plates. Mixing of two liquids
were investigated by injecting strong alkali and
phenolphthalein solutions simultaneously from Y-
shape inlets. The state of mixing was in situ observed
on a monitor display using an optical microscope with
a high-resolution digital camera. The mixing was
clearly visualized caused by the chemical color
change from no color to red. Because the flow width
colored in red gradually increased along the flow
paths, mixing ratio was measured as the colored width
devided by the full width of the flow path.
Then, the mixing ratio dependence on flow rate
and flow path was clarified. The mixing ratio
increased when flow rate was decreased, and narrow
flow-path was used. It was demonstrated that the new
in situ observation method was effective to clarify the
diffusion mixing in micro-fluidic mixers. It was also
found that right-angled corners of flow paths were
effective for advancing the mixing of liquids.
In this research, flow path depth was fixed to 100
μm. It is considered that the mixing is also influenced
by the flow path depth or the aspect ratio of the flow-
path cross section. It is necessary to investigate
hereafter.
ACKNOWLEDGEMENTS
This work was partially supported by Research
Institute for Science and Technology of Tokyo Denki
University, Grant Number Q15T-03.
REFERENCES
Akhtar, M., Brandhoff, L., Driesche, S., Vellekoop, J, M.,
2015. Air-droplets as Gas Reservoir to Provide O2 to
the Stored-Aqueous Droplets in Micro-channels.
Procedia Engineering, 120, pp. 92-95.
Harnett, C. K., Templeton, J., Dunphy-Guzman, K. A.,
Senousy, Y. M., Kanouff, M. P., 2008. Model based
design of a microfluidic mixer driven by induced charge
electroosmosis. Lab Chip, 8, pp. 565-572.
Horiuchi, T., Yoshino, S., 2014. Fabrication of Precise
Micro-fluidic Devices Using a Low-cost and Simple
Contact-exposure Tool for Lithography. Proceedings of
The third International Conference on Biomedical
Electronics and Devices, pp. 5-11.
Horiuchi, T., Watanabe, H., Hayashi, N., Kitamura, T.,
2010. Simply Fabricated Precise Microfluidic Mixer
with Resist Flow Paths Sealed by an Acrylic Lid.
Proceedings of The third International Conference on
Biomedical Electronics and Devices, pp. 82-87.
Inami, H., Tsuge, K., Matsuzawa, M., Sasaki, Y., Togashi,
S., Komano, A., Seto, Y., 2009. Semi-automated
bacterial spore detection system with micro-fluidic
chips for aerosol collection, spore treatment and ICAN
DNA detection. Biosensors and Bioelectronics, 24, pp.
3299-3305.
Liu, R. H., Stremler, M. A., Sharp, K. V., Olsen, M. G.,
Santiago, J. G., Adrian, R. J., 2000. Passive Mixing in
a Three-Dimensional Serpentine Microchannel.
MICROELECTROMECHANICAL SYSTEMS, 9, pp. 2.
Morizane, Y., Uchino, S., Watanabe, Y., Horiuchi, T., 2014.
Development of a Simple and Low-Cost Projection
Exposure System for Fabricating Micro-Components
with Large-Size Patterns. Dig. Papers, Photomask
Japan 2014, pp. 42.
Morizane, Y., Horiuchi, T., 2015. Fabrication of
Microfluidic Paths Using Thick and Vertical Resist
Patterns Printed by Exposure with Intentional Large
Defocus. Dig. Papers, Photomask Japan 2015, pp. 43.
Oddy, M. H., Santiago, J. G., Mikkelsen, J. C., 2001.
Electrokinetic Instability Micromixing. Analytical
Chemistry, 73, pp. 5822-5832.
Somaiyeh, A., Haghighi, M., Ebadi, A., 2015. Direct
synthesis of DME over nanostructured CuO–ZnO–
Al2O3/HZSM-5 catalyst washcoated on high pressure
microreactor. Chemical Engineering Journal 262, pp.
1175-1186.
Stone, H. A., Stroock, A. D., Ajdari, A., 2004. Engineering
flows in small devices: Microfluidics toward a lab-on-
a-chip. Annual Review and Fluid Mechanics, 36, pp.
381-411.
BIODEVICES 2016 - 9th International Conference on Biomedical Electronics and Devices
214

Pu, Q. S., Liu, S. R., 2004. Microfabricated electroosmotic
pump for capillary-based sequential injection analysis.
Analytica Chimica Acta, 511, pp. 105-112.
Yang, Z., Matsumoto, S., Goto, H., Matumoto, M., Maeda,
R., 2001 Ultrasonic micromixer for microfluidic
systems. Sensors and Actuators, 93, pp. 266-272.
Yamamoto, D., Maki, T., Watanabe, S., Tanaka, H.,
Miyahara, T. M., Mae, K., 2013. Synthesis and
adsorption properties of ZIF-8 nanoparticles using a
micromixer. Chemical Engineering Journal, 227, pp.
145-150.
Wang, C. T., Hu, Y. C., 2010. Mixing of liquids using
obstacles in Y-type microchannels. Science and
Engineering, 13, pp. 385-394.
Wang, H. Z., Iovenitti, P., Harvey, E., Masood, S., 2002.
Optimizing layout of obstacles for enhanced mixing m
microchannels. Smart Mater and Structres, 11, pp. 662-
667.
Wang, L., Liu, D., Wang, X., Han, X., 2012. Mixing
enhancement of novel passive microfluidic mixers with
cylindrical grooves. Chemical Engineering Science, 81,
pp. 157-163.
Watts, P., Wiles, C., 2007. Micro reactors: a new tool for
the synthetic chemist. Organic & Biomolecular
Chemistry, 5, pp. 48.
In Situ Observation of Diffusion Mixing in a Micro-fluidic Mixer
215
