
Risk Driven Analysis of Maintenance for a Large-scale Drainage System
Yujie Chen
1
, Fiona Polack
1
, Peter Cowling
1
, Philip Mourdjis
1
and Stephen Remde
2
1
YCCSA, Computer Science Department, University of York, York, U.K.
2
Gaist Solutions Limited, Lancaster, U.K.
Keywords:
Simulation, Maintenance, Risk Management.
Abstract:
Gully pots or storm drains are located at the side of roads to provide drainage for surface water. We consider
gully pot maintenance as a risk-driven maintenance problem. Our simulation considers the risk impact of
gully pot failure and its failure behaviour. In this paper, we focus on two factors, the issue of parked cars
and up-to-date gully pots status information, that may affect the scheduling of maintenance actions. The aim
is to discover potential investment directions and management policies that will improve the efficiency of
maintenance. We find that the “untimely system status information” is a dominant factor that weakens the
current maintenance. Low-cost sensor technique could be a good development.
1 INTRODUCTION
Gully pots are designed to prevent solids and sedi-
ment from flushing into sewers and causing block-
ages in the underground system (Butler et al. (1995)).
Regular cleaning is required for gully pots to func-
tion effectively (Karlsson and Viklander (2008); Scott
(2012)). Usually, gully pots in a city are cleaned
once or twice a year. Partial or complete blockages of
the gully pots increases the likelihood of surface wa-
ter flooding. In extreme situations such as intensive
rainfall, a clogged drainage system may cause serious
property loss (i.e. BBC (2011, 2012); Shieldsgazette
(2012); Leylandguardian (2015)).
Our gully pot maintenance problem is based on
Blackpool, UK. Blackpool’s gully pot maintenance
system records 28,149 gullies in an area of about 36.1
km
2
. On any day, the maintenance team either car-
ries out the normal cleaning action, categorised as
the preventative maintenance, or responds to emerg-
ing events such as gully broken and blockage reports
(i.e. the corrective maintenance). Depending on the
local risk, these emerging events should be scheduled
5 to 20 days from when they are recorded. For broken
gully pots, a different vehicle equipped with a spe-
cialist machine is required. Due to limited human re-
source, only one vehicle works each day.
Each day there is a schedule of gully pots to visit,
starting and ending at the depot. The maintenance ve-
hicle departs the depot at 09:00 and returns no later
than 17:00. During servicing, some gully pots are in-
accessible due to parked vehicles. Historical mainte-
nance records show that this is a striking issue: about
8.3% of gully pots are not serviced each year because
of parked cars.
Apart from the parking issue, we also notice an-
other weakness of current maintenance scheduling
strategy – untimely system status information. Cur-
rently, all the broken or blocked gully pots are either
reported by local residents or found through preventa-
tive maintenance. Historically, the records show that
reporting of gully pot issues by local residents is high-
est in autumn, when leaf-fall and higher rain causes
many blockages; and lowest in winter, when short
daylight and cold weather reduce footfall. This pas-
sive situation potentially leads to uncontrolled surface
water flooding.
In order to discover techniques or policy that could
improve current gully pot maintenance, this paper
considers the gully pot maintenance as a risk-driven
problem. In our analysis, we take account of each
gully pot’s failure behaviour and the risk impact of
its failure, which varies across the city. The current
widely used maintenance strategy, including both pre-
ventative and corrective actions, is evaluated by our
risk model across various scenarios.
The remainder of this paper is organized as fol-
lows. Section 2 reviews maintenance techniques and
concept. We then introduce our simulation in Sec-
tion 3. Section 4 shows our results and conclusions.
A summary of investment suggestions based on our
simulation is provided in Section 5.
296
Chen, Y., Polack, F., Cowling, P., Mourdjis, P. and Remde, S.
Risk Driven Analysis of Maintenance for a Large-scale Drainage System.
DOI: 10.5220/0005749102960303
In Proceedings of 5th the International Conference on Operations Research and Enterprise Systems (ICORES 2016), pages 296-303
ISBN: 978-989-758-171-7
Copyright
c
2016 by SCITEPRESS – Science and Technology Publications, Lda. All rights reserved

2 RELATED WORKS
Maintenance is generally categorised into corrective
and preventative maintenance (Duffuaa et al. (2001);
Ahmad and Kamaruddin (2012)). Corrective mainte-
nance (CM) usually happens after failures occur. It
includes actions such as repair and replacement. Pre-
ventative maintenance (PM) is an alternative strategy.
In industry, preventative maintenance typically takes
place at regular time interval, based on experience.
Operational research on PM introduces decision
making, based on data analysis, with techniques such
as time-based (TBM) (e.g. Scarf and Cavalcante
(2010); Wu et al. (2010)) and condition-based main-
tenance (CBM) (e.g. Carnero Moya (2004); Cam-
pos (2009)). TBM can be applied when the failure
rate is predictable, whilst CBM is employed where
conditions are continuously monitored by sensors or
any appropriate indicators. A similar approach, track-
ing real-time operation information, is also applied
in dynamic scheduling (e.g. Cowling and Johansson
(2002)). There is a little research combining PM and
CM strategies: Kenne and Nkeungoue (2008) intro-
duce a PM/CM rate control strategy, obtaining a near-
optimal maintenance policy for a manufacturing sys-
tem.
For TBM, the accurate prediction of the current
and future condition of a system is crucial for de-
veloping appropriate maintenance schedules. Dam-
age, deterioration and degradation are important no-
tions in asset life cycle management. Literature shows
that related research has been done in bridge, pave-
ment and water pipe systems (Madanat and Ibrahim
(1995); Morcous et al. (2002); Baik et al. (2006)).
Two techniques are normally applied: first, functional
based models like exponential (Shamir and Howard
(1978)) and time-powered models (Kleiner and Ra-
jani (2001)) have been used to determine the opti-
mal timing of water pipe inspection and replacement;
time-dependent Poisson (Constantine et al. (1996))
and the accelerated Weibull hazard models (Le Gat
and Eisenbeis (2000)) are also widely used. Sec-
ond, Markov chain-based deterioration models have
been well studied and applied in a number of real-
world applications (e.g. Madanat and Ibrahim (1995);
Morcous et al. (2002); Baik et al. (2006)). Differ-
ent from the functional based models, Markov chain-
based models focus on the transition probabilities be-
tween different grades, which also implies our condi-
tions are evaluated discretely. The advantage of dis-
crete methods is that clear management policies can
be addressed based on the corresponding states.
This problem is also related to the periodic vehicle
routing problem (PVRP) (Christofides and Beasley
(1984)), which is widely used in geographically dis-
tributed maintenance and on-site service applications
(e.g. Shih and Chang (2001); Gaur and Fisher (2004);
Claassen and Hendriks (2007); An et al. (2012)). Dif-
ferent from research in the above maintenance con-
cept, PVRP is based on the assumption that the opti-
mal maintenance frequency and pattern for each ob-
ject is known. The aim is to produce efficient schedule
and daily routes that satisfy maintenance frequency
and pattern constraints in a given period.
3 SIMULATION
3.1 Model for Schedule Strategy in the
Real World
Due to the large-scale of the problems and gully pot
condition changing over time, the schedule plan is
normally provided for the near future (e.g. one week
or one month). Therefore, during the planning period,
not all gully pots can be serviced.
In order to discover any methodology or policy
that could improve the current gully pot maintenance,
we would like to simulate the actual scheduling strat-
egy that is widely applied across local authorities. We
summarise the procedure as follows.
1. Construct efficient preventative maintenance
routes. In our model, This sub-problem is
considered as a vehicle routing problem (VRP).
The objective is building daily cleaning routes
that minimize the total travelling distance, with
constraints including: 1) all gully pots in the
system should be visited at least once; 2) all
routes should start and end at the depot; 3) no
route travelling time should exceed the working
hours constraint. A variable neighbourhood
search (Hansen et al. (2010)) is applied. A similar
solver is also described by Chen et al. (2014).
2. Collect recent information on emerging bro-
ken/blocked gully pots.
3. Generate schedule for the near future (e.g. one
week or one month plan). Priority is given to
broken and blockage reports. When all the re-
ported problematic gully pots are serviced, the
crew comes back to preventative maintenance. To
schedule the preventative actions, we give priority
to the routes with the highest risk estimates (de-
scribed in the following section, function 1) that
have not been scheduled in the last year.
Risk Driven Analysis of Maintenance for a Large-scale Drainage System
297

3.2 Evaluation
In order to evaluate the performance of a mainte-
nance schedule, we propose a risk-driven model.
Each day, the risk of surface water flooding due to
blocked/broken gully pots is evaluated by function 1:
N
∑
i=1
r
i
P
i
(d) (1)
Where N is the total number of gully pots in the
drainage system, r
i
is the risk impact of gully pot i
estimated by its surrounding environment, and P
i
(d)
is the probability that gully pot i is failed on day d.
3.2.1 The Risk Impact Per Gully Pot (r
i
)
A hazard (i.e. surface water flooding) could poten-
tially be exacerbated by social-related factors, which
are usually influenced by economic, demographic and
building types (Cutter et al. (2003)). A higher risk
impact here implies that if a particular gully pot is
blocked and floods happen, it results in relatively
larger economic and social losses. Co-operating with
Blackpool local council, we firstly decide a list of so-
cial concerns with awareness of their economic and
population influence. Then, each gully pot is evalu-
ated by its location and the related social concerns.
Here, social concerns are classified in to three
groups: 1) residential property; 2) commercial and
industrial areas including local and district centres,
business zones, and employment sites; 3) public ser-
vices including schools, hospitals, doctors and public
transport routes. In table 1, the estimated value of the
item in group 1 is the average residential house price
in Blackpool (UK GOV (2015)). Group 2 takes ac-
count of the footfall and critical building prices for
each item. The estimated value of items in group 3 is
based on average daily operation costs.
Flooding impact analysis involves large uncertain-
ties. We do not expect a precise assessment of im-
pact. Instead, we aim to find values that are able to
guide gully pot maintenance actions in decision mak-
ing. Here, we mainly focus on direct economic losses
using a damage function which relates to property
type and water level. Thieken et al. (2008) propose
the impact from a range of flood water levels on dif-
ferent building types. After consulting the UK Envi-
ronment Agency and Blackpool Council, we decide to
focus on the impact of flood water levels of less than
21 cm. This gives the value-loss figures shown in ta-
ble 1. For public transport we focus on bus routes,
estimating the cost of road section closure due to sur-
face water flooding.
By analysing Blackpool’s historic flooding fre-
quency (Blackpool (2009)), the probability of flood-
ing events is used to map the flooding value loss to the
daily risk impact per gully pot according to its loca-
tion (last column of Table 1). We assume that gullies
in the same section of a street evenly share the respon-
sibility for the risk impact evaluated in that area. Fig-
ure 1 illustrates the geographic distribution of gully
pot risk impact in Blackpool.
Figure 1: Gully pot risk impact in Blackpool.
3.2.2 Estimating the Process of a Gully Pot
Blocking
Ahmad and Kamaruddin (2012) suggest that time-
based maintenance is the normal strategy in situations
where equipment has a fixed lifespan or predictable
failure behaviour. After analysis of historic gully pot
records, we model the gully pot blocking process us-
ing the Weibull distribution model (Weibull (1951);
Ebeling (2004)), from reliability theory. The parame-
ters of this form of Weibull distribution are the scale
parameter λ, and the shape parameter k. In our study,
all values applied are based on our statistical analysis
of the Blackpool data. We first define k = 6, which
captures a realistically increasing blocking rate over
time. The scale parameter λ, capturing lifetime be-
haviour, is affected by location and seasonal factors,
according to a simple linear function:
λ =
10 ... if gully pot recorded as broken
E
calling
... a calling event
max(90, E −
∑
f ∈F
n
f
∗ s
f
) ... normal state
E
calling
represents the expected number of days
ICORES 2016 - 5th International Conference on Operations Research and Enterprise Systems
298
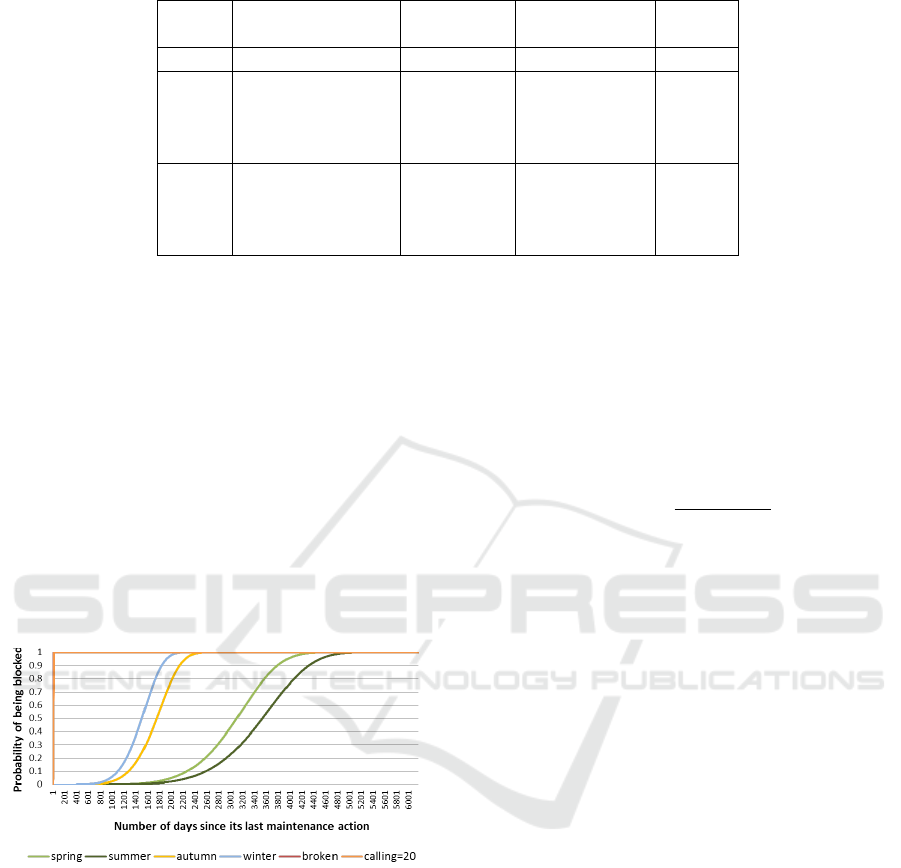
Table 1: Social factor evaluation.
Group Social Concerns
Estimated
value
Value loss
from flooding
Risk
impact
1 Residential £113,000 3% £34
2
Local center £1,130,000 5% £580
District center £1,695,000 5% £870
Business area £565,000 5% £290
Employment sites £226,000 5% £116
3
School £5,168 4% £71
Large hospital £917,808 4% £377
Doctors £9,178 4% £73
Bus route £220 100% £37
from a report on a gully pot to its servicing. E is the
expected number of days that it would take a normal
gully pot to become blocked since its last services.
Here, E = 10.3 years. F is a set of factors that may
affect gully pot lifetime, such as street type, number
of trees nearby, and blown sand effect: n
f
represents
the effect level from a specific factor f ∈ F to a gully
pot; s
f
adjusts the effect from factor f according to
seasonal information. For example, if a gully pot is on
a street with five deciduous trees nearby, then n
f
= 5
with s
f
= 93, 1, 389, 433 in spring, summer, autumn
and winter respectively. If a gully pot location is not
affected by factor f , we simply assign n
f
= 0. Fig. 2
illustrates one example of a gully pot lifetime estima-
tion taking account of the surrounding environment.
Figure 2: Probability of being blocked since last mainte-
nance action (Example of a gully pot lifetime with 5 tree
nearby at different seasons).
4 EXPERIMENT
In this section, we firstly summarise the background
of our problem and simulation. All simulations
were implemented in C# and executed on a cluster
composed of 8 Windows computers, each with 8
cores, Intel Xeon E3-1230 CPU and 16GB RAM.
Simulation Settings
1. Total number of gully pots in the system: 28,149.
2. Broken events: Blackpool council estimates about
1.1% of gully pots are broken every year. This is
represented by each gully pot becoming broken
randomly with probability 0.00003 per day in our
simulation.
3. Blocking probability: a gully pot lifetime is esti-
mated by a Weibull distribution described in Sec-
tion 3.2.2. Every day, each gully pot has a proba-
bility of becoming blocked according to its failure
rate function h
i
(d) =
R
i
(d−1)−R
i
(d)
R
i
(d−1)
, where R
i
(d) =
1 − F
i
(d) is the reliability function.
4. Seasonal factors F: the Blackpool data only al-
lows us to include trees and leaf-fall in our sim-
ulation. Seasonal factors related to the number
of trees nearby highly affect the lifetime of gully
pots, and on average, each gully pot is affected by
0.4 trees in Blackpool.
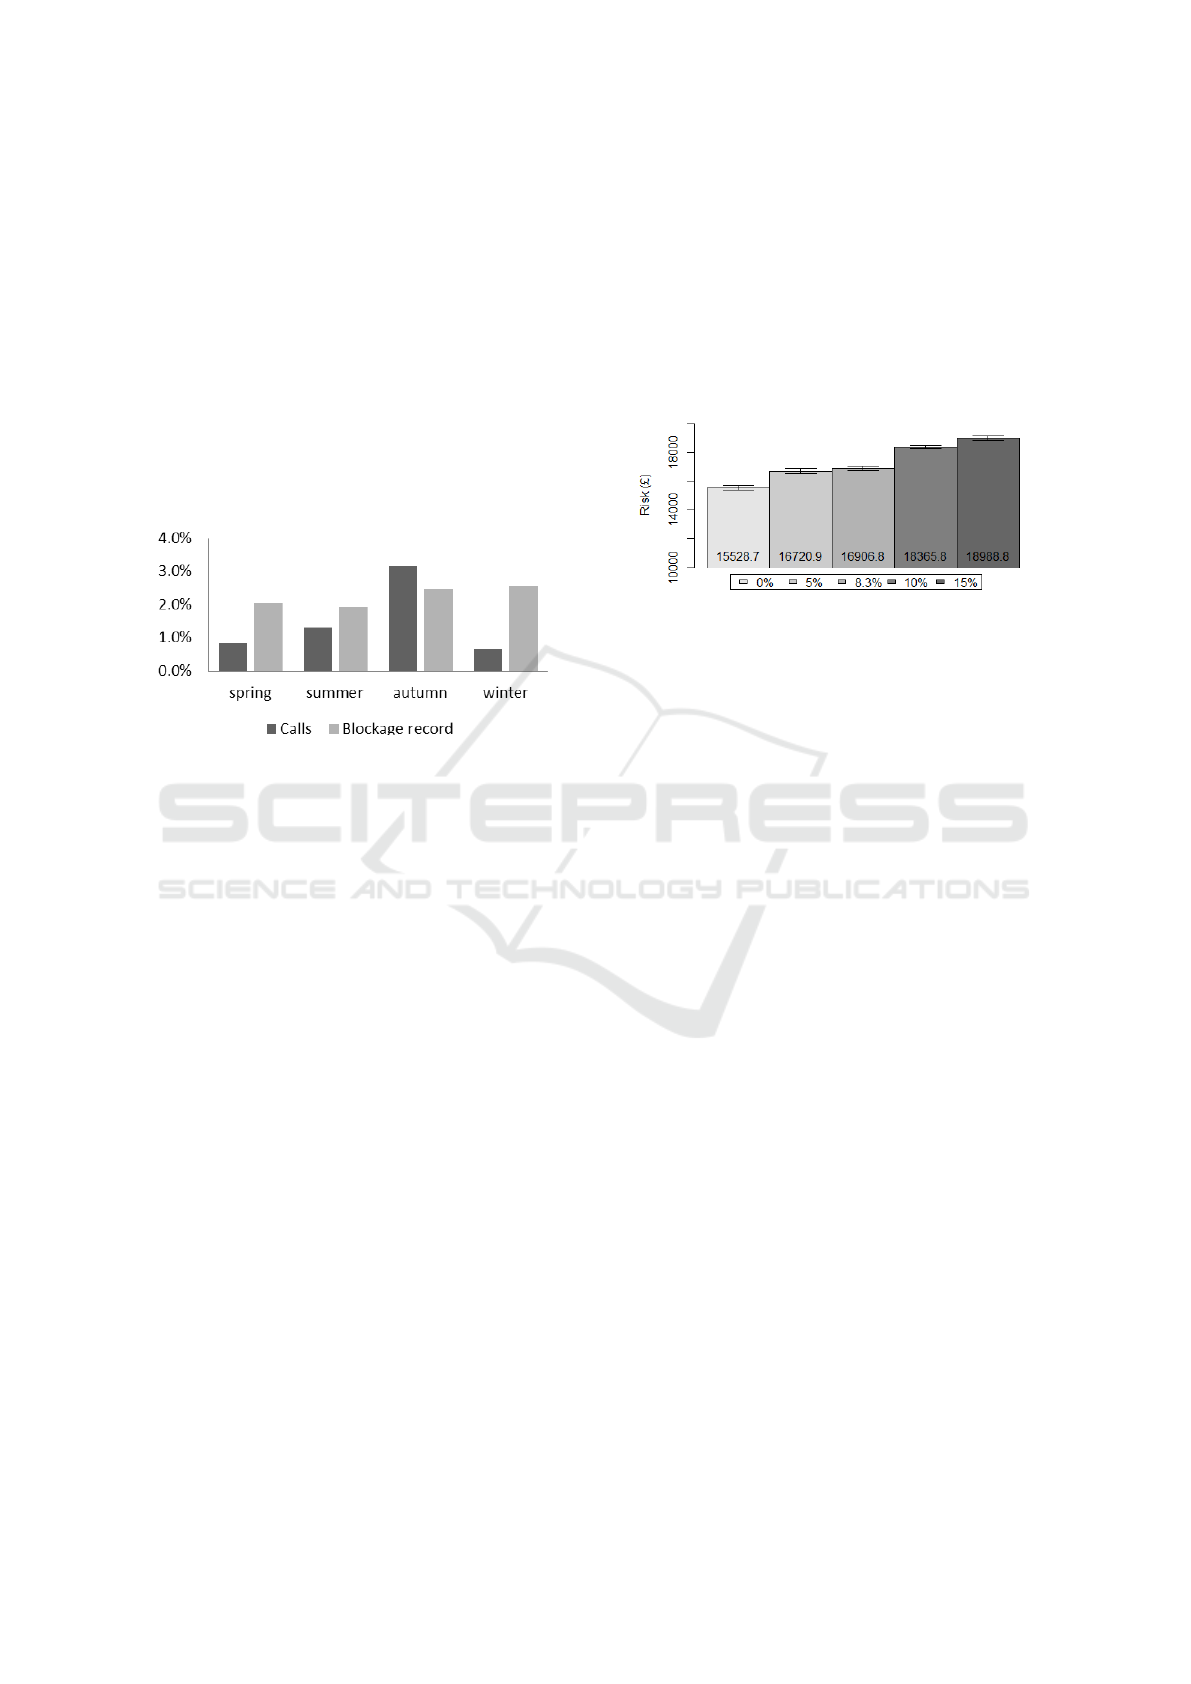
5. Resident calling behaviour: about 1700 calls
are received every year by the Blackpool gully
maintenance team, and most of the calls con-
cern blocked or damaged gully pots. Over
50% of all calls occur during the autumn, as
shown in Figure 3. Our statistical analysis de-
termined that, to match the resident calling be-
haviour in our simulation, on any given day,
the probability of receiving a call if a gully
pot is already broken or blocked is p
calls
(i) =
{0.0033, 0.005, 0.0056, 0.002} for spring through
winter, respectively. If a gully pot is not broken,
there is still a small chance that a call is received,
related to its current condition. The simulation
probability is p
calls
(i) = P
i
(d)∗γ, where γ = 10.62
has been measured experimentally to adjust the
calling probability to match the real data.
Simulation Assumption
1. Planning horizon: In the real world, maintenance
schedules are generated at varying levels of gran-
ularity, from long term (yearly) to short term
(weekly). Here, we only consider the procedure
Risk Driven Analysis of Maintenance for a Large-scale Drainage System
299
described in Section 3.1, where the maintenance
schedule is updated every week according to the
most recent system status reports.
2. Parking issues: inaccessibility during mainte-
nance due to parking usually appears in preventa-
tive maintenance. For corrective actions, includ-
ing servicing for both resident reports and broken
gully pots, we assume the team always has access
in our simulation.
3. Others: as well as broken gullies reported by res-
idents, damage is also found during preventative
maintenance. In this case, the simulation registers
the broken gully and schedules it on a later day.
Figure 3: Seasonal calls and blockages as a percentage of
the total number of gully pots in Blackpool.
These parameters and assumption have been dis-
cussed with Gaist Solutions Ltd. and agreed to be
a realistic representation of gully-pot behaviour in
Blackpool.
4.1 The Impact of Parking Issues
According to the maintenance records, the parking
issue has been identified as a major problem that
decreases the maintenance working efficiency, espe-
cially in the old town, where no extra space was de-
signed for parked cars. The number of parked private
vehicle also increases significantly. Our simulation
helps us to understand the impact of parking on gully-
pot maintenance performance. Therefore, potential
strategies can be proposed such as banning parking
when a maintenance visit for a certain street is sched-
uled.
In simulation, we can test the effect of inaccessi-
ble gully pots using a parameter, x, to represent the
percentage of gully pots that cannot be accessed dur-
ing preventative maintenance each year. The values
of x are 0, 5, 8.3 (the actual value), 10 and 15 per-
cent. Each parameter setting is run over 4 simulated
years, with corresponding seasonal factors and resi-
dential report behaviours.
The results of simulation are shown in Figure 4.
There is an increase in flooding risk as the percentage
of inaccessible drains increases. This suggests that a
policy of suspending parking on streets to be serviced
might improve maintenance efficiency by 8%, which
translates to about £1,400 risk decrease every day. If a
“suspending parking” policy only partially decreases
the number of parked cars (to 5%), little difference
can be observed in risk. When the impact of parking
increases up to 15%, the surface flooding risk increase
significantly by 12%.
Figure 4: The average daily risk of applying maintenance
schedule described in Section 3.1, with different accessibil-
ity settings during preventative maintenance. The bar with
the setting of 8.3% is the current real-world situation. Error
bars show 95% confidence interval.
4.2 What if we Could do
Condition-based Maintenance
(CBM)?
Aside from parking issues, seasonal changes and un-
timely system status information are identified as
other factors that affect the efficiency of drainage sys-
tem maintenance. Seasonal change is an uncontrol-
lable factor. On the other hand, improving low-cost
sensor techniques make it potentially feasible to con-
tinuously monitor gully-pot condition. This would
allow our schedule strategies to be combined with
CBM, discussed in Section 2. Currently, we only find
out that a gully pot is blocked or broken either during
preventative maintenance or if it is reported; because
of this incomplete system information, it is difficult to
produce any optimal schedules.
In simulation, we can test the importance of real
time failure monitoring by varying the proportion of
gully pot failures that are known immediately, as if the
gully pot had a real-time sensor. As shown in Table
2, we use two parameters, “since last maintenance ac-
tion θ” and “percentage of broken gully pots” to con-
trol the system’s initial state. The stable state assumes
that the entire system is well maintained and the num-
ber of days since the last maintenance action for each
gully is uniformly distributed across 1.1 years. Fur-
thermore, there are about 0.4% broken gullies in the
system when it is in the stable situation. The other two
scenarios assume that the system is recovering from a
ICORES 2016 - 5th International Conference on Operations Research and Enterprise Systems
300
natural disaster such that a large number of gullies are
broken or blocked initially regardless of prior mainte-
nance. Both a well maintained gully-pot system (see
Figure 2, recover-1) and a system that has had bad
maintenance (see Figure 2, recover-2) are tested.
Table 2: “since last maintenance” and “percentage of bro-
ken gully pots” set the system’s initial state: for all gully
pots, the days since their last service are evenly distributed
in θ years. We randomly assign a percentage of gully pots
to be in the broken state.
Stable
Recover
1
Recover
2
Since last
maintenance θ
1.1 1.1 3
Initial broken
gully pots
0.4% 2% 2%
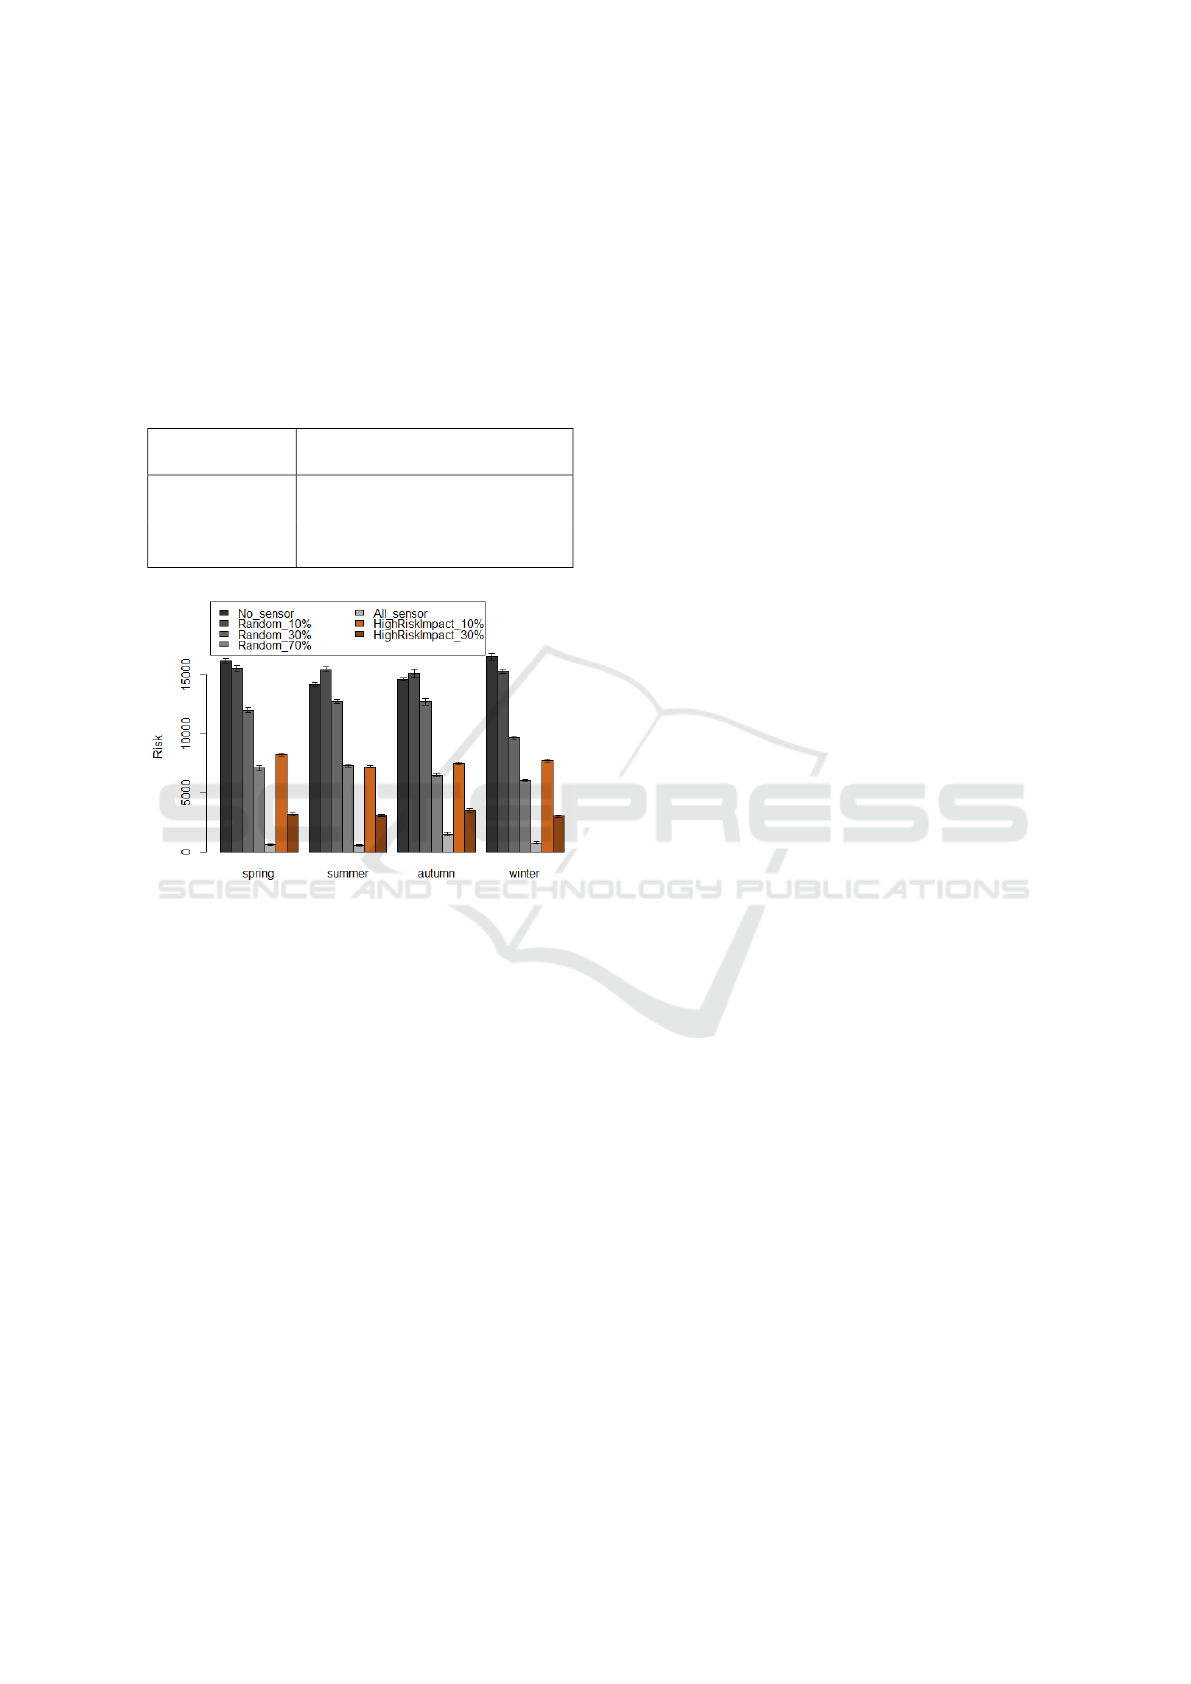
Figure 5: Performance of maintenance in stable with sen-
sors of different install capacity. Error bars show 95% con-
fidence intervals.
Figure 5 presents the average daily risk in four
seasons over a set of four-year simulations. In com-
parison to the simulation of current blockage report-
ing, the instant information simulation shows a re-
duction in risk of about 92%. For the case where
all gully pots have instant (sensor) information, the
results clearly show the impact of seasonal factors:
falling leaves in autumn increase risk by about two
times compared to other seasons. Interestingly, we
can not observe the clear risk difference between sea-
sons when no sensors are installed. This is because
the different residents’ reporting behaviour strongly
affects the responding time of broken/blocked gullies.
The dependence on local residents’ reports bury big
hidden dangers for the entire system.
To provide further insight into how the availabil-
ity of information on gully pots affects flooding risk,
we adapt the simulation to provide instant information
from only some locations, simulating the localised in-
stallation of sensors. Setting 10% of gullies to have
sensors, allows us to compare an even distribution of
sensors to the results when sensors are focused on
critical areas of the city. We find that focusing on
high risk areas reduces the daily risk, on average, by
about 28%. When monitoring is increased to cover
30% gullies, the comparable saving is a 75% risk de-
crease.
Figure 6 illustrates the daily risk change over
two years in recovery states. In scenario recovery-
1, the system with full sensoring performs the best
in terms of recovering speed, followed by 30% high-
risk-impact and 70% random strategies. The faster
recovery also implies lower total surface water flood-
ing risk through the recovery period. In scenario
recovery-2, due to the previous poor system mainte-
nance, the recovery period is significantly longer in
all cases compared to scenario 1. Also, the peak point
uncovers the vulnerability of a badly maintained sys-
tem during the high-risk season. However, the sen-
soring still helps the maintenance team to produce a
more informed schedule, which results in less total
risk during the recovery period.
4.2.1 Discussion
The above simulations show the contribution of
timely information to improving the gully-pot system
maintenance quality. However, the proposed sensor
system also increases the management complexity,
where extra cost and manpower are needed to ensure
that the system is always working correctly. Further-
more, we assume in our simulation that instant gully-
pot condition information can be received with no er-
rors, which is hypothetical. In practice, current sen-
sor techniques can achieve up to 85% reliability (See
et al. (2012)). More research is needed into both the
hardware aspect and the optimization of scheduling
strategies.
Another issue that has been noted is the commu-
nication performance of sensors, which decreases in
weather condition such as rain or snow (See et al.
(2012)). Therefore, the gully-pot system maintenance
should combine a risk estimation approach (i.e. Sec-
tion 3.2) with sensors to deliver optimized scheduling.
Our simulation shows large advantages when sen-
sors are installed in high-risk areas. However, since
sensors must be close enough to communicate wire-
lessly with each other, the network topology must be
considered (Yick et al. (2008); See et al. (2012)). In
order to successfully integrate sensors into the cur-
rent gully-pot system, further analysis is needed into
the technical feasibility and the balance between costs
and benefits (i.e. surface water flooding risk decreas-
ing) to determine if the installation and maintenance
costs of the sensors are worthwhile.
Risk Driven Analysis of Maintenance for a Large-scale Drainage System
301

(a) Daily risk tracking of scenario recovery-1. (b) Daily risk tracking of scenario recovery-2.
Figure 6: Performance of maintenance in recovery state with sensors of different install capacity.
5 CONCLUSION
This paper considers a real-world drainage system
maintenance problem. A risk-driven analysis ap-
proach is proposed to evaluate the performance of
maintenance actions. We focus on the “parking is-
sues” and “untimely system status information” that
are identified as potential weaknesses of the current
maintenance approach (see Section 3.1).
To summarise, “banning parking” could improve
gully pot maintenance to some extent. However, this
policy increases management complexity and resi-
dents’ complaints. The “untimely system status in-
formation” is the dominant factor that weakens the
efficiency of current maintenance. Our preliminary
simulation shows promise in sensor informed main-
tenance. Low-cost wireless sensor techniques could
be a good investment to help produce an informed
maintenance schedule and lower risk. Further work
is needed to form a cost/benefit analysis to discover
the optimal quantity of sensors to deploy, their loca-
tions and network topology. The technical feasibil-
ity of sensors’ topology should also be considered.
Further work is also needed to discover the potential
decrease in maintenance scheduling efficiency due to
false alarms caused by the “sensor technique”. New
scheduling approaches may be required to make best
use of the potentially large amount of data generated
by the sensors.
In practice, due to the immaturity of sensor tech-
nology, we suggest that the combination of time-
based preventative maintenance (with risk estimation)
and condition-based corrective maintenance (with
sensors) is an optimal approach.
ACKNOWLEDGEMENTS
The authors would like to thank Gaist Solutions Ltd.
for providing data and domain knowledge. This re-
search is part of the LSCITS project funded by the
Engineering and physical sciences research council
(EPSRC).
REFERENCES
Ahmad, R. and Kamaruddin, S. (2012). An overview of
time-based and condition-based maintenance in in-
dustrial application. Computers & Industrial Engi-
neering, 63(1):135–149.
An, Y. J., Kim, Y. D., Jeong, B. J., and Kim, S. D. (2012).
Scheduling healthcare services in a home healthcare
system. Journal of the Operational Research Society,
63(11):1589–1599.
Baik, H.-S., Jeong, H. S. D., and Abraham, D. M.
(2006). Estimating Transition Probabilities in Markov
Chain-Based Deterioration Models for Management
of Wastewater Systems. Journal of Water Resources
Planning and Management, 132(1):15–24.
BBC (2011). Flooding affects Pembrokeshire resi-
dents and businesses. Date accessed: 2015-09-04.
http://www.bbc.co.uk/news/uk-wales-15441912.
BBC (2012). Floods: North Wales Police travel
warning after rain. Date accessed: 2015-09-05.
http://www.bbc.co.uk/news/uk-wales-19702806.
Blackpool (2009). Blackpool strategic flood risk
assessment. Date accessed: 2015-07-05.
https://www.blackpool.gov.uk/Residents/Planning-
environment-and-community/Documents/Blackpool-
Strategic-Flood-Risk-Assessment.pdf. Technical
Report June.
Butler, D., Xiao, Y., and Karunaratne, S. (1995). The gully
pot as a physical, chemical and biological reactor. Wa-
ter Science and Technology, 31(7):219–228.
Campos, J. (2009). Development in the application of ICT
in condition monitoring and maintenance. Computers
in Industry, 60(1):1–20.
ICORES 2016 - 5th International Conference on Operations Research and Enterprise Systems
302

Carnero Moya, M. C. (2004). The control of the setting up
of a predictive maintenance programme using a sys-
tem of indicators. Omega, 32(1):57–75.
Chen, Y., Cowling, P., and Remde, S. (2014). Dynamic Pe-
riod Routing for a Complex Real-World System : A
Case Study in Storm Drain Maintenance. In Evolu-
tionary Computation in Combinatorial Optimisation,
pages 109–120.
Christofides, N. and Beasley, J. E. (1984). The period rout-
ing problem. Networks, 14(2):237–256.
Claassen, G. D. H. and Hendriks, T. H. B. (2007). An ap-
plication of Special Ordered Sets to a periodic milk
collection problem. European Journal of Operational
Research, 180(2):754–769.
Constantine, G., Darroch, J., and Miller, R. (1996). Pre-
dicting underground pipeline failure. WATER -
MELBOURNE THEN ARTARMON, 23(2):9–10.
Cowling, P. and Johansson, M. (2002). Using real time in-
formation for effective dynamic scheduling. European
Journal Of Operational Research, 139(2):230–244.
Cutter, S. L., Carolina, S., and Boruff, B. J. (2003). So-
cial Vulnerability to Environmental Hazards. Social
Science Quarterly, 84(2):242–261.
Duffuaa, S., Ben-Daya, M., Al-Sultan, K., and a.a. Andi-
jani (2001). A generic conceptual simulation model
for maintenance systems. Journal of Quality in Main-
tenance Engineering, 7(3):207–219.
Ebeling, C. E. (2004). An introduction to reliability and
maintainability engineering. Tata McGraw-Hill Edu-
cation.
Gaur, V. and Fisher, M. L. (2004). A Periodic Inventory
Routing Problem at a Supermarket Chain. Operations
Research, 52(6):813–822.
Hansen, P., Mladenovi
´
c, N., and Moreno P
´
erez, J. A.
(2010). Variable neighbourhood search: Methods
and applications. Annals of Operations Research,
175(1):367–407.
Karlsson, K. and Viklander, M. (2008). Polycyclic aromatic
hydrocarbons (PAH) in water and sediment from gully
pots. Water, Air, and Soil Pollution, 188(1-4):271–
282.
Kenne, J. P. and Nkeungoue, L. J. (2008). Simultaneous
control of production, preventive and corrective main-
tenance rates of a failure-prone manufacturing system.
Applied Numerical Mathematics, 58(2):180–194.
Kleiner, Y. and Rajani, B. (2001). Comprehensive review
of structural deterioration of water mains: statistical
models. Urban Water, 3(3):131–150.
Le Gat, Y. and Eisenbeis, P. (2000). Using maintenance
records to forecast failures in water networks. Urban
Water, 2(3):173–181.
Leylandguardian (2015). Blocked drain causes flooding
danger on Lancashire road. Date accessed: 2015-08-
24. http://www.leylandguardian.co.uk/news/blocked-
drain-causes-flooding-danger-on-lancashire-road-1-
7425326.
Madanat, S. and Ibrahim, W. H. W. (1995). Poisson regres-
sion models of infrastructure transition probabilities.
Journal of Transportation Engineering, 121:267–272.
Morcous, G., Rivard, H., and Hanna, A. M. (2002). Mod-
eling bridge deterioration using case-based reasoning.
Journal of Infrastructure Systems, 8(3):86–95.
Scarf, P. a. and Cavalcante, C. a. V. (2010). Hybrid
block replacement and inspection policies for a multi-
component system with heterogeneous component
lives. European Journal of Operational Research,
206(2):384–394.
Scott, K. (2012). Investigating Sustainable Solutions for
Roadside Gully Pot Management. PhD thesis.
See, C. H., Horoshenkov, K. V., Abd-alhameed, R. A., Hu,
Y. F., and Tait, S. J. (2012). A Low Power Wire-
less Sensor Network for Gully Pot Monitoring in Ur-
ban Catchments. IEEE Sensors Journal, 12(5):1545–
1553.
Shamir, U. and Howard, C. D. (1978). An analytic approach
to scheduling pipe replacement. Journal of the Amer-
ican Water Works Association, 71.
Shieldsgazette (2012). Flooding hell caused by
blocked gully. Date accessed: 2015-08-24.
http://www.shieldsgazette.com/news/local-
news/flooding-hell-caused-by-blocked-gully-1-
4761698.
Shih, L. H. and Chang, H. C. (2001). A routing and schedul-
ing system for infectious waste collection. Environ-
mental Modeling and Assessment, 6(4):261–269.
Thieken, A., Ackermann, V., Elmer, F., Kreibich, H.,
Kuhlman, B., Kunert, U., Maiwald, H., Merz, B.,
Muller, M., Piroth, K., Schwarz, J., Schwarze, R.,
Seifert, I., and Seifert, J. (2008). Methods for the eval-
uation of direct and indirect flood losses.
UK GOV (2015). Price Paid Data
2015. Date accessed: 2015-09-09.
https://www.gov.uk/government/statistical-data-
sets/price-paid-data-downloads.
Weibull, W. (1951). A statistical distribution function of
wide applicability. Journal of applied mechanics,
18:293–297.
Wu, J., Adam Ng, T. S., Xie, M., and Huang, H. Z. (2010).
Analysis of maintenance policies for finite life-cycle
multi-state systems. Computers and Industrial Engi-
neering, 59(4):638–646.
Yick, J., Mukherjee, B., and Ghosal, D. (2008). Wire-
less sensor network survey. Computer Networks,
52(12):2292–2330.
Risk Driven Analysis of Maintenance for a Large-scale Drainage System
303
