
Noise Influence on Low Contrast Image Correction for Soft X-Ray
Projection Microscopy
Erdenetogtokh Jamsranjav
1
, Tatsuo Shiina
1
, Kenichi Kuge
1
, Atsushi Ito
2
and Yasuhito Kinjo
3
1
Graduate School of Advanced Integration Science, Chiba Univ., Chiba-shi, Chiba, 263-8522, Japan
2
School of Engineering, Tokai Univ., Hiratsuka-shi, Kanagawa, 259-1292, Japan
3
Tokyo Metropolitan Industrial Technol. Res. Inst, Koto-ku, Tokyo, 135-0064, Japan
Keywords: Soft X-ray, Projection Microscopy, Iteration Procedure, Restraint Condition.
Abstract: Soft X-ray projection microscopy has been developed for high magnified imaging of hydrated biological
specimens because water window region is available. The projection microscopy is a simple optical layout
and has advantages over other types of microscopes particularly for biological specimens because of its
wide viewing area, easy zooming function and easy extension to CT. However the projection image is
blurred by the diffraction of X-rays, resulting in the deterioration of the spatial resolution. In this study, the
blurred images have been corrected by an iteration procedure, i.e., Fresnel and inverse Fresnel
transformations are repeated. The correction was found to be not effective for every image, especially for
images with low contrast. A contrast enhancement method prior to the iteration procedure was installed to
make the iteration procedure more effective, but it was not enough yet due to the influence of background
noise. We evaluated dependency between the background noise level and iteration effect in the cases with or
without the contrast enhancement prior to the iteration procedure by simulation. We also demonstrated
upper limits of the background noises which chromosome images are effectively corrected by the iteration
procedure.
1 INTRODUCTION
Soft X-ray microscopy covers wavelength region
called water window. X-ray attenuation in this
region is significantly smaller in water than in
organic material. Therefore, it is possible to observe
the biological specimens at cellular and sub-cellular
levels with intact and/or in situ situation (Legall et
al., 2013; Weigert et al., 2013; Schneider et al.,
2000; Kirz et al., 1995).
Fresnel zone plate (FZP) has been frequently
used for focusing optics in X-ray microscopy in
combination with synchrotron radiation or a laser
plasma X-ray source (Bertilson et al., 2009; Kirz et
al., 1995), but there has been no approach to use
FZP to produce a point X-ray source in a projection
type X-ray microscopy. The projection microscopy
has the following advantages.
A) It has a simple optical layout and wide
viewing area.
B) Zooming is easily adjusted by changing
distance between a specimen and a pinhole.
C) It is possible to extend to CT by installation
of an additional part to rotate a specimen.
However the projection image is blurred by the
diffraction of soft X-rays and contains diffraction
fringes around the specimen image, leading the
spatial resolution to be worse. In this study, the
blurred images have been corrected by an iteration
procedure, which has performed cycled calculations
of Fresnel and inverse Fresnel transformations.
Earlier studies confirmed the iteration effectiveness
and also checked some additional methods such as
contrast enhancement prior to the iteration procedure
to make the iteration procedure more effective
(Jamsranjav et al., 2015; Al-amri et al., 2010; Shiina
et al., 2009; David et al., 2005). However, some
images showing very low contrast such as
chromosome images were not correctable probably
due to influence of background noise, because the
contrast of diffraction fringes and background noise
distribution were compatible.
This study evaluated dependency between the
iteration effect and the background noise level on
simulation image with low contrast. The contrast of
Jamsranjav, E., Shiina, T., Kuge, K., Ito, A. and Kinjo, Y.
Noise Influence on Low Contrast Image Correction for Soft X-Ray Projection Microscopy.
DOI: 10.5220/0005747001690176
In Proceedings of the 4th International Conference on Photonics, Optics and Laser Technology (PHOTOPTICS 2016), pages 171-178
ISBN: 978-989-758-174-8
Copyright
c
2016 by SCITEPRESS – Science and Technology Publications, Lda. All rights reserved
171
the simulation image was adjusted to be similar with
that of projection images of chromosomes. It was
about 1.6% of the image contrast. Upper limits of
background noises that the images are corrected
effectively were evaluated. The noise sizes were
based on the noises of experimental projection
images which the blur correction was not successful.
The noise sizes were based on the noises of
experimental projection images which the blur
correction was not successful.
2 METHODS
2.1 Projection Experiment
The projection microscopy captures a magnified
image of specimen by detection of monochromatic
soft X-rays transmitted through and turned around
specimen. In order to make a point source of
monochromatic soft X-rays, the optics of
microscopy are constructed with a grating
monochromator, a zone-plate and a pinhole from
bending magnet beam line BL-11A at the KEK
(High Energy Accelerator Research Organization)
Photon Factory in Tsukuba, Japan. The camera was
a back-illuminated X-ray CCD with 24.8m pixel-
pitch (Hamamatsu Photonics C4880-30-26W).
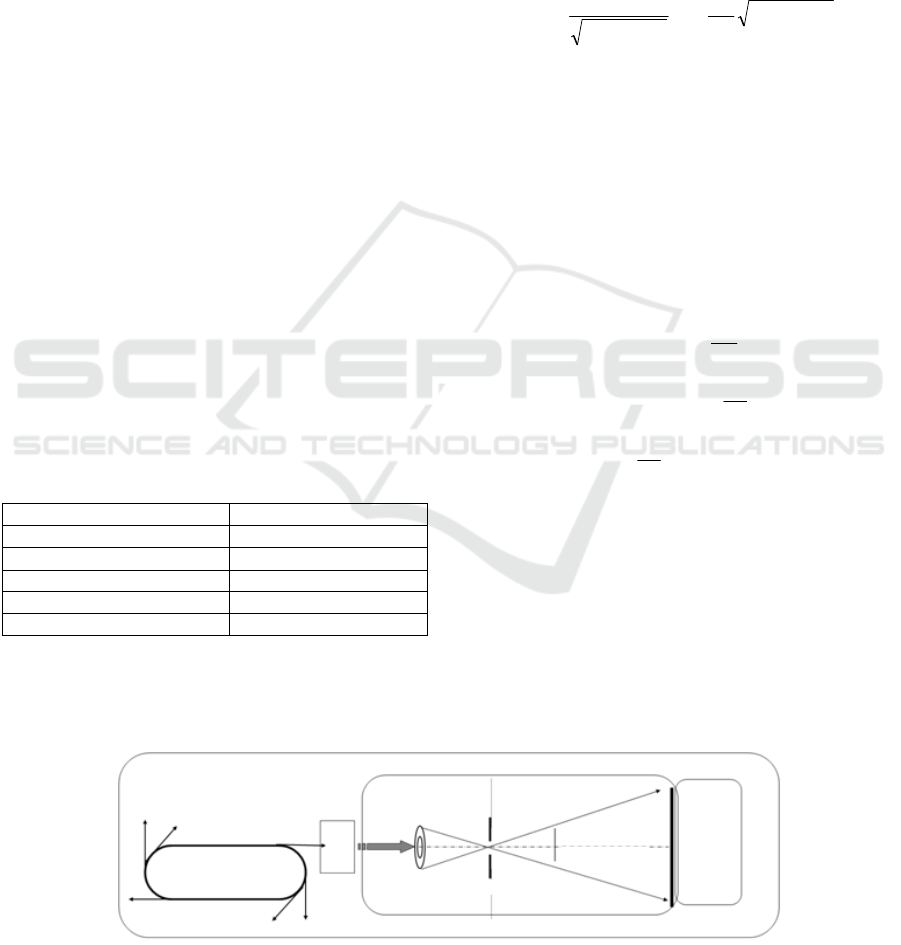
Optical layout of the microscopy was shown in Fig.1.
Projection conditions were shown in Table 1.
Table 1: Projection conditions.
Items Values
X-ray energy 700 eV
Pinhole diameter
0.5
m and 1
m
Distance (Pinhole-CCD) 329mm and 252 mm
Magnification 47 – 658 times
Projection time 40 sec – 10 min
2.2 Iteration Procedure
By the iteration procedure, X-ray intensity
distribution at the specimen surface are calculated
and extracted as a correction image of specimen. For
the calculation, we need phase and amplitude
information of a projection image at a CCD screen.
The amplitude information is possible to obtain from
the projection image. X-ray intensity distributions
were recorded on a CCD screen, while there was no
information for the phase. Therefore, spherical wave
propagations are calculated for initial phase
information using equation (1).
22
22
(mT)r
λ
i2π
exp
(mT)r
1
Φ(mT)
(1)
where Φ
(
mT
)
: wave amplitude distribution on CCD
screen, λ: wavelength, r: distance between pinhole
and CCD screen, T: sampling interval on CCD
screen, m: positive integer.
Subsequently, iteration procedure performs
cycled calculations of Fresnel (FT) and inverse
Fresnel (IFT) transformations taking into account of
restriction condition (RC) using equation (2) to
approach to proper phase distribution. The iteration
procedure is shown in Fig.2.
1N
0n
2
o
)nT(mT
λR
iπ
)expf(nTF(mT):FT
N
λR
TT:
)nT(mT
λR
iπ
F(mT)exp)f(nT:IFT
o
1N
0m
2
oo
RC
(2)
where F(mT): X-ray intensity distribution on CCD
screen, f(nT): X-ray intensity distribution on
specimen surface, λ : wave length, R: distance
between specimen and CCD screen, N: sampling
number, T
0
: sampling interval on specimen surface,
T: sampling interval on CCD screen, n, m: positive
integer. The RC is required in order to make cycled
calculation of FT and IFT with closed relation.
Figure 1: Optical layout of soft X-ray projection microscopy.
Synchrotron
Spectroscope
Zone-plate
Pinhole
Specimen
CCD
PHOTOPTICS 2016 - 4th International Conference on Photonics, Optics and Laser Technology
172
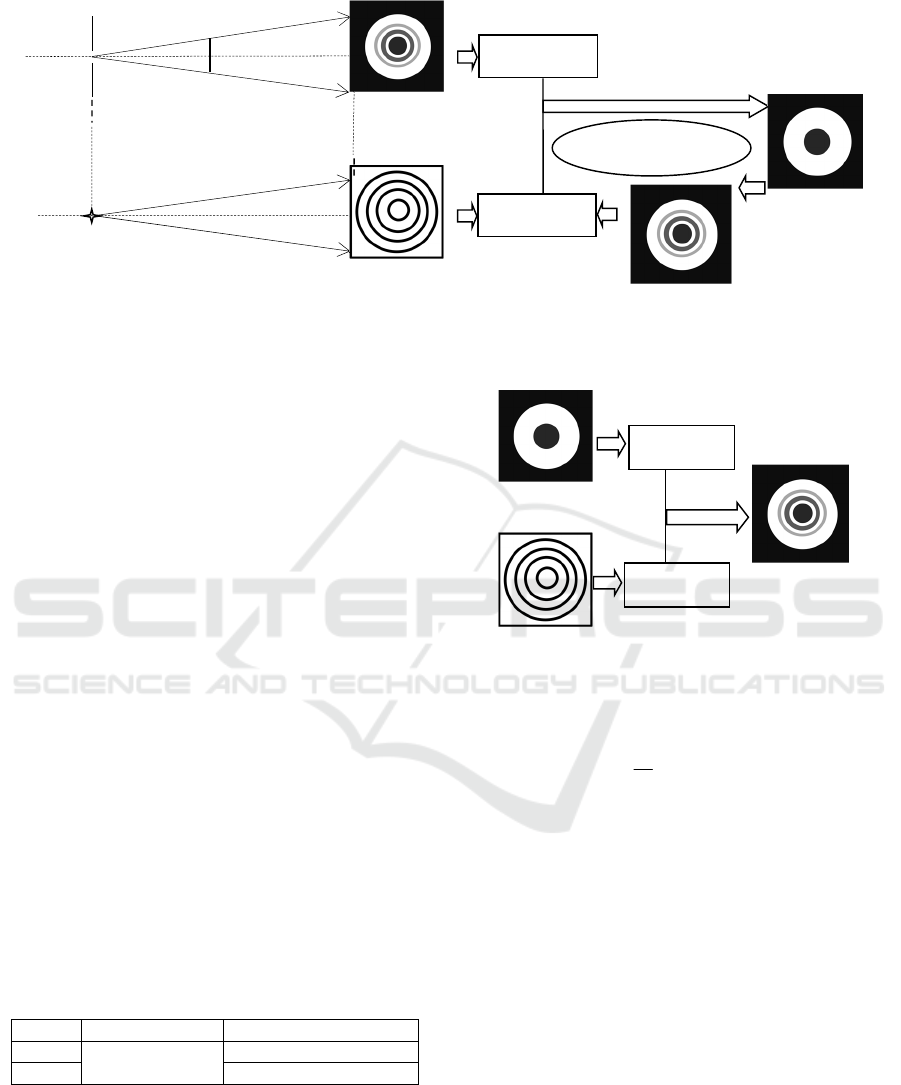
Figure 2: Iteration procedure.
2.3 Simulation of X-ray Beam
Propagation
Simulation program performs FT calculation from
specimen surface to CCD screen and produces an
image on CCD screen instead of experimental
projection image. Intensity distribution describing
specimen figure is prepared as amplitude data on
specimen surface. The phase distribution was
produced by a calculation of spherical wave
propagation to specimen surface. The simulation
algorithm is shown in Fig.3.
The simulation effect was checked for an image
with high contrast. The result is shown in Fig.4.
Diffraction fringes were generated by the simulation
and corrected by iteration procedure successfully.
For the evaluation of the influence of the
background noise, the noise was set to distribute by
using random number generator. Noise size was
adjusted to small or large values as shown in Table
2. The sizes were based on the noise information of
experimental projection images with low or very low
contrasts respectively for which the blur correction
was not effective. Noise numbers were set up as
variables.
Table 2: Noise size for the simulation images.
Size Width (pixels) Height (grayscales)
1)
Small
4
10
-
4
~10
-
2
Large 3*10
-
2
~5*10
-
2
1) Normalized values with whole range of image grayscale
We adopted MSE (Mean Squared Error) as one
of metrics in evaluating noise levels. It takes the
noise numbers and sizes into account and calculated
by equation (3).
Figure 3: Simulation algorithm.
N
n_1
20
nn
)G-(G
N
1
MSE
(3)
where
n
G : grayscale value of a pixel with No. n for
the simulation image with noise,
0
n
G
: grayscale
value of a pixel with No. n for the simulation image
without noise, N (=512*512): total number of the
image pixels.
3 RESULTS AND DISCUSSIONS
3.1 Iteration Effect
Iteration effect was checked in the cases of many
different patterns of projection conditions such as
exposure time, magnification and pinhole diameter,
etc. Representative results were shown in Fig.5 for
chromosome, and Fig.6 (a) for latex and (b) for
chromosome as the images with low contrast, high
Phase
FT
Projection image
(simulation)
Amplitude
Intensity distribution
on specimen surface
REPITATIONS
Spherical wave distribution
Phase
Point source
(assumption)
Spherical wave propagation
(calculation)
Pinhole
X-ray propagation
(experiment)
Projection image
Amplitude
Specimen
IFT
Projection image
(calculation)
Projection image
on specimen
surface
FT
Phase distribution of spherical
wave on specimen surface
Noise Influence on Low Contrast Image Correction for Soft X-Ray Projection Microscopy
173
(a) Specimen surface (b) Projection image on CCD screen (c) Corrected image on specimen surface
Figure 4: Simulation effects on high contrast image.
contrast and very low contrast, respectively.
Following 3 results were obtained.
A) Iteration effect was more effective for the
latex particle than biological specimen
(chromosome). The image contrast was also
higher for the latex particle than chromosome.
We considered the reason of poor iteration
effects for the chromosome images; it may
result from the decreased contrast of the
diffraction fringes due to the high X-ray
transmittance to the chromosome. Therefore
the iteration process is more susceptible to
CCD noise, the unevenness of the
illumination intensity, and scattering from
micro-fragments derived from inner-
components of the specimen. (Fig. 6(a))
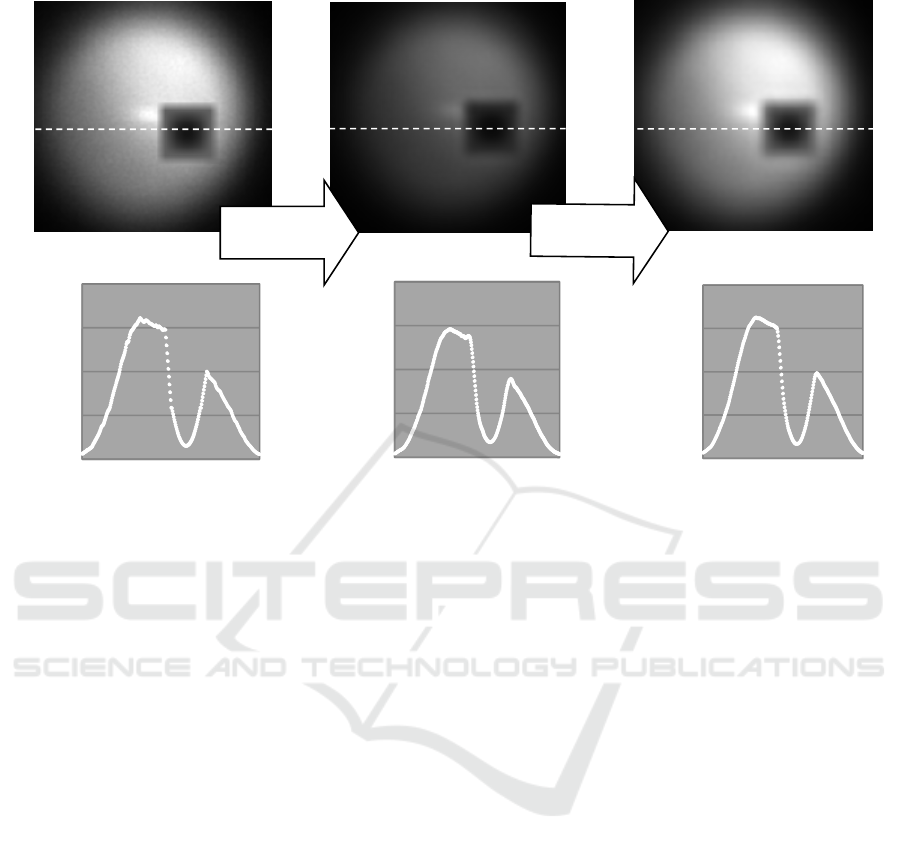
B) Some images with low contrast were
corrected when the image contrast was
enhanced prior to the iteration procedure. It is
considered that the method could improve
enough difference between the contrast of
diffraction fringes and background grayscale
distribution. (Fig. 5)
C) For the very low contrast images of
chromosome, the iteration procedure was not
effective in all of the cases with or without
contrast enhancement prior to the iteration
procedure. Some or whole parts of the images
were lost by the iteration procedure, which
was probably due to the low contrast for the
iteration program. (Fig. 6(b))
To examine the above results, we have evaluated
the influence of the background noise to the iteration
effect with the simulation image. Some results are
shown in the next section.
3.2 Noise Influence on Iteration
Procedure
Projection image was produced by FT calculation as
a simulation image. The contrast was adjusted to
1.6%, which was referred to projection images of
chromosome. Background noises were set to
distribute on the simulation images by using random
number generator. The influence of the background
noise to the iteration procedure was evaluated in
many cases of the noise numbers and noise sizes as
shown in Table 2.
Iteration results for the simulation images were
shown in Fig.7, Fig.8 and Fig.9. The figures show
correctable images in the cases without or with the
contrast enhancement prior to the iteration procedure
and an uncorrectable image for the both cases,
respectively.
0
20000
40000
60000
80000
100 200 300 400
Grayscale
Position
0
10000
20000
30000
40000
50 250 450
Grayscale
Position
0
20000
40000
60000
80000
100 200 300 400
Grayscale
Position
Simulation
Iteration
PHOTOPTICS 2016 - 4th International Conference on Photonics, Optics and Laser Technology
174
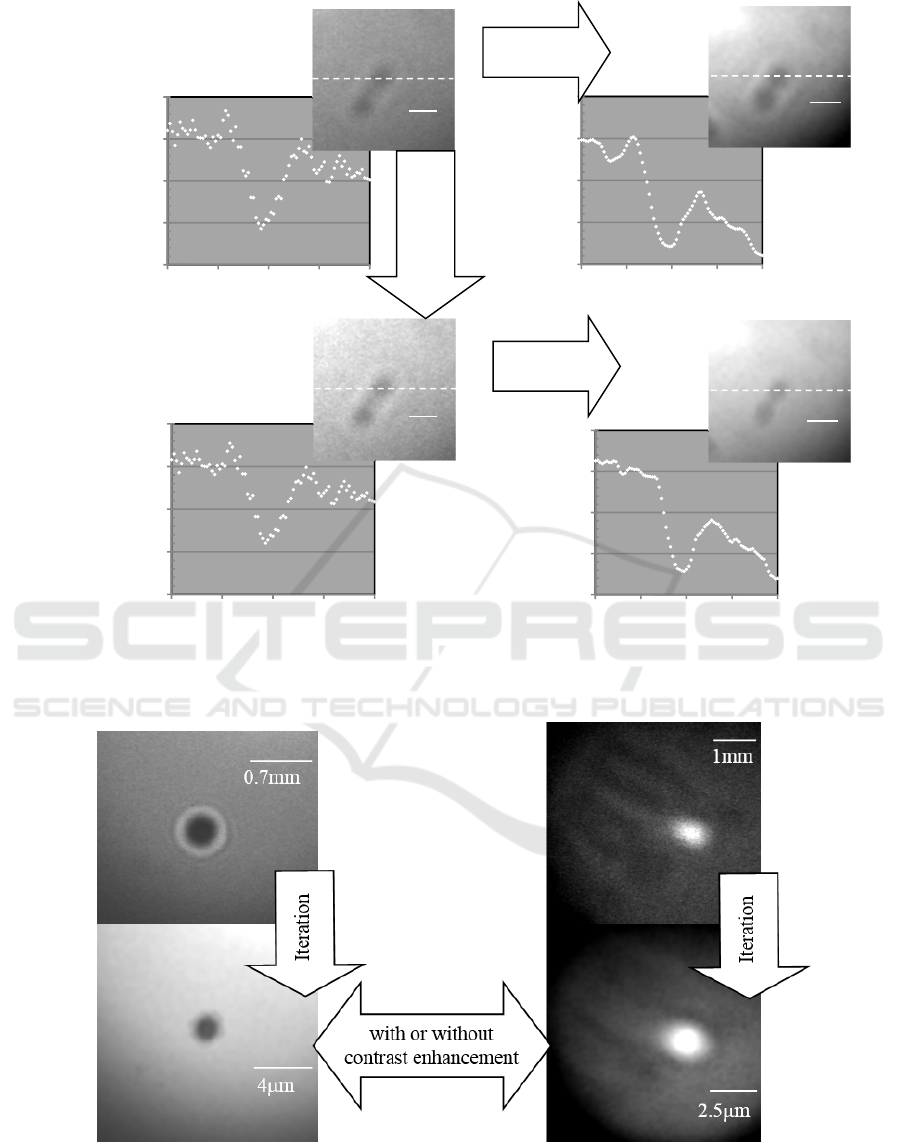
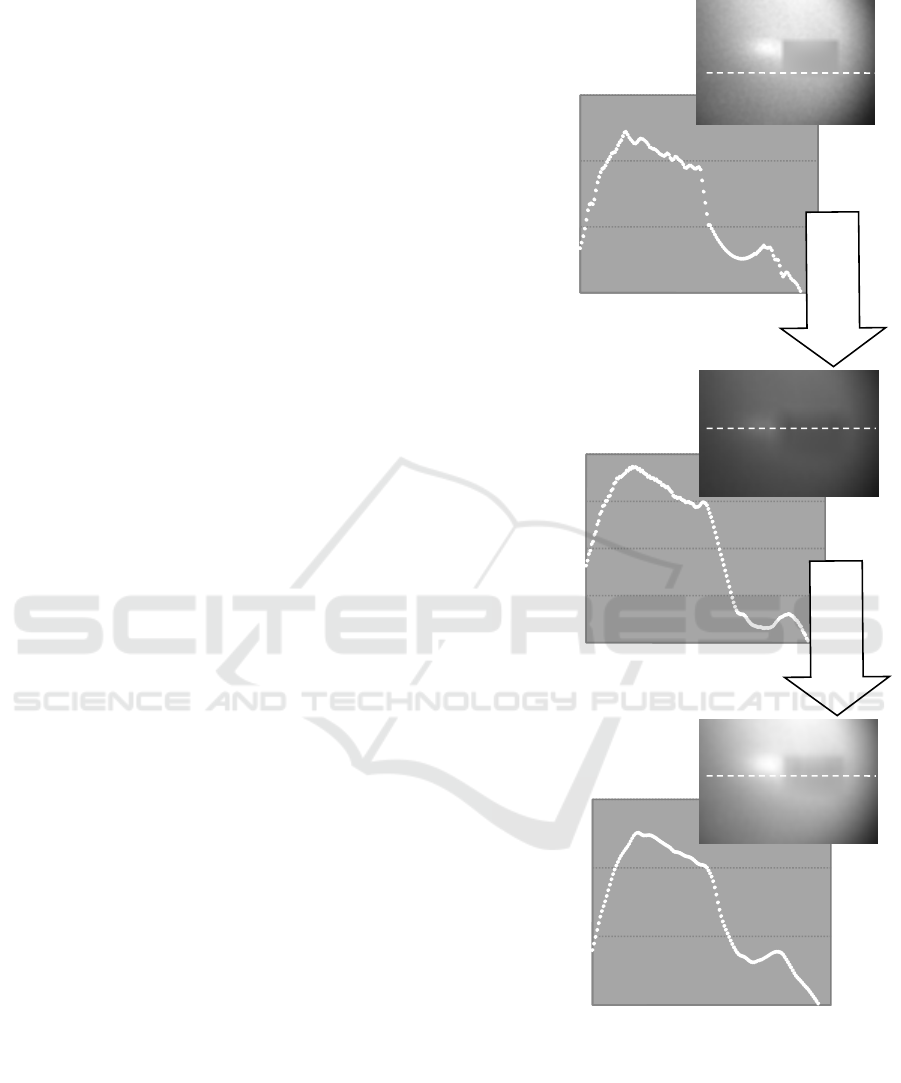
Figure 5: Iteration results for an image with low contrast. (Chromosome [Pinhole diameter: 0.5m, Magnification: 219
times, Exposure time: 3 min]).
(a) (b)
Figure 6: Iteration results for the images with high and very low contrasts. (a) Latex particle [Pinhole diameter: 0.5m,
Magnification: 165 times, Exposure time: 3 min], (b) Chromosome [Pinhole diameter: 0.5m, Magnification: 504 times,
Exposure time: 3 min].
10000
15000
20000
25000
30000
40 60 80 100 120
Grayscale
Position
30000
35000
40000
45000
50000
40 60 80 100 120
Grayscale
Position
10000
20000
30000
40000
50000
40 60 80 100 120
Grayscale
Position
30000
35000
40000
45000
50000
40 60 80 100 120
Grayscale
Position
1mm
1mm
5
m
5
m
Contrast
Enhancement
Iteration
Iteration
Noise Influence on Low Contrast Image Correction for Soft X-Ray Projection Microscopy
175
Upper limits of the background noises that the
image is effectively corrected by iteration procedure
were examined. The noise level was evaluated by
MSE.
The following results were obtained.
A) The iteration correction was effective when
the image did not contain any noise. (Fig.7)
B) For the image containing background noises
with small sizes and high levels, diffraction
fringes could not be corrected by the iteration
procedure only. The upper limit of the
background noise level was about 4*10
5
of
MSE underwhich the image was effectively
corrected by the iteration procedure only.
However the image was correctable in the
case with the contrast enhancement prior to
the iteration procedure for all of the noise
level. (Fig. 8)
C) For the image containing background noises
with large sizes and high levels, whole or
some parts of the image were lost by the
iteration procedure. The upper limit of the
background noise level was about 10
6
of
MSE underwhich the image was effectively
corrected by the iteration procedure. The
image was not correctable in the both cases
with or without contrast enhancement prior to
the iteration procedure. (Fig. 9)
Future problems are suggested from the above
results.
A) Noise sources should be identified to reduce
the background noises by adjusting the noise
sources.
B) Noise removal methods of image processing
should be developed to improve the iteration
effect with noise sources.
4 CONCLUSIONS
In the first step of this study, we aimed to
demonstrate the iteration effectiveness and the
iteration effect was checked for the projection
images of the two types of latex particles with 2 and
10 m diameters and chromosomes in the cases with
or without the contrast enhancement prior to the
iteration procedure.
The iteration procedure was not effective for all
of the images. Especially, the effect was poor for
low contrast images of chromosomes.
The contrast enhancement method was effective
for correction of the images which were not
correctable by the iteration procedure only. The
method could produce enough difference between
Figure 7: Iteration result for simulation image without
noise.
the contrast of diffraction fringes and the
background grayscale distribution. However, further
low contrast images could not correctable yet.
40000
50000
60000
70000
170 220 270 320
Grayscale
Position
20000
22500
25000
27500
30000
150 200 250 300
Grayscale
Position
40000
50000
60000
70000
170 220 270 320
Grayscale
Position
Simulation
Iteration
PHOTOPTICS 2016 - 4th International Conference on Photonics, Optics and Laser Technology
176
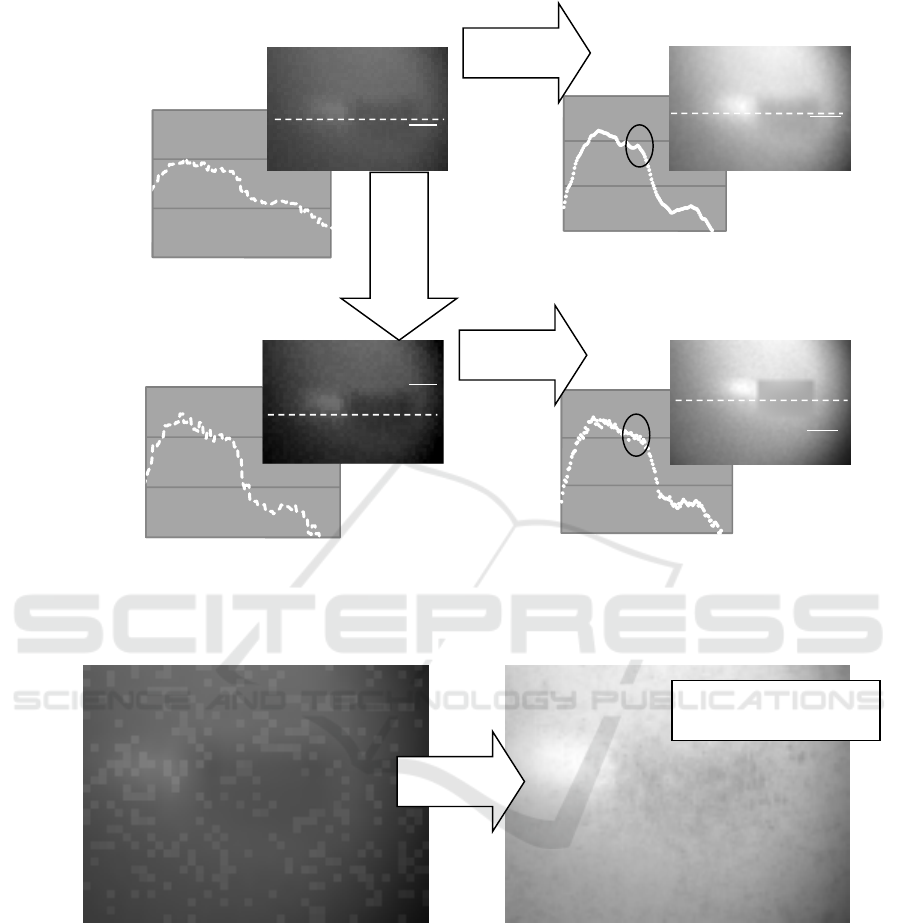
Projection image Corrected image
Figure 8: Iteration result for simulation image with small noises (MSE: 4*10
5
). (Circular marks on the corrected images
show diffraction fringes situation).
Figure 9: Iteration result for simulation image with large noises (MSE: 1.5*10
6
).
As the second step, influence of the background
noise to the iteration effectiveness was evaluated
using the simulating calculation. Iteration effect
became worse as the background noise became
larger. The uncorrected images showed two different
characteristics depending on the noise sizes.
For the noises with small size, diffraction fringes
were not correctable by the iteration procedure only.
However it was correctable in the case with contrast
enhancement prior to the iteration procedure.
For the noises with large size, whole or some
parts of the image were lost by the iteration
procedure. It was not correctable in the both cases
with or without the contrast enhancement prior to
the iteration procedure.
Upper limits of the background noises for the
images which were effectively corrected by the
iteration procedure were evaluated under the noise
influence. MSE was calculated as an indicator of the
noise level. The results are as follows.
For small size noise: MSE=4*10
5
(in the case of iteration procedure only)
For large size noise: MSE=10
6
10000
20000
30000
40000
150 200 250 300 350
Grayscale
Position
40000
50000
60000
70000
170 220 270 320
Grayscale
Position
40000
50000
60000
70000
150 200 250 300 350
Grayscale
Position
40000
50000
60000
70000
170 220 270 320
Grayscale
Position
1mm
1mm
Contrast
Enhancement
Iteration
Iteration
Iteration
(with or without
contrast enhancement)
Noise Influence on Low Contrast Image Correction for Soft X-Ray Projection Microscopy
177

(in both cases with or without contrast
enhancement prior to the iteration procedure)
Next, noise influences need to be checked for
various cases of the noise sizes and the image
contrasts. Development of noise sources and noise
removal methods of image processing is another
issue. An effective method to remove the
background noise and to improve the iteration
effectiveness is expected from these investigations.
ACKNOWLEDGEMENTS
The work was performed at the Photon Factory
under the application numbers 2010G065,
2012G120 and 2014G148. We would like to thank
the Photon Factory staff, Dr. Yoshinori Kitajima.
We also thank Dr. Kunio Shinohara and Dr. Toshio
Honda for their helpful discussion and advices.
REFERENCES
Jamsranjav, E., Shiina, T., Kuge, K., Kinjo, Y., Nakamura,
Y., Shinohara, K. and Ito, A. (2015) Effect of Contrast
Enhancement Prior to Iteration Procedure on Image
Correction for Soft X-ray Projection Microscopy,
Journal of Physics: Conference Series (AIP)
[submitted]
Legall, H., Stiel, H., Blobel, G., Seim, C., Baumann, J.,
Yulin, S., Esser, D., Hoefer, M., Wiesemann, U.,
Wirtz, M., Schneider, G., Rehbein, S. and Hertz, H.,
M. (2013) A compact laboratory transmission X-ray
microscope for the water window, Journal of Physics:
Conference Series (IOP), Vol.463, pp.12013-1 –
12013-4
Weigert, R., Prat-Shliom, N. and Amornphimoltham, P.
(2013) Imaging Cell Biology in Live Animals: Ready
for Prime time, J Cell Biol. 201(7): 969–979
Al-amri, S. S., Kalyankar, N. V., and Khamitkar, S. D.
(2010) Linear and Non-linear Contrast Enhancement
Image, IJCSNS International Journal of Computer
Science and Network Security, VOL.10 No.2, 139-143
Shiina, T., Suzuki, T., Honda, T., Ito, A., Kinjo, Y.,
Yoshimura, H., Yada, K. and Shinohara, K. (2009)
Fresnel Diffraction Correction by Phase-considered
Iteration Procedure in Soft X-ray Projection
Microscopy, Journal of Physics: Conference Series
(IOP), Vol.186, pp.12059-1 - 12059-3
Bertilson, M., Holfsten O., Vogt, U., Holmberg, A. and
Hertz, H. M. (2009) High-resolution computed
tomography with a compact soft x-ray microscope,
Optics Express, Vol.17, No.13, 11057-11065
David, S., Pierre, T., Tobias B., Veit, E., Malcolm, H.,
Chris, J., Janos, K., Enju, L., Huijie, M., Aaron, M. N.,
and David, S. (2005) Biological imaging by soft x-ray
diffraction microscopy, PNAS Proceedings of the
National Academy of Sciences of the United States of
America, Vol.102, No.43, 15343-45346
Schneider, G., Niemann, B., Gutmann, P., Weib, D.,
Scharf, J. G., Rudolph, D. and Schmahl, G. (2000)
Visualization of 30nm Structures in Frozen-hydrated
Biological Samples by Cryo Transmission X-ray
Microscopy, AIP Conference Proceeding 507, 3
Kirz, J., Jacobsen, C. and Howells, M. (1995) Soft X-ray
Microscopes and Their Biological Applications,
Quarterly Reviews of Biophysics 28, 33-130
PHOTOPTICS 2016 - 4th International Conference on Photonics, Optics and Laser Technology
178
