
Reducing Uncertainty in User-independent Activity Recognition
A Sensor Fusion-based Approach
Pekka Siirtola and Juha R¨oning
Biomimetics and Intelligent Systems Group, P.O. BOX 4500, FI-90014, University of Oulu, Oulu, Finland
Keywords:
Accelerometer, Sensor Fusion, Activity Recognition, Machine Learning, Mobile Phones.
Abstract:
In this study, a novel user-independent method to recognize activities accurately in situations where traditional
accelerometer based classification contains a lot of uncertainty is presented. The method uses two recognition
models: one using only accelerometer data and other based on sensor fusion. However, as a sensor fusion-
based method is known to consume more battery than an accelerometer-based, sensor fusion is only used
when the classification result obtained using acceleration contains uncertainty and, therefore, is unreliable.
This reliability is measured based on the posterior probabilities of the classification result and it is studied in
the article how high the probability needs to be to consider it reliable. The method is tested using two data
sets: daily activity data set collected using accelerometer and magnetometer, and tool recognition data set
consisting of data from accelerometer and gyroscope measurements. The results show that by applying the
presented method, the recognition rates can be improved compared to using only accelerometers. It was noted
that all the classification results should not be trusted as posterior probabilities under 95% cannot be considered
reliable, and by replacing these results with the results of sensor fusion -based model, the recognition accuracy
improves from three to six percentage units.
1 INTRODUCTION
Human activity recognition using inertial sensors is
a widely studied area of pattern recognition. One
reason for this is that it can be applied to many dif-
ferent types of application, including health monitor-
ing; targeted advertising; home automation that antic-
ipates the user’s needs; and self-managing system that
adapts to user’s activities (Lockhart et al., 2012).
For many applications, especially the ones made
for smartphones, human activity recognition should
be accurate but light as well to save the battery. For
this reason, in most of the studies activity recognition
is based on the measurement of one sensor only as
it is known that the more sensors are used the higher
the battery consumption is (Zappi et al., 2008). Typ-
ically, this sensor is an accelerometer as it is shown
that they do not only produce more accurate results
than other sensors but they are also more energy effi-
cient ((Shoaib et al., 2015), (Otebolaku and Andrade,
2013)), This is problematic, as it is also shown that
sensor fusion-based methods provide higher recogni-
tion accuracies than the methods based on only one
sensor (Shoaib et al., 2014), (Maurer et al., 2006),
(Ward et al., 2006). What is evenmore problematic, is
that sometimes accerometer-based user-independent
recognition models do not work as accurately as they
should and the classification results contain a lot of
uncertainty. The reason for this kind of behavior can
be that recognition conditionsare challenging in some
way and these conditions cause untypical measure-
ments. For example, sensor placement can differ from
the placements used in the training process (Roggen
et al., 2013), the person that uses the activity recog-
nition application moves differently than an average
person (Albert et al., 2012), or environmental condi-
tions are non-typical (Altini et al., 2014). In addi-
tion, it has been noted that recognition rates in real-
life conditions are often much lower than in labora-
tory conditions (Ermes et al., 2008).
Many of these problems can be solved if
user-dependent models are used instead of user-
independent as these are found to be more accurate
(Weiss and Lockhart, 2012). However, the problem
with user-dependent models is that they require per-
sonal training data from the user, and therefore, they
cannot be used out-of-the-box. This makes them un-
usable, or at least difficult to be used, in applications
which are aimed for masses. Therefore, the recogni-
tion of activities accurately and unobtrusive in chal-
lenging condition calls for novel approaches.
The increase in battery consumption means that
Siirtola, P. and Röning, J.
Reducing Uncertainty in User-independent Activity Recognition - A Sensor Fusion-based Approach.
DOI: 10.5220/0005743106110619
In Proceedings of the 5th International Conference on Pattern Recognition Applications and Methods (ICPRAM 2016), pages 611-619
ISBN: 978-989-758-173-1
Copyright
c
2016 by SCITEPRESS – Science and Technology Publications, Lda. All rights reserved
611

often it is not possible to classify instances 24/7 using
sensor fusion -based model. Luckily there are some
previous studies where sensor fusion is applied so that
all the sensors are not used constantly. For instance, in
(Zappi et al., 2008) sensors in multiple body positions
were used, however, in order to save energy the num-
ber of used sensors was decided dynamically. It was
noted that the number of sensors can be reduced with-
out significant effect to the recognition accuracy. In
our study, multiple types of sensors are used but only
in one body location. This was also the case in (Wang
et al., 2010), where a smart and energy-efficient way
to deploy the sensors of a mobile phone to recognize
activities was presented. The method presented in the
study uses minimum number of sensors needed to de-
tect user’s activity reliably and when activity changes,
more sensors are used to detect the new activity. By
using this smart sensor selection, the battery life was
improved by 75%. Altini et. al. (Altini et al., 2014)
present another method to use sensor fusion in a smart
way. The study presents a method to personalize user-
independent walking speed estimation model. In the
study, sensor fusion is used as it is noted that user-
independent walking speed estimation model based
on accelerometer data is not accurate when walking
in unconstrained conditions. In the study, sensor fu-
sion is used to automatically calibrate models by com-
bining accelerometer and GPS data to find a person-
specific offset to be used with a user-independent esti-
mation model. The offset is determined by comparing
walking speed estimation at a treadmill to speed mea-
sured by the GPS outdoors. By using this method,
it was possible to reduce the root mean square error
from 25% to 39% depending on walking speed.
In this study, a method to improve classification
accuracy in challenging conditions is presented. In
the study, conditions are considered challenging when
the classification results contain a lot of uncertainty
which means that posterior probability of the classifi-
cation result is not above some threshold. This study
is divided into two parts: firstly, it is studied when
classification results using accelerometer data cannot
be considered reliable. This is based on the poste-
rior probalities of the classification results. Although
there are some activity recognition studies using pos-
terior probabilities (for instance semi-supervised ap-
proach proposed in (Hachiya et al., 2012)) the way
they are applied in this article is new. In the second
part of the study, a novel sensor fusion-based user-
independent method to recognize activities accurately
in situations where classification results are unreliable
is presented. It is known that sensor fusion increases
the energy consumption, and therefore, reduces the
battery life. For this reason, the method presented in
this study uses several sensors in the activity recog-
nition process only when necessary. Experiments are
done using two data sets: daily activity data set col-
lected using the sensors of a mobile phone, and tool
recognition data set collected using a sensor box spe-
cially designed for research usage.
The paper is organized as follows: The used meth-
ods and data sets are explained in Section 2. The main
contributions of this study are presented in Section 3,
where it is studied when classification results are reli-
able, and in Section 4, where a method to reduce un-
certainty of the classification result is presented. Ex-
periments are in Section 5. Finally, the conclusions
are in Section 6.
2 DATA COLLECTIONS AND
METHODS
In this study, two data sets were used: daily activ-
ity data set and tool usage data set. With both data
sets sliding window technique was used to obtain
real-time results. This means that, the signals from
the sensors were divided into equal-sized smaller se-
quences, also called windows, and then classified
based on the features extracted from windows. More-
over, to reduce the number of misclassified windows,
the final classification was done based on the major-
ity voting of the classification results of three adjacent
windows. Therefore, when an activity changes, a new
activity can be detected when two adjacent windows
are classified as a new activity. While both data sets
used 3 second windows, the features extracted from
them were decided data set-wise.
2.1 Daily Activity Data
The data were collected using a Nokia N8 smartphone
running Symbianˆ3 operating system. N8 includes a
wide range of sensors: a tri-axis accelerometer and
magnetometer, two cameras, GPS, a proximity sen-
sor, microphones and an ambient light sensor. The
used sampling frequency was 40Hz, which is much
less than the maximum sampling frequency of most
phones. This enables the same sampling frequency
to be used with any smartphone, where the maximum
frequency of the accelerometer is at least 40Hz, mak-
ing recognition less phone model dependent (Siirtola
and R¨oning, 2012).
The classification models used in this study were
trained based on the activity data collected from seven
healthy subjects. The subjects were carrying five
phones at the same time. They were located at
trousers’ front pocket, jacket’s pocket, at backpack,
ICPRAM 2016 - International Conference on Pattern Recognition Applications and Methods
612

at brachium and one at the ear. The participants per-
formed five different activities: walking, running, cy-
cling, driving a car, and sitting/standing. The reason
for selecting these activities for the study is that nor-
mal everyday life consists mainly of these five activ-
ities. Moreover, data were collected when a phone
was laying on the table. Therefore, six activities were
recognized. What makes this data set challenging is
that it was collected outside laboratory, and therefore,
the conditions were not always optimal. For instance,
at places the used roads were bumpy making signals
difficult to analyze. The total amount of the data col-
lected was about fifteen hours. The data are intro-
duced in more detail in (Siirtola and R¨oning, 2013).
In this study, daily activities are recognized
body position -independently and orientation inde-
pendently as well. For this purpose, the effect of grav-
itation was eliminated in the pre-processing phase
by combining all three acceleration channels as one
using square summing. This way orientation inde-
pendent magnitude acceleration signal was obtained.
The same was done to magnetometer signals as well.
However, it was noted that the orientation of the
phone has some limitations. For example, the screen
or the back of the smartphone is always against the
user’s leg when the phone is in the trousers’ pocket.
Therefore, it was tested if features extracted from a
signal where two out of three acceleration and mag-
netometer channels were square summed, would im-
prove the classification accuracy. From these signals
calibration independent-features were extracted (Siir-
tola and R¨oning, 2013). Three types of features were
extracted from these signals: statistical, time domain
and frequency domain features, and these included
variance, minimum, maximum, different percentiles
and crossings, sums and square sums of values be-
low/above some percentile and sums of sequences of
the FFT signals. Altogether 120 features were ex-
tracted from acceleration signals, as well as, from
magnetometer signals and the used window size was
120 observations, which is 3 seconds as the sampling
rate was 40Hz.
2.2 Tool Usage Data
The tool recognition data set was collected using a
mobile SHAKE sensor, it is equipped with a 3D ac-
celerometer, a 3D gyroscope, a 3D magnetometer and
two proximity sensors. However, in this study only
accelerometer and gyroscope data were used. The
data were collected from five study subjects and the
task was to assemble a wooden drawer. The sen-
sor was attached to the both wrists of the subject
but in this study only the data from right wrist were
used. The data set contained seven activities: usage of
screwdriver, hammering, usage of spanner, attaching
small tips, tapping, adjusting drawer legs and using
power drill. The activities performed in this data set
were not common to all the persons from whom the
data were collected. Therefore, the data contains a lot
of variation between study subjects which increases
uncertainty in the classification process. The data are
introduced in more detail in (Huikari et al., 2010).
Unlike daily activity data set, data for tool usage
activities were collected from only one body position
as the location of the sensor was fixed as wrist. There-
fore, it the features extracted from the data do not
necessary need to be orientation independent. In this
case, features were extracted from each axis of 3D ac-
celerometer and 3D gyroscope signals. However, in
addition magnitude acceleration and gyroscope sig-
nals were also obtained using square summing and
features from these were extracted, as well. Three
types of features were extracted from these signals:
statistical, time domain and frequency domain fea-
tures, and these included variance, minimum, max-
imum, different percentiles and crossings, the sums
and square sums of values below/above some per-
centile, the sums of the sequences of FFT signals and
correlations between different channels. Altogether
99 features were extracted from acceleration signals,
as well as, from gyroscope signals, and the used win-
dow size was 300 observations which is 3 seconds as
the sampling rate was 100Hz.
2.3 Feature Selection and Classification
The feature selection method and classifiers applied
to both data sets were the same. In order to achieve
the highest possible recognition rates, the most de-
scriptive features for each model were selected using
a sequential forward selection (SFS) method (Devi-
jver and Kittler, 1982).
The main contribution of this study is to present a
method to recognize activities reliably when the an-
alyzed data can contain untypical measurements. As
this method is not dependent on the used classifier, in
this study only two classifiers were compared. Be-
cause of good experiences in our previous studies (Si-
irtola and R¨oning, 2012; ?), it was decided to use
QDA (quadratic discriminant analysis) and LDA (lin-
ear discriminant analysis) as a classifier. QDA is a
classification method that finds a quadratic surface,
that separates the classes best in the feature space
(Hand et al., 2001). LDA works differently as it uses
a linear decision surface to separate classes.
Reducing Uncertainty in User-independent Activity Recognition - A Sensor Fusion-based Approach
613
0 10 20 30 40 50 60 70 80 90 100
0
0.2
0.4
0.6
0.8
1
0 10 20 30 40 50 60 70 80 90 100
0
0.2
0.4
0.6
0.8
1
(a) QDA
0 10 20 30 40 50 60 70 80 90 100
0
0.2
0.4
0.6
0.8
1
0 10 20 30 40 50 60 70 80 90 100
0
0.2
0.4
0.6
0.8
1
(b) LDA
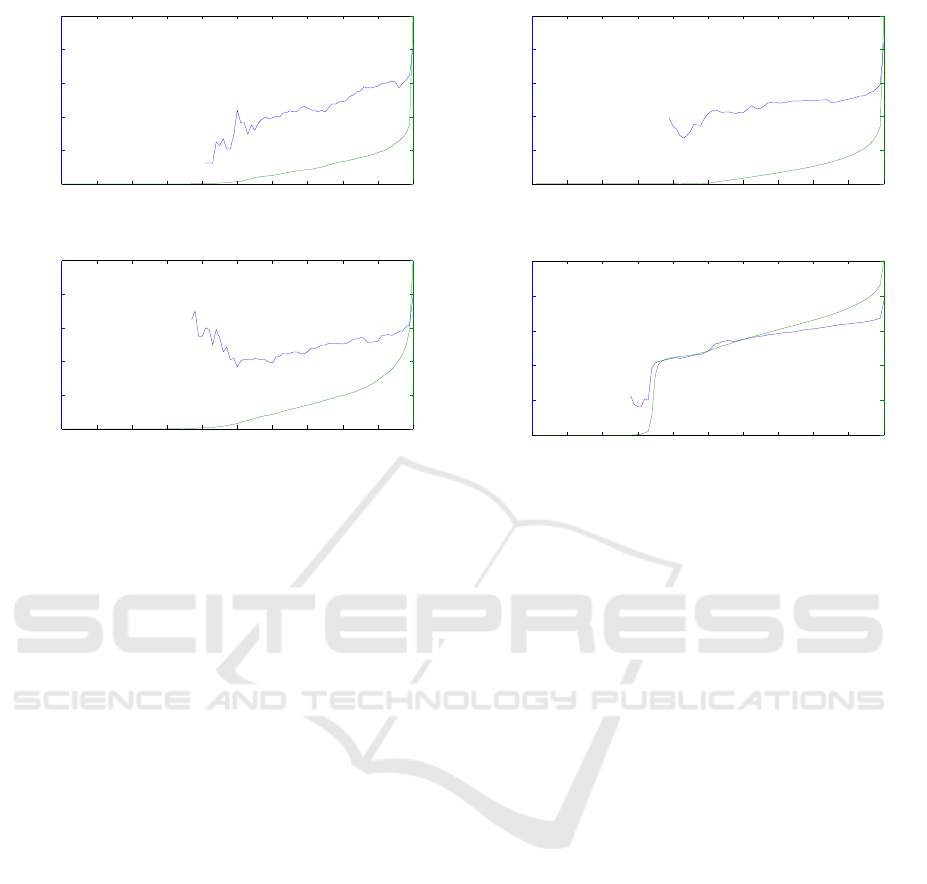
Figure 1: The effect of posterior probability on the recogni-
tion accuracy with tool usage data set. In the figure, x-axis
is the posterior probability in percentages, the blue curve
shows the recognition accuracy of such classification results
where posterior probability is below the value defined by
x-axis. In addition, the green curve shows how many per-
centages of the data set have posterior probability below the
value defined by x-axis. In the upper figure classification is
obtained using QDA, and in the lower using LDA.
3 ACTIVITY RECOGNITION IN
CHALLENGING CONDITIONS -
IS THE CLASSIFICATION
RESULT RELIABLE?
In this study, it is presented a method to improve clas-
sification in situations where the classification result
cannot be considered reliable. Therefore, at first it
need to be studied when models are not reliable. Here
result is not considered reliable when it contains a lot
of uncertainty which means that posterior probability
of the classification results is not above some thresh-
old. As mentioned in the previous section, this can
be for example a consequence of a misplaced sensor,
non-typical environmental condition, or a movement
style different to an average person. This threshold
is for instance dependent on the used classifier, the
number of classes, and types of activities.
In Figures 1 and 2 it is shown how posterior prob-
ability is related to classification accuracy when clas-
sification is performed using statistical and time do-
main features extracted from acceleration data and
0 10 20 30 40 50 60 70 80 90 100
0
0.2
0.4
0.6
0.8
1
0 10 20 30 40 50 60 70 80 90 100
0
0.2
0.4
0.6
0.8
1
(a) QDA
0 10 20 30 40 50 60 70 80 90 100
0
0.2
0.4
0.6
0.8
1
0 10 20 30 40 50 60 70 80 90 100
0
0.2
0.4
0.6
0.8
1
(b) LDA
Figure 2: The effect of posterior probability n the recog-
nition accuracy with daily activity data set. In the figure,
x-axis is the posterior probability in percentages, the blue
curve shows the recognition accuracy of such classification
results where posterior probability is below the value de-
fined by x-axis. In addition, the green curve shows how
many percentages of the data set have posterior probability
below the value defined by x-axis. In the upper figure clas-
sification is obtained using QDA, and in the lower using
LDA.
classification is done using QDA and LDA. In the fig-
ure, x-axis is the posterior probability in percentages,
the blue curve shows the recognition accuracy of such
classification results where posterior probability is be-
low the value defined by x-axis. In addition, the green
curve shows how many percentages of the data set
have posterior probability below the value defined by
x-axis. Based on these figures it can be concluded that
higher the posterior probabilities are more likely to
produce higher recognition accuracy. While this find-
ing is quite obvious, it is more interesting to see how
already a small change in posterior probability can
have a massive impact to recognition accuracy. For
instance, with tool usage data one percentage drop in
posterior probabilities, from 100% to 99%, with LDA
causes recognition accuracy to drop from 78.7% to
61.9% and with QDA from 81.3% to 64.8%. This
means that the posterior propability of the classifica-
tion result need to be really high to be reliable. On the
other hand, as shown in the figure by the green curve,
there are not many classification results with posterior
propability under 95%. The only exception is daily
activity recognition using LDA. In that case, there is
ICPRAM 2016 - International Conference on Pattern Recognition Applications and Methods
614
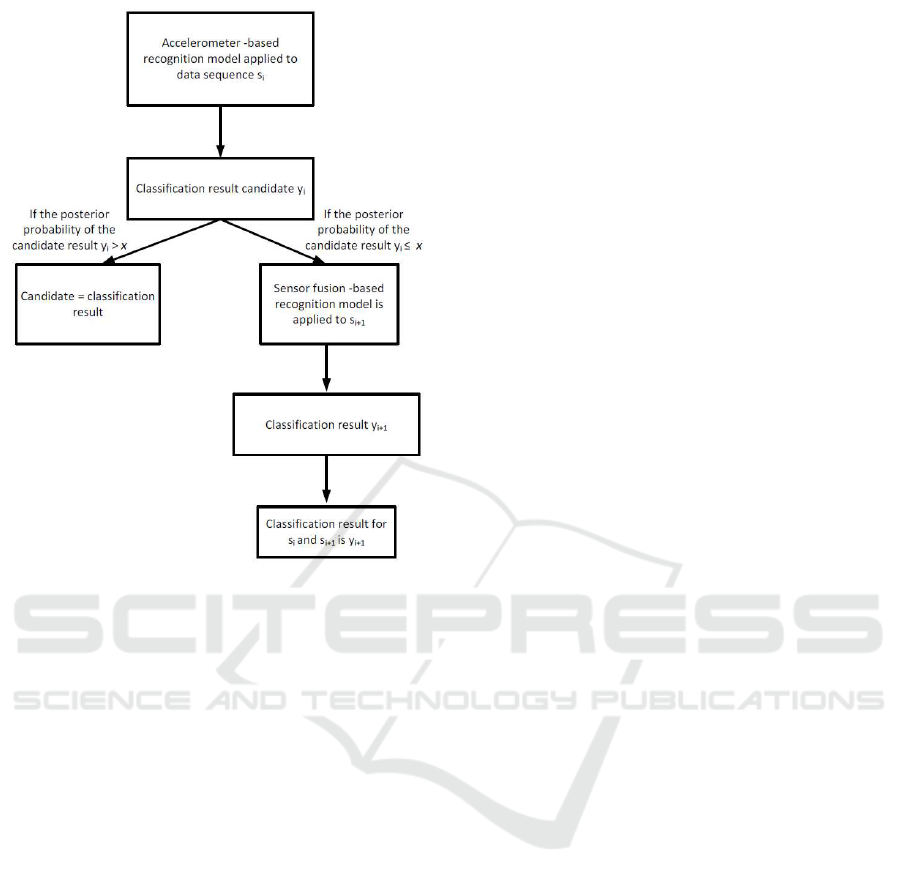
Figure 3: The presented method consists of two recogni-
tion models: one using only accelerometer data and other
based on sensor fusion. The sensor fusion-based model is
only used when the classification result obtained using an
accelerometer-based model is known to be unreliable.
a lot of results with posterior propabilities under 40%.
However, also in this case there is a huge difference
in recognition accuracies (10 percentage units) when
the posterior propability drops from 100% to 99%. In
addition, according to the figures, the recognition ac-
curacy for observations with the posterior propability
95% is around 50%. It is decided in this study, that
observations under this threshold cannot be consid-
ered reliable. Therefore, 95% posterior is in this study
considered as the threshold for reliable classification.
4 BUILDING MORE RELIABLE
RECOGNITION MODELS - A
SENSOR FUSION-BASED
APPROACH
The idea of the study is to improve user-independent
activity recognition in challenging condition using
sensor fusion. The basic idea of the proposed method
is presented in Figure 3. The method consists of two
models: one accelerometer-based that is used in nor-
mal conditions, and another model to recognize ac-
tivities when the candidate results provided using an
accelerometer-based model are unreliable. The pur-
pose is that most of the time the recognition is based
on this model as it is low power consuming. The
method also contains another model that uses data
from several sensors and a lot more features than the
first one. This model is only used when the candidate
recognition result obtained using the first model is not
reliable, meaning that the posterior probability of the
results is not high enough.
Let us assume that the purpose is to classify
a sequence of windows {s
1
, . . . , s
i
, . . . s
k
} using the
method presented in this paper. When window s
i
is studied, in the first place it is classified using the
accelerometer -based user-independent classification
model and candidate y
i
as a class label of this window
is obtained. If the posterior probability of this classi-
fication is above some predefined threshold, the clas-
sification can be considered reliable. However, if the
posterior probability is not above this threshold, the
classification cannot be considered reliable. In this
case, the sensors used by the sensor fusion model are
switched on and the next window y
i+1
is classified
using the more complex sensor fusion -based model,
and the class label y
i+1
obtained using it is consid-
ered as a class label to windows s
i
and s
i+1
.To keep
the battery consumption low, after classifying s
i+1
all the sensors expect accelerometer are switched off
and s
i+2
is again classified using accelerometer -based
model.
As it can be seen from Figure 3, one classification
using a sensor fusion model effects to the labels of
two windows. Therefore, in this study the number of
classifications using the sensor fusion-based model is
not equal to the number of results obtained using the
fusion model.
In the experiment section it is studied how much
the proposed method improves the recognition accu-
racy using the threshold defined in Section 3.
5 EXPERIMENTS
The presented human activity recognition for chal-
lenging conditions is tested with two data sets, and
therefore, this experiments section comprises two
parts: daily activity recognition and tool usage recog-
nition. In both cases, the recognition is done using
QDA and LDA as a classifier and features are se-
lected using SFS. Moreover, to obtain reliable user-
independent results, the training was performed using
the leave-one-out method, so that each person’s data
in turn was used for testing and the rest of the data
were employed for model training.
Reducing Uncertainty in User-independent Activity Recognition - A Sensor Fusion-based Approach
615
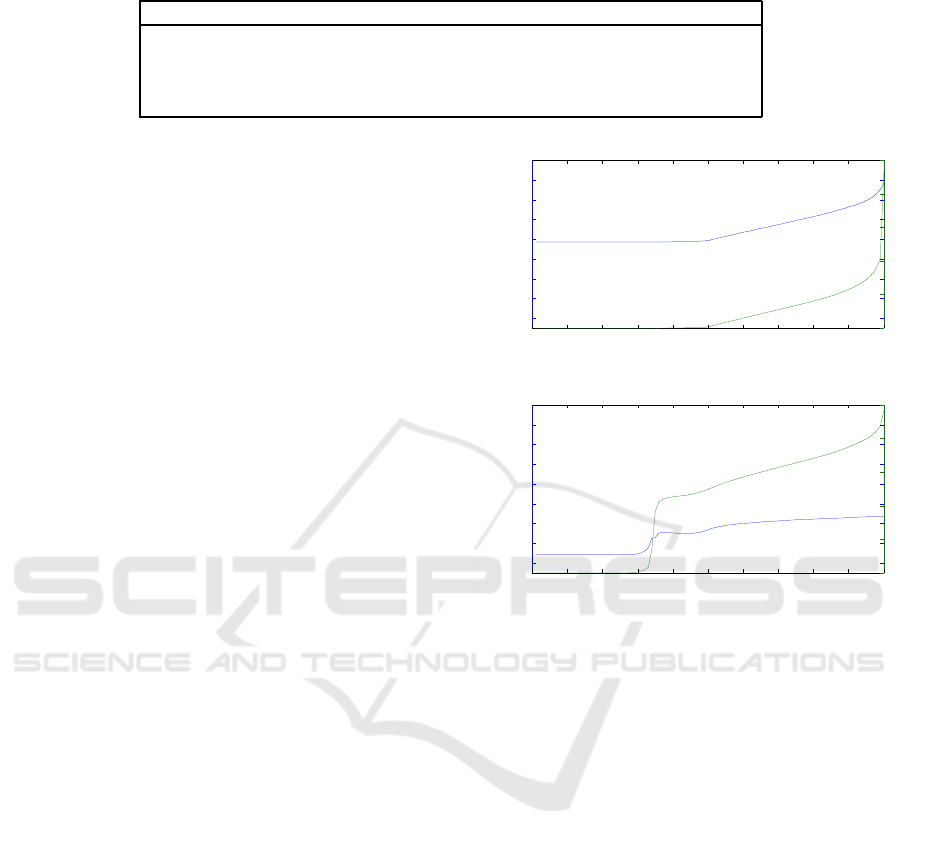
Table 1: The recognition rates for daily activity data sets using models based on acceleration and sensor fusion.
Data set / Model Accelerometer Sensor fusion
Daily activity / QDA
Accuracy 83.7% 89.7%
Daily activity / LDA
Accuracy 76.9% 80.7%
5.1 Daily Activity Recognition
Daily human activities were recognized using follow-
ing features: an acceleration-based model used only
statistical and time domain features while the sensor
fusion based method used statistical, time domain and
frequency domain features extracted from accelera-
tion and magnetometer signals.
5.1.1 Results
The classification results are shown in Table 1. How-
ever, the purpose of this study is to show how sensor
fusion can be used to improve the classification rates
in challenging conditions. In this study, conditions are
considered challenging if the posterior probability of
the recognition result provided by the accelerometer-
based model are not high enough. In Figure 4 it is
shown how differently chosen posterior thresholds af-
fect the recognition rates.
5.1.2 Discussion
The results in Table 1 show that sensor fusion, accel-
eration and magnetometer in this case, improves the
recognition rates of daily human activity data set sig-
nificantly, six percentage units using QDA and four
using LDA. This came as no surprise, as more sen-
sors mean more data and features, which of course
makes classification easier.
The results shown in Figure 4 are more interest-
ing. It is shown in this figure, that in order to obtain
recognition rates that are almost as high as the ones
obtained using only a sensor fusion-based model, it is
not necessary to classify each window using a sensor
fusion-based model. In fact, with QDA already by
replacing a fifth of the accelerometer-based classifi-
cation results with sensor fusion-based classification
improves the recognition rate by over three percent-
age units (83.7 % vs. 86.8%). Note that, for example,
if the posteriors of a tenth of classifications are below
the threshold it means that actually a fifth of the re-
sults are replaced by the sensor fusion -model as the
class label given to windows s
i
and s
i+1
is the same.
Moreover, if candidate recognition results with pos-
terior propabilities under 95%, as suggested in Sec-
tion 3, are replaced with sensor fusion -based results
0 10 20 30 40 50 60 70 80 90 100
0.76
0.78
0.8
0.82
0.84
0.86
0.88
0.9
0.92
0 10 20 30 40 50 60 70 80 90 100
0
0.2
0.4
0.6
0.8
1
(a) QDA
0 10 20 30 40 50 60 70 80 90 100
0.76
0.78
0.8
0.82
0.84
0.86
0.88
0.9
0.92
0 10 20 30 40 50 60 70 80 90 100
0
0.2
0.4
0.6
0.8
1
(b) LDA
Figure 4: Results using daily activity data set. The
blue curve shows the total recognition accuracy where
accelerometer-based classification results are replaced by
the results of the sensor fusion model when the posterior
probability of accelerometer model is below the value de-
fined by x-axis, the green curve shows how often classifi-
cations were obtained using sensor fusion-based model. In
the upper figure classification is obtained using QDA, and
in the lower using LDA.
as suggested in Section 3, it means that around 29%
of the classifications are based on this models results
when using QDA. In this case, the improvement in
detection accuracy is over four percentage units (83.7
% vs. 87.9%).
LDA seems to behave differently as there are a
lot of classifications with low posterior probabilities.
This means that sensor fusion model needs to apply
in his case more often. In this case, when results
with posterior probabilities under 95% are replaced
with sensor fusion -based results, the detection ac-
curacy improves almost four percentage units (76.9%
vs. 80.7%). However, this would mean that 80 per-
centage of the classification should be obtained with
sensor fusion -based model making the suggested ap-
proach less energy efficient.
ICPRAM 2016 - International Conference on Pattern Recognition Applications and Methods
616
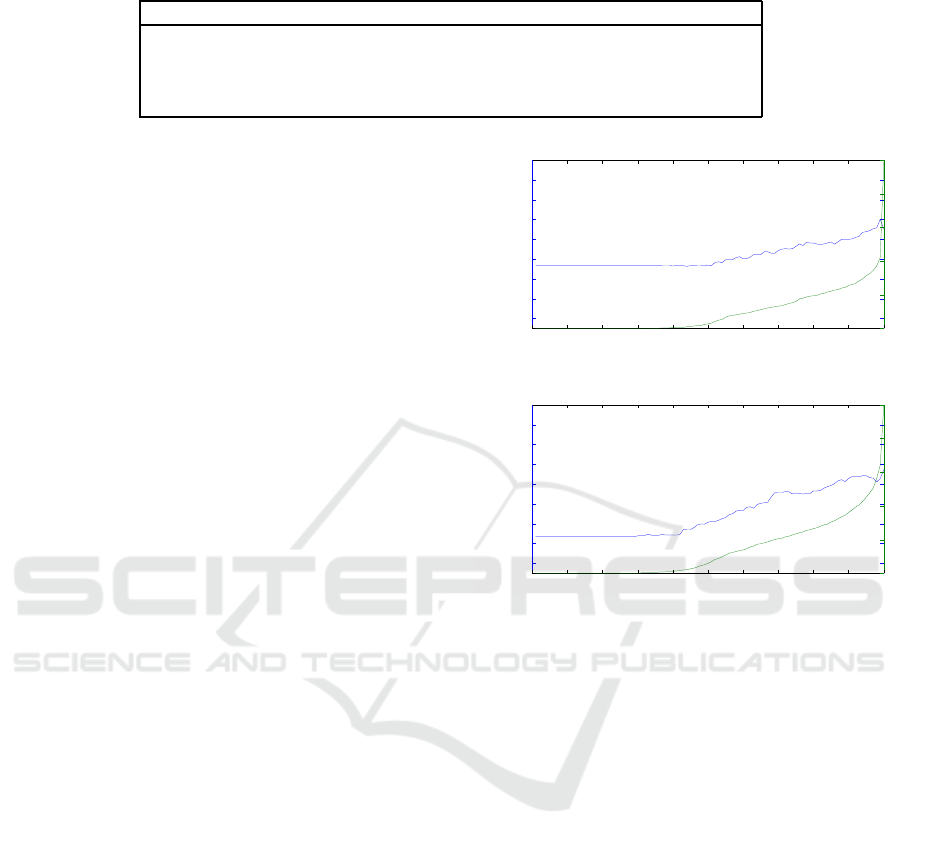
Table 2: The recognition rates for tool usage data sets using models based on acceleration and sensor fusion.
Data set / Model Accelerometer Sensor fusion
Tool usage / QDA
Accuracy 81.3% 85.0%
Tool usage / LDA
Accuracy 78.7% 85.6%
5.2 Tool Usage Recognition
Tool usage activities were recognized using follow-
ing features: an acceleration-based model used statis-
tical and time domain features, and a sensor fusion
method used statistical, time domain and frequency
domain features extracted from acceleration and gy-
roscope signals.
5.2.1 Results
The classification results are shown in Table 2. In the
case of the proposed method, a sensor fusion-based
method is used when the posterior probability of the
class label obtained using accelerometer-based is be-
low some threshold. In Figure 5 it is shown how dif-
ferently chosen posterior thresholds affect the recog-
nition rates.
5.2.2 Discussion
The results shown in Table 2 show that sensor fusion
consisting of accelerometer and gyroscope data im-
proves the detection rates of tool usage recognition.
This improvement seems to be approximately as big
as the one obtained with daily activity data set. How-
ever, it was expected that this improvement is bigger
in the case of tool usage data as it is claimed in the
previous studies, such as (Shoaib et al., 2014), that
gyroscope is a more accurate sensor to be used in ac-
tivity recognition than magnetometer that was used
with daily activity data. However, it is possible that in
this case there was no much room for improvement,
and therefore, the improvement gained by combin-
ing accelerometer and gyroscope is not as high as the
improvement achieved combining accelerometer and
magnetometer with daily activity data set. Moreover,
in this study the same features were extracted from
each sensor. These features are the ones commonly
used with accelerometer data. Therefore, it should be
studied in more detail what kind of features should be
extracted from gyroscope and magnetometer data to
achieve the highest possible recognition rates.
In Figure 5 it is shown how the combination of
accelerometer and sensor fusion-based models im-
proves the recognition accuracy compared to using
only a accelerometer model. Also in this case, the
0 10 20 30 40 50 60 70 80 90 100
0.76
0.78
0.8
0.82
0.84
0.86
0.88
0.9
0.92
0 10 20 30 40 50 60 70 80 90 100
0
0.2
0.4
0.6
0.8
1
(a) QDA
0 10 20 30 40 50 60 70 80 90 100
0.76
0.78
0.8
0.82
0.84
0.86
0.88
0.9
0.92
0 10 20 30 40 50 60 70 80 90 100
0
0.2
0.4
0.6
0.8
1
(b) LDA
Figure 5: Results using tool usage data set. The blue curve
shows the total recognition accuracy where accelerometer-
based classification results are replaced by the results of the
sensor fusion model when the posterior probability of the
accelerometer model is below the value defined by x-axis,
the green curve shows how often classifications were ob-
tained using sensor fusion-based model. In the upper figure
classification is obtained using QDA, and in the lower using
LDA.
proposed method improves the detection accuracy.
With QDA, improvement is well over three percent-
age unit when 31% of the candidate recognition re-
sults, the ones with posterior propabilities under 95%,
are done using the sensor fusion -base method (81.3%
vs. 84.8%). Similarly with LDA this improvement
is over six persentage units (78.7% vs. 84.9%), and
means that 45% percentage of results are obtained us-
ing the sensor fusion-based model.
6 CONCLUSIONS
In this study, a novel sensor fusion-based method to
recognize activities accurately when the results pro-
vided by the traditional accelerometer-based model
Reducing Uncertainty in User-independent Activity Recognition - A Sensor Fusion-based Approach
617

contain a lot of uncertainty was presented. The
method uses two recognition models: one using only
accelerometer data and other based on sensor fusion.
However,as the sensor fusion-based method is known
to consume more battery than an accelerometer-
based, sensor fusion is only used when the candi-
date recognition result obtained using accelerometer-
based model is known to contain too much uncer-
tainty and can be considered as unreliable. This relia-
bility is measured based on the posterior probabilities
of the classification results. The method is tested us-
ing two data sets: daily activity data sets collected us-
ing accelerometer and magnetometer, and tool recog-
nition data set consisting of data from accelerometer
and gyroscope measurements.
In the first part of the article it is studied when
results can be considered reliable. This is different
to the most activity recognition studies where relia-
bility of the results is not questioned. Reliability is
studied using two classifiers: QDA and LDA. It was
noted that the recognition accuracy for observations
with posterior probability 95% is around 50%. There-
fore, it can be concluded that when posterior proba-
bility is below 95%, the model is not reliable, and the
threshold for reliable classification was set to 95%.
However, it should be further studied with multiple
classifiers and data sets how this threshold could be
decided using some metrics.
In the experiment section, the proposed method is
applied to two data sets. It is shown that when 95%
threshold is used, the results improve significantly.
For instance, using QDA improvement is over four
percentage units with daily activity data set and over
three percentage units with tool usage data set. In ad-
dition, in most cases 95% threshold means that well
under half of the results are replaced with the results
of the sensor fusion based model. Which again means
that less than 25% of the instances are classified us-
ing the sensor fusion model. However, improvements
can be achieved already using the sensor fusion-based
model less frequently. For instance, in the case of
daily activity recognition, setting the threshold for
posterior probability so that a fifth of accelerometer-
based classification results are replaced with sensor
fusion-based classification, improves the recognition
rate by overthree percentage units (83.7 % vs. 86.8%)
when QDA is used. In addition, it is likely that the
recognition rates of sensor fusion-based models can
be further improved as in this study the same features
were extracted from each sensor. However, in order
to obtain the highest possible benefit from sensor fu-
sion, the special characteristics of each sensor should
be studied, and extract different types of features from
different sensors based on these.
Future work includes experiments with multiple
data sets in order to test the method with different kind
of activities. In addition, the presented method should
be tested in real-time. For instance, it could be im-
plemented into a smartphone to be tested in real-life
conditions. Moreover, at this point, the method uses
two user-independent models, however, more models
based on different sensors could be trained, and create
a model that uses more than two models and selects
the model to be used using some metrics.
REFERENCES
Albert, M. V., Toledo, S., Shapiro, M., and Kording, K.
(2012). Using mobile phones for activity recognition
in parkinsons patients. Frontiers in neurology, 3.
Altini, M., Vullers, R., Van Hoof, C., van Dort, M., and
Amft, O. (2014). Self-calibration of walking speed
estimations using smartphone sensors. In Pervasive
Computing and Communications Workshops (PER-
COM Workshops), 2014 IEEE International Confer-
ence on, pages 10–18.
Devijver, P. A. and Kittler, J. (1982). Pattern recognition:
A statistical approach. Prentice Hall.
Ermes, M., P¨arkk¨a, J., M¨antyj¨arvi, J., and Korhonen, I.
(2008). Detection of daily activities and sports with
wearable sensors in controlled and uncontrolled con-
ditions. Information Technology inBiomedicine, IEEE
Transactions on, 12(1):20–26.
Hachiya, H., Sugiyama, M., and Ueda, N. (2012).
Importance-weighted least-squares probabilistic clas-
sifier for covariate shift adaptation with application to
human activity recognition. Neurocomputing, 80:93
– 101. Special Issue on Machine Learning for Signal
Processing 2010.
Hand, D. J., Mannila, H., and Smyth, P. (2001). Principles
of data mining. MIT Press, Cambridge, MA, USA.
Huikari, V., Koskim¨aki, H., Siirtola, P., and R¨oning, J.
(2010). User-independent activity recognition for in-
dustrial assembly lines-feature vs. instance selection.
In Pervasive Computing and Applications (ICPCA),
2010 5th International Conference on, pages 307–
312.
Lockhart, J. W., Pulickal, T., and Weiss, G. M. (2012).
Applications of mobile activity recognition. In 2012
ACM Conference on Ubiquitous Computing, Ubi-
Comp ’12, pages 1054–1058, New York, NY, USA.
ACM.
Maurer, U., Smailagic, A., Siewiorek, D., and Deisher, M.
(2006). Activity recognition and monitoring using
multiple sensors on different body positions. In Wear-
able and Implantable Body Sensor Networks, 2006.
BSN 2006. International Workshop on, pages 4 pp.–
116.
Otebolaku, A. M. and Andrade, M. T. (2013). Recognizing
high-level contexts from smartphone built-in sensors
for mobile media content recommendation. In Mo-
ICPRAM 2016 - International Conference on Pattern Recognition Applications and Methods
618

bile Data Management (MDM), 2013 IEEE 14th In-
ternational Conference on, volume 2, pages 142–147.
IEEE.
Roggen, D., F¨orster, K., Calatroni, A., and Tr¨oster, G.
(2013). The adarc pattern analysis architecture for
adaptive human activity recognition systems. Journal
of Ambient Intelligence and Humanized Computing,
4(2):169–186.
Shoaib, M., Bosch, S., Incel, O. D., Scholten, H., and
Havinga, P. J. (2015). A survey of online ac-
tivity recognition using mobile phones. Sensors,
15(1):2059–2085.
Shoaib, M., Bosch, S., Incel, O. D., Scholten, H., and
Havinga, P. J. M. (2014). Fusion of smartphone mo-
tion sensors for physical activity recognition. Sensors,
14(6):10146–10176.
Siirtola, P., Koskim¨aki, H., Huikari, V., Laurinen, P., and
R¨oning, J. (2011). Improving the classification accu-
racy of streaming data using sax similarity features.
Pattern Recognition Letters, 32(13):1659–1668.
Siirtola, P. and R¨oning, J. (2012). Recognizing human activ-
ities user-independently on smartphones based on ac-
celerometer data. International Journal of Interactive
Multimedia and Artificial Intelligence, 1(5):38–45.
Siirtola, P. and R¨oning, J. (2013). Ready-to-use activity
recognition for smartphones. In IEEE Symposium on
Computational Intelligence and Data Mining (CIDM
2013).
Wang, S., Chen, C., and Ma, J. (2010). Accelerometer based
transportation mode recognition on mobile phones. In
Wearable Computing Systems (APWCS), 2010 Asia-
Pacific Conference on, pages 44 –46.
Ward, J., Lukowicz, P., Troster, G., and Starner, T. (2006).
Activity recognition of assembly tasks using body-
worn microphones and accelerometers. Pattern Anal-
ysis and Machine Intelligence, IEEE Transactions on,
28(10):1553–1567.
Weiss, G. M. and Lockhart, J. W. (2012). The impact of
personalization on smartphone-based activity recog-
nition. In AAAI Workshop on Activity Context Repre-
sentation: Techniques and Languages.
Zappi, P., Lombriser, C., Stiefmeier, T., Farella, E., Roggen,
D., Benini, L., and Trster, G. (2008). Activity recogni-
tion from on-body sensors: Accuracy-power trade-off
by dynamic sensor selection. In Verdone, R., editor,
Wireless Sensor Networks, volume 4913 of Lecture
Notes in Computer Science, pages 17–33. Springer
Berlin Heidelberg.
Reducing Uncertainty in User-independent Activity Recognition - A Sensor Fusion-based Approach
619
