
An Expert System for Facilitating an Institutional Risk Profile Definition
for Cyber Situational Awareness
Roman Graf
1
, Sergiu Gordea
1
, Heather M. Ryan
2
and Tibaut Houzanme
3
1
AIT Austrian Institute of Technology, Vienna, Austria
2
University of Denver, Library and Information Science Program, Denver, CO, U.S.A.
3
Electronic Records Archivist, Indiana Archives and Records Administration, Indianapolis, IN, U.S.A.
Keywords:
Situational Awareness, Data Mining.
Abstract:
Advances in cyber situational awareness technology lead to the creation of increasingly complex tools. Hu-
man analysts face challenges finding relevant information in large, complex data sets, when exploring data to
discover patterns and insights. To be effective in identifying and defeating future cyber-attacks, cyber analysts
require novel tools and models that can fill the gap between cyber data and situation comprehension. The
research presented here is designed to develop a system that will warn a cyber analyst of file format endanger-
ment that could impact cyber situational awareness. The expert system statistically determines an institutional
risk profile based on collected expert knowledge in the form of risk profiles calculated by means of risk fac-
tors. The institutional risk profile indicates risks that could endanger digital content employed in analysis of
cyber situational awareness. Based on the institutional risk profile, a cyber analyst can implement measures
for stabilising and securing situational awareness. Each institution may have multiple risk profile definitions
dependent on network, critical infrastructure, and the role of the cyber analyst. Another contribution relates
to the provided support for visualisation and analysis of risk factors for individual dimensions. To facilitate
decision-making, the aggregated information about the risk factors is presented as a multidimensional vector.
1 INTRODUCTION
The cyber Situational Awareness (SA) (Barford et al.,
2010) is a perception of security and threat situation
with current and future impact assessment. In re-
cent years, researchers in SA field have created in-
creasingly complex tools across many application do-
mains. Often, tool outputs are of a complex na-
ture, involving non-textual, high-dimensional, and
various multimedia data. Designers of automated
tools are aiming to address situational awareness
challenges like complex and fluid system topology,
rapidly changing technologies, high noise to signal ra-
tio, rapidly evolving and multi-faceted threats, speed
of events, data overload, and meaning underload (Kott
and Wang, 2014). These factors make real-time sit-
uational awareness of cyber operations very difficult
to evaluate. Contrary to the human brain - which is
well designed to derive situational awareness from the
world based on a complex set of cognitive processes
and schema learned through experience - the artifi-
cial world of cyber operations seriously stresses that
process. Addressing the lack of good, integrated tools
that help bridge this gap by assisting the operator with
a comprehensive set of needed information is critical
for developing the necessary cyber security awareness
required to secure operations.
In security planning, it is necessary to analyse data
that are often vague and imprecise. In cyber situa-
tional awareness, we have to rely on such imperfect
information to detect real attacks and to prevent an
attack from happening through appropriate risk man-
agement. Cyber SA aggregates raw data at the lower
level (Barford et al., 2010). Missing data or rendering
errors can cause serious SA failure in achieving the
overall goal of cyber defense.
While making a decision, a human cyber analyst
faces challenges like finding relevant information in
large, complex data sets and in searching data to dis-
cover patterns and insights. For humans to be effec-
tive in identifying and defeating future cyber-attacks,
novel tools and models that can fill the gap between
cyber data and situation comprehension are highly de-
sired.
One of the core risk factors for situational aware-
ness is an ability to render stored data such as log
Graf, R., Gordea, S., Ryan, H. and Houzanme, T.
An Expert System for Facilitating an Institutional Risk Profile Definition for Cyber Situational Awareness.
DOI: 10.5220/0005738303470354
In Proceedings of the 2nd International Conference on Information Systems Security and Privacy (ICISSP 2016), pages 347-354
ISBN: 978-989-758-167-0
Copyright
c
2016 by SCITEPRESS – Science and Technology Publications, Lda. All rights reserved
347

files, emails and documentation. Emails may com-
prise improper mime types and additional informa-
tion in attachments, such as PDF and Word. Sys-
tem logs mostly are expected in a text form, but they
can also make use of any proprietary formats. And
system documentation mostly employs either pdf or
web formats. Web formats can be composite docu-
ments that may contain a wide variety of other for-
mats. This risk factor deals with the evaluation of ap-
propriate formats used for encoding digital content.
The preservation risks for a particular file format are
difficult to estimate as described in (Graf and Gordea,
2013). Since each institution has its specific Situa-
tional Awareness, the proposed system can only sup-
port decision making with its risk profiles. However,
the automatically computed institutional risk profiles
have to be adjusted and validated by institutional ex-
pert. The definition of risk factors and associated met-
rics is still an open research topic in the archiving
community. Involvement of digital preservation ex-
perts is required for collecting complete information
and evaluating risks as shown in (Ayris et al., 2008).
The SA expert is dependent on rendering soft-
ware and archived data that describe previous inci-
dents, vulnerabilities and attacks. The digital preser-
vation domain addresses the problem of long-term
data archiving and can be employed in SA field to
ensure data rendering. For example facing render-
ing problems and employing File Format Metadata
Aggregator (FFMA) (Ryan et al., 2015) analyst can
quickly find an alternative rendering solution, though
FFMA can not prevent rendering problems.
Currently, each institution selects its own file for-
mats for preservation depending on particular task
and critical infrastructure. Due to the scale of dig-
ital information that has to be managed, institutions
are facing challenges regarding preservation, mainte-
nance, and quality assurance of stored data. For that
reason, automated solutions for data management and
digital preservation are absolutely necessary. Trust-
worthy and continued access to data encoded in all
presented formats is important for further analysis and
building knowledge base to support decision making
in a fast-changing environment, possibly under attack.
Ensuring the continued accessibility of content en-
coded in various file formats before an attack arises
can ensure that a cyber situational operator has access
to the necessary data when crisis occurs.
Many file formats are properly documented, are
open-source and well supported by software vendors.
Other formats may be outdated or no longer func-
tional with modern software or hardware. There are
also custom/proprietary formats - which may be ob-
solete and not renderable with commodity hardware.
The novelty of this technical solution is the em-
ployment of data mining methods to facilitate com-
plex risk factor settings for cyber analysts. Our goal is
to make use of a domain expert knowledge base to de-
tect situational awareness risks for a particular insti-
tution. An automated file format endangerment warn-
ing can assist the cyber analyst to secure robust sit-
uational awareness. The research data for the expert
knowledge base and factors for the risk metrics cal-
culation were provided through two studies organised
by Heather Ryan (Ryan, 2014), (Ryan et al., 2015).
The data from the first study (Ryan, 2014) refined the
factors that are employed to create the risk profiles.
The (Ryan et al., 2015) short paper outlined the re-
search methods and goals of the study that produced
the data used in the test scenarios demonstrated here.
This paper is structured as follows: Section 2 gives
an overview of related work and concepts. Section
3 explains the risk factor visualisation workflow and
also covers data mining issues. Section 4 presents the
experimental setup, applied methods and results. Sec-
tion 5 concludes the paper and provides an outlook on
planned future work.
2 RELATED WORK
The research on risk management in SA increasingly
gains in importance. The SA framework (Morita
et al., 2011) describes how a person perceives ele-
ments of the environment, comprehends and projects
its actions into the future. This framework employs
the situation awareness model that can be used in the
assessment of risk awareness focusing on the adverse
event notification system. Our expert system takes a
similar approach, but focuses on renderability of es-
sential information, rather than events. The review of
existing situation awareness measurement techniques
for their suitability for use in the assessment of SA in
different environments (Salmon et al., 2006) demon-
strates that current SA measurement techniques are
inadequate by themselves for use in the assessment
of SA, and a multiple-measure approach utilising dif-
ferent approaches is recommended. To address this
gap, we employ specific risk factors obtained from
the archiving community for the digital content fo-
cus of SA. In security planning, it is necessary to
analyse data that are often vague and imprecise. In
(Barford et al., 2010) authors survey existing tech-
nologies in handling uncertainty and risk manage-
ment in cyber situational awareness, but the focus is
on looking for vulnerabilities in a system, whereby
our approach is focused on secure rendering of the
raw data at a lower level that creates a basis for fur-
ICISSP 2016 - 2nd International Conference on Information Systems Security and Privacy
348
ther SA aspects, such as situation recognition, situa-
tion comprehension and situation projection (Barford
et al., 2010). It is difficult to guarantee the longivity
of digital information. The investigation (Lawrence
et al., 2000) examines risk assessment of migrating
file formats. Accurate format identification and ren-
dering is a challenging task due to malformed MIME
types, rendering expenses, dependence on content not
embedded in the file, changed fonts, etc. In (Jack-
son, 2012), the author examines how network effects
can stabilise formats against obsolescence. Jackson’s
evaluation demonstrates that most formats last much
longer than five years, that network effects stabilize
formats, and that new formats appear at a modest,
manageable rate. However, a number of formats are
fading from use and every corpus contains its own bi-
ases. Digital preservation tools like PANIC (Hunter
and Choudhury, 2006), AONS II (Pearson and Webb,
2008), SPOT (Vermaaten et al., 2012), P2 registry
(David Tarrant, 2011), were designed to notify repos-
itory managers of file format-related events that might
impact access to stored content. They also define
alerting mechanisms when file formats become obso-
lete. As distinct from our approach, they do not apply
expert knowledge and do not specify risk factors that
may influence file format endangerment. In the pro-
posed approach we intend to apply standard statistics
and data mining methods. The proposed system is
unique for the given domain.
3 VISUALISATION METHOD
Visualisation of risk profiles facilitates risk profile
selection, assessment and replacement, if required.
Each risk profile is represented by a multidimensional
vector. In the presented approach 31 dimensions were
evaluated and rated by the domain experts. The risk
profile visualisation is conducted according the work-
flow shown in Fig. 1.
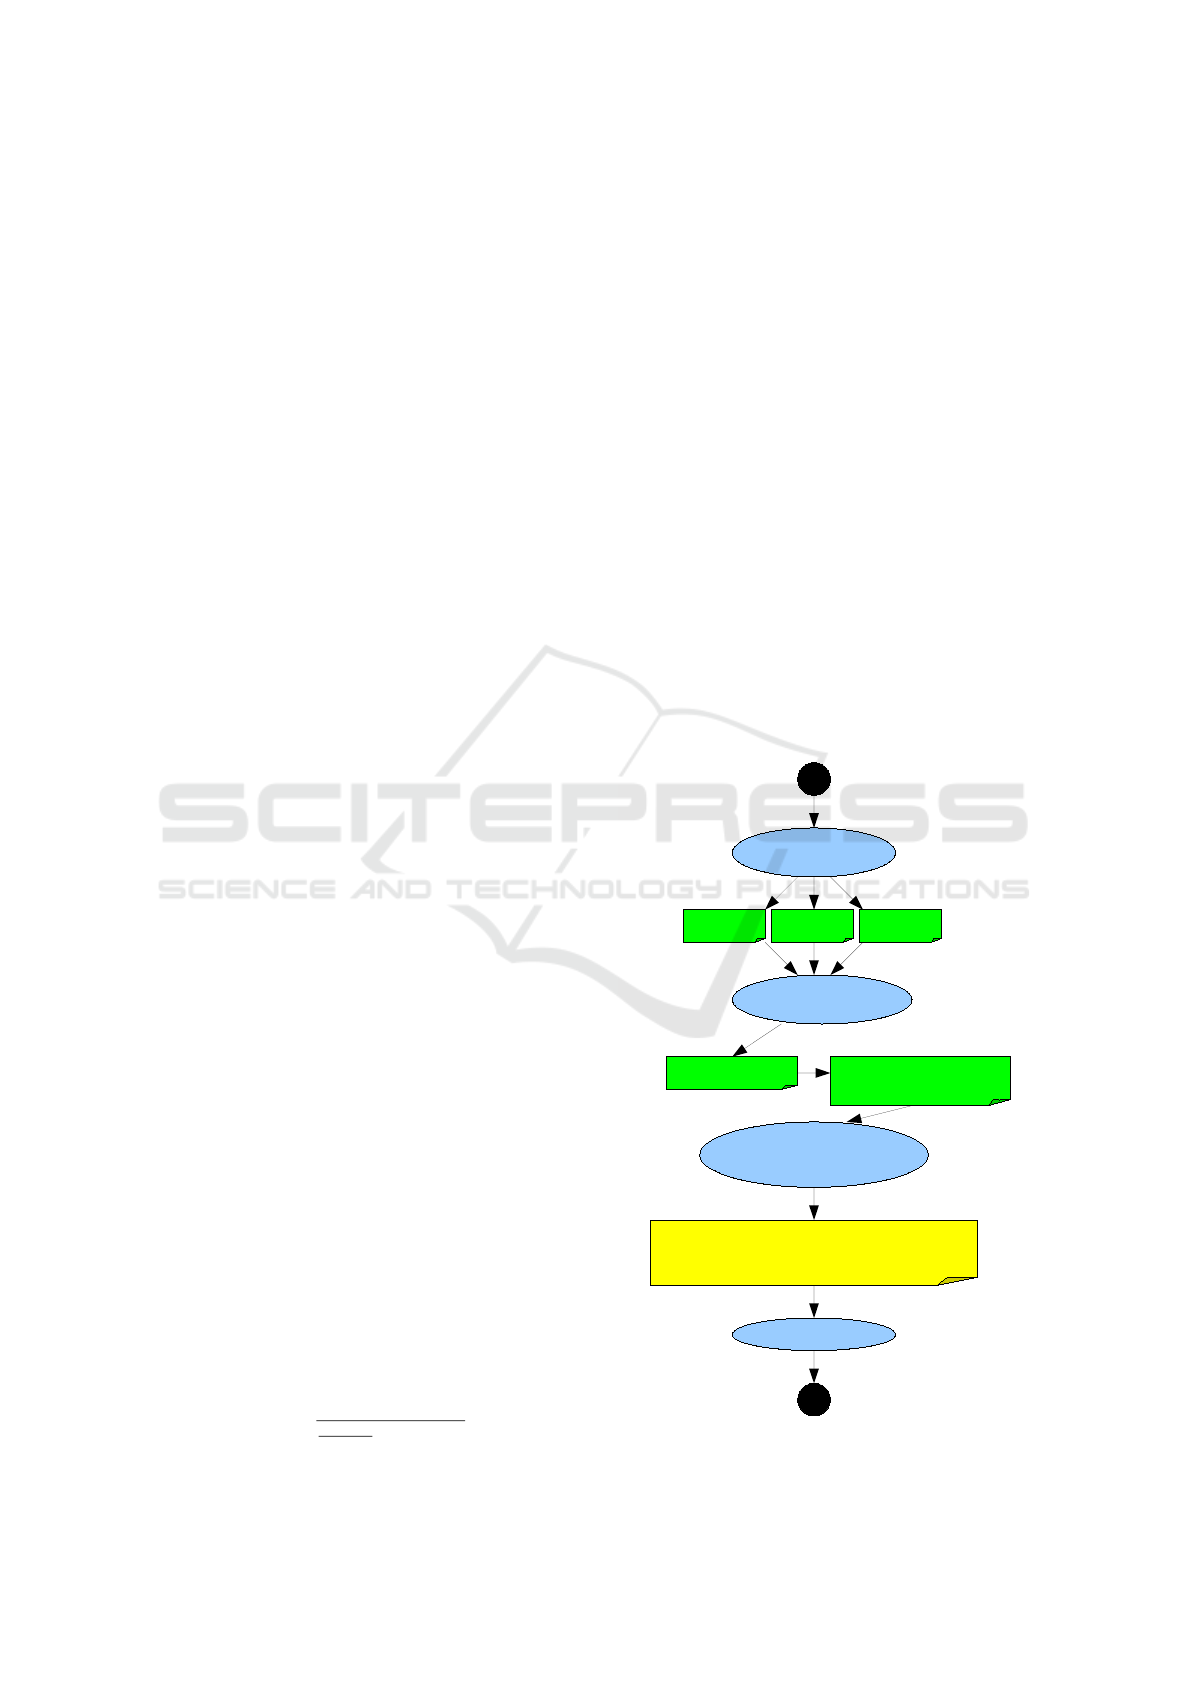
The risk profile data provided by domain experts
is stored in a text file. As described in (Graf et al.,
2015) the workflow reads data (step 1) and employs a
data mining method that calculates distances between
risk profiles based on the values of their risk factors.
Domain experts rated the risk factors on a scale of
1-5, where 1 is “extremely important,” and 5 is “not
at all important.” To remove a possible mismatch of
scale between the features and have a possibly well-
balanced risk factor r f set, the workflow applies nor-
malisation in the second step.
MSS
i
=
r f
i
− M
1
card(r f )
∑
|r f
i
− M|
. (1)
Normalisation employs the modified standard score
(MSS) (Tanner, 2012; Zacharski, 2012) (see Formula
1), which prevents the influence of the outliers. Each
risk profile column is normalised separately. The
modified standard score demonstrates how big the de-
viation from the median value M is. First the median
value for each column is calculated. The median is
a middle value from the list, arranged from lowest to
highest value. Then, based on the median, the abso-
lute standard deviation can be calculated. In the third
step, computed risk factors are visualised for a given
dimension. For example, one such dimension is the
relation between institutional and expert risk profiles.
Finally, a cyber analyst should analyse the resulting
plot in the context of a particular SA task.
The calculation of the nearest risk profile is de-
scribed in the workow shown in Fig. 2. The risk pro-
file data collected from domain experts is stored in
a text file and is used in the classification task. The
institutional risk profile that comprises the most im-
portant factors for the institution settings is stored in
an additional file. The workflow execution starts with
the reading of both input files. Input risk profiles are
stored in the data model classifier and are converted
1. READ RISK
FACTORS
2. NORMALIZE
FACTOR 1 FACTOR 2 FACTOR n
MEDIAN
PLOT OF RISK FACTORS FOR
INDIVIDUAL EXPERT PROFILES
3. VISUALIZE RISK
FACTOR DIMENSIONS
4. ANALYZE PLOT
END
ABSOLUTE STANDARD
DEVIATION
START
Figure 1: The risk factor visualisation workflow.
An Expert System for Facilitating an Institutional Risk Profile Definition for Cyber Situational Awareness
349
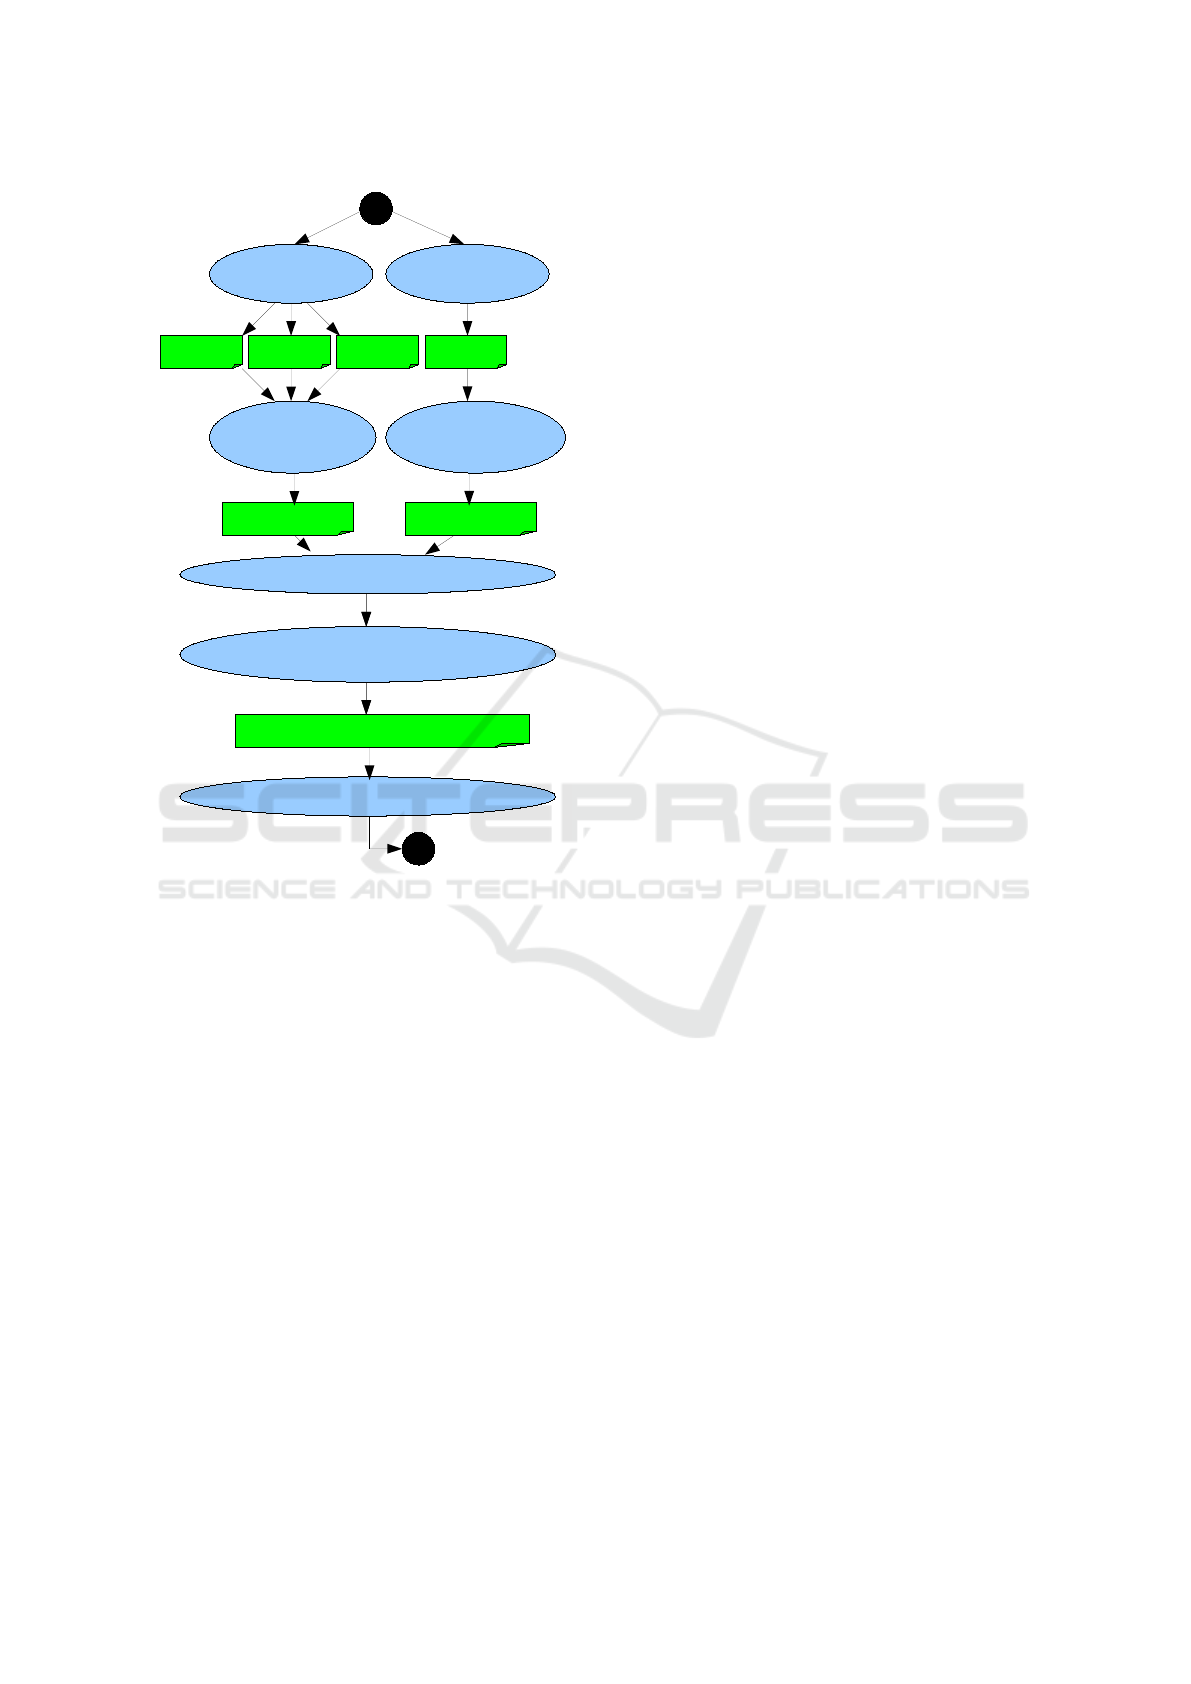
1. READ EXPERT
PROFILES
2. CALCULATE
RISK
VECTORS
PROFILE 1 PROFILE 2 PROFILE n
n RISK VECTORS
END
START
1. READ USER
PROFILE
2. CALCULATE
RISK
VECTOR
AUTOCOMPLETED USER RISK PROFILE
RISK VECTOR
3. FIND NEAREST NEIGHBOUR
BY COSINE SIMILARITY
4. COMPLETE USER PROFILE BY
EXPERT PROFILE SETTINGS
PROFILE
5. TRIGGER REQUIRED SA ACTIONS
Figure 2: The workflow for autocompletion of a user risk
profile.
in risk profile vectors in the second step. Applying
the cosine similarity algorithm (Dehak et al., 2010),
(Ye, 2011) we find the nearest risk profile from the
expert knowledge base. In the next step we merge the
detected nearest risk profile with institutional settings
and produce the autocompleted institutional risk pro-
file.
4 EVALUATION
The goal of this evaluation was to leverage the do-
main expert knowledge base for detection of the near-
est risk profile as described in the workflow for auto-
completion of a user risk profile (see Fig. 2), pointing
out potential risks relevant for Situation Awareness
and exploitation of aggregated data for visualisation
of risk factor coherences. This process is described in
the risk factor visualization workflow (see Fig. 1).
4.1 Hypothesis and Evaluation Methods
of the Risk Factor Analysis
The hypothesis is that similar risk factor profiles auto-
matically aggregated from the domain expert knowl-
edge base are located close to each other in the plot
for a particular dimension. Therefore, a cyber analyst
can easily detect alternative risk factor profiles with
particular features for a specific task. Our approach
should give an organisation a base of information that
helps to determine an alternative risk profile with the
required feature set. This decision should be the best
choice for the organisation’s Situation Awareness in-
frastructure. The employment of data mining tech-
niques facilitates this task for a cyber analyst by per-
forming complex calculations and comparisons.
In all scenarios (see section 4.3), we performed the
sample risk profile calculation for different use cases
of Situational Awareness. The hypothesis is that a cy-
ber analyst will define some of the most important risk
factors and apply them as an input to the data mining
tool. The output of the tool should be the given input
accomplished with risk factor settings for the remain-
ing risk factors from the nearest expert risk profile.
The calculated profile then supports the decision mak-
ing (e.g. file format selection) for the critical infras-
tructure configuration and triggers required for Situa-
tional Awareness actions.
Each evaluation scenario addresses the visualisa-
tion of risk factor dimensions. The hypothesis is that
visualisation of particular risk factor dimensions will
facilitate and speed up endangerment analysis and
demonstrate a level of agreement between important
risk factors. Thus, a cyber analyst can adjust required
risk factor settings in order to reduce SA risks. We
evaluated different risk profile dimensions for the se-
lected risk factors.
4.2 Evaluation Data Set
The basis for the risk metrics calculation was pro-
vided through two exploratory studies organised by
Heather Ryan (Ryan, 2014), (Ryan et al., 2015)
in which 170 digital preservation experts evaluated
thirty one file format endangerment factors (see Ta-
ble 1). Table 1 represents the expert profiles from
the dataset from the file format survey data. In the
survey, digital preservation experts rated 31 risk fac-
tors on a scale of 1 to 5. Where 1 stands for the ex-
tremely important impact of the risk factor and 5 for
the low impact. We interpreted the experts ratings of
the endangerment factors as levels of risk associated
with each factor. The risk estimation ratings from the
trusted digital preservation experts were evaluated for
ICISSP 2016 - 2nd International Conference on Information Systems Security and Privacy
350

each of these factors based on their knowledge, ex-
perience and expertise. The columns to the right of
the Risk Factor column present first five expert risk
profiles out the 170 participants, whereas the number
marks an expert index, e.g. E1 for “Expert 1”.
For evaluation purposes well known risk factors
were selected and each risk factor was graded in the
range from 1 (high impact on preservation risk) to 5
(low impact on preservation risk).
For evaluation of the modified standard score in
the visualisation sample four selected expert profiles
are used (see Table 2). These manually aggregated
metrics were used as an input data by the tool for vi-
sualisation and analysis of risk factor coherences.
4.3 Experimental Results and
Interpretation
One of the main information source for SA are log
files. In the first scenario we investigate risk factors
that are important to secure rendering and accessibil-
ity of these data (see Table 2). The columns to the
right of the “Risk Factor” column present four use
case risk profiles, whereas the number marks a use
case index. In the second scenario, we consider a
use case, where a format should be selected to cre-
ate a backup in case of attack, or to restore data af-
ter cleaning and new installation. The third use case
is intended for graphical data e.g. maps or images
and the selection of associated file formats e.g. “GIF”
or “PNG”. Important risk factors here are “Render-
ing Software Availability” and “Storage Space”. We
focus the use case description on this scenario. The
fourth scenario is about decisions for instructions for-
mat e.g. “PDF” and for the documentation format e.g.
“DOC”.
The experimental results are presented in Table
3 that shows the institutional, nearest expert, and
merged risk profiles for the graphical use case, calcu-
lated by the modified standard score. The associated
original values for the expert risk profiles presented
in column “Inst” can be found in the Table 2 in the
column “UC3” and values presented in the “Expert”
column is one of the 170 expert risk profiles. Addi-
tional risk profiles are presented in the Table 1.
The experimental results are visualized in Figure
3 according to the graphics use case. The institutional
settings for risk factors are flagged by the green cir-
cles.
In the calculated log file use case, the maximal
cosine similarity 0.584 was found for the anonymized
expert profile with index 79. This expert profile points
cyber analyst attention to additional important risk
factors, such as “Developer/Corporate Support”, “Le-
Table 1: Risk Factor Ratings for Digital Content Preserva-
tion from the Survey.
Expert Profiles ExpertID
Risk Factor E1 E2 E3 E4 E5
Availability Online 2 2 3 2 2
Backward Compatibility 1 1 2 1 1
Community Support 2 1 2 2 2
Complexity 1 2 2 3 2
Compression 3 4 2 2 2
Cost 2 1 2 2 1
Developer/Corporate Support 2 2 2 1 2
Domain Specificity 3 2 2 2 3
Ease Of Identification 1 2 2 3 2
Ease Of Validation 1 4 2 3 2
Error Tolerance 2 1 2 2 2
Expertise Available 2 2 2 1 2
Forward Compatibility 2 5 2 4 1
Geographical Spread 3 4 4 4 3
Institutional Policies 1 4 3 4 1
Legal Restrictions 1 1 2 1 1
Life Time 2 3 3 2 3
Metadata Support 2 3 1 2 1
Rendering Software Availability 1 1 1 1 1
Rendering Software Functionality 2 2 1 3 1
Revision Rate 3 3 2 2 3
Specifications Available 2 2 1 1 2
Specification Quality 2 2 1 2 2
Standardization 2 2 1 3 1
Storage Space 2 1 2 3 2
Technical Dependencies 2 1 2 1 1
Technical Protection Mechanism 1 1 2 3 2
Third Party Support 2 1 2 2 2
Ubiquity 2 1 2 2 2
Value 1 1 2 3 1
Viruses 2 3 2 3 3
Table 2: Use Case Risk Profiles.
Institutional Profiles Use Case ID
Risk Factor UC1 UC2 UC3 UC4
Availability Online 1 - - 1
Backward Compatibility 1 - - -
Community Support 5 - - -
Complexity - - - -
Compression - 1 - -
Cost 2 - 2 1
Developer/Corporate Support - - - -
Domain Specificity - - - -
Ease Of Identification - - 3 4
Ease Of Validation - 2 - 2
Error Tolerance - - - -
Expertise Available 1 - - 4
Forward Compatibility - - - 1
Geographical Spread - - - -
Institutional Policies 1 1 2 -
Legal Restrictions - - - -
Life Time 2 2 - -
Metadata Support - - - -
Rendering Software Availability 1 1 1 1
Rendering Software Functionality 1 2 2 2
Revision Rate - - - -
Specifications Available 1 - 4 5
Specification Quality 2 - - -
Standardization - - - -
Storage Space 1 1 1 4
Technical Dependencies 1 1 - -
Technical Protection Mechanism 1 1 - -
Third Party Support - - - -
Ubiquity - - - -
Value - - - -
Viruses - - - -
gal Restrictions”, “Metadata Support”, “Value” and
“Viruses”. This should trigger the required SA ac-
tions to reduce these risks. For example, ensure that
the cyber analyst has software developer contact data,
verify that there is sufficient level of access rights for
the analyst’s role, review licenses expiration date, ex-
amine how to identify existing formats, etc.
An Expert System for Facilitating an Institutional Risk Profile Definition for Cyber Situational Awareness
351
For the backup use case the best match 0.587
was found for the anonymized expert profile with in-
dex 36. This expert profile directs the cyber ana-
lyst’s attention to additional important risk factors,
such as “Availability Online”, “Community Support”,
“Cost”, “Error Tolerance”, “Geographical Spread”,
“Legal Restrictions”, “Standardization”, “Ubiquity”
and “Value”. This indicates that the cyber analyst
should determine that there is enough free space for
the backup in the storage, consider what should be in-
cluded in the backup, confirm that the backup data is
renderable and confirm that possible errors will not
compromise the backup. It is obvious that not all sug-
gested risk factors are applicable for particular case.
For example, “Geographical Spread” might not be
necessarily important in the SA domain. In this case
cyber analyst can adjust related risk factor according
to his institution requirements. Suggested risk factors
provide an idea about what should be considered in
the decison making process.
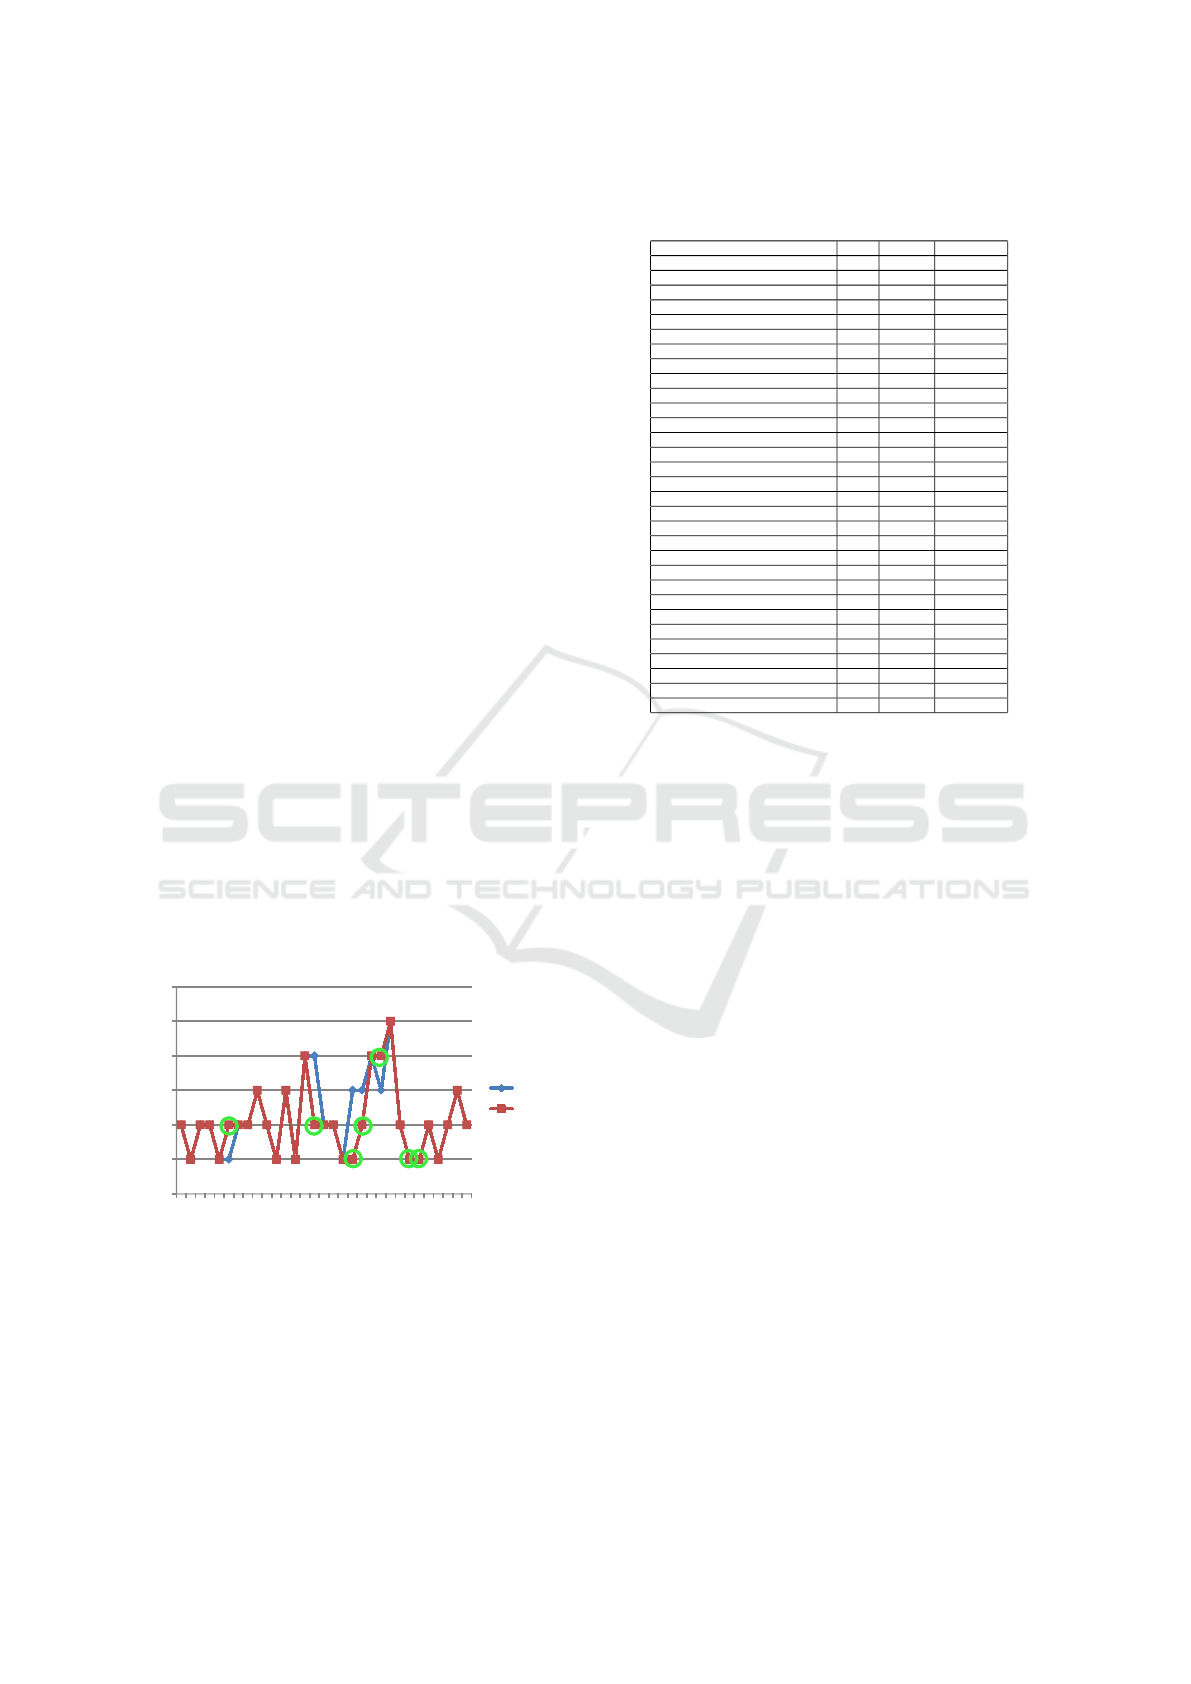
In the calculated graphics use case, the maxi-
mal cosine similarity 0.484 was computed for the
anonymized expert profile with index 9. This ex-
pert profile (see Figure 3) considers additional impor-
tant risk factors, such as “Backward Compatibility”,
“Compression”, “Error Tolerance”, “Forward Com-
patibility”, “Metadata Support” and “Third Party Sup-
port”. This indicates that the cyber analyst should re-
view selected format documentation to estimate the
complexity and forward/backward compatibility of
the format. The goal here to ensure image render-
ability.
Graphics Risk Profile
0
1
2
3
4
5
6
1 3 5 7 9 11 13 15 17 19 21 23 25 27 29 31
Expert 3
Graphics
Rating
Risk
Factors
Figure 3: Plot for relation of graphics risk factor settings be-
tween institutional expert and the most nearest expert pro-
file.
For the documentation use case the best match
0.586 was calculated for the anonymized expert pro-
file with index 54. This expert profile suggests
additional important risk factors, such as “Back-
ward Compatibility”, “Community Support”, “Devel-
oper/Corporate Support”, “Error Tolerance”, “Meta-
Table 3: The Most Similar Risk Profile for Graphical Data
Scenario Based.
Risk Factor Inst Expert Generated
Availability Online - 2 2
Backward Compatibility - 1 1
Community Support - 2 2
Complexity - 2 2
Compression - 1 1
Cost 2 1 2
Developer/Corporate Support - 2 2
Domain Specificity - 2 2
Ease Of Identification - 3 3
Ease Of Validation - 2 2
Error Tolerance - 1 1
Expertise Available - 3 3
Forward Compatibility - 1 1
Geographical Spread - 4 4
Institutional Policies 2 4 2
Legal Restrictions - 2 2
Life Time - 2 2
Metadata Support - 1 1
Rendering Software Availability 1 3 1
Rendering Software Functionality 2 3 2
Revision Rate - 4 4
Specifications Available 4 3 4
Specification Quality - 5 5
Standardization - 2 2
Storage Space 1 1 1
Technical Dependencies 1 1 1
Technical Protection Mechanism - 2 2
Third Party Support - 1 1
Ubiquity - 2 2
Value - 3 3
Viruses - 2 2
data Support”, “Value” and “Viruses”. This indicates
that the cyber analyst should examine existing docu-
mentation and instructions for renderability.
Figure 3 shows a visualisation of the values from
associated Table 3. These plot demonstrate the rela-
tion between two selected expert setting vectors for
the 31 evaluated risk factors on the X axis. The asso-
ciated risk factor labels are presented in the Table 2.
The Y axis is range of the risk factor raitings. Figure
shows that the selected expert profiles demonstrate
good agreement with institutional profile.
This approach should support the definition of
institutional policies for SA risk calculation. This
knowledge about risks can reduce endangerment level
of a digital data by providing the cyber analyst with
an opportunity to ameliorate potential issues before
they pose a more substantial threat. Employing the
provided algorithm the cyber analyst can either select
between predefined expert settings or estimate impor-
tant risk factors by themself and find the most similar
expert profile for the definition of remaining values.
In order to acquire more specific information
about a particular file format the File Format Metadata
Aggregator (FFMA) tool (Graf and Gordea, 2012) is
employed.
These results demonstrate that a semi-automatic
approach for risk factor visualisation is very effective
and it is a signicant improvement compared with man-
ual analysis for planning and validation of design for
critical infrastructure. Resulting actions of the pre-
ICISSP 2016 - 2nd International Conference on Information Systems Security and Privacy
352

sented analysis tool may be validation, checking or
updating of the software.
5 CONCLUSIONS
In this work we presented an approach for the easy
creation of an institutional risk profile in Situational
Awareness. Models employed in digital preservation
domain we apply for analysis in cyber SA field.
The main contribution of this work is the employ-
ment of data mining techniques to support risk factors
set up with a few of the most important values for a
particular institution. The resulting risk profile is used
to support cyber analysts with semi-automatic estima-
tion of endangerment level for file formats.
The presented method employs a domain expert
knowledge base collected through a survey to detect
Situational Awareness risks for particular institutions.
Another contribution is support for the visualisa-
tion and analysis of risk factors. To facilitate easier
decision-making, the collected information about the
risk factors is presented as a multidimensional vector.
The proposed methods improve the interpretability of
risk factor information and the quality of the Situa-
tional Awareness process.
We make use of the modified standard score data
mining method to analyse the collected data, and the
cosine similarity calculation to compare risk profiles.
In the evaluation section, different risk factor di-
mensions are exposed. The presented plots demon-
strate coherences in risk factors and help solve prac-
tical Situational Awareness issues. Using the devel-
oped approach and adjusting input data, cyber ana-
lysts have the ability to choose the appropriate risk
factor setting for digital preservation planning in their
institution.
The presented approach is designed to facilitate
decision making for the Situational Awareness using
domain expert knowledge. As future work we plan
to increase the amount and quality of collected expert
information and to extend the tool with additional vi-
sualisation scenarios.
REFERENCES
Ayris, P., Davies, R., McLeod, R., Miao, R., Shenton, H.,
and Wheatley, P. (2008). The life2 final project report.
Final project report, LIFE Project, London, UK.
Barford, P., Dacier, M., Dietterich, T., Fredrikson, M., Gif-
fin, J., Jajodia, S., Jha, S., Li, J., Liu, P., Ning, P., Ou,
X., Song, D., Strater, L., Swarup, V., Tadda, G., Wang,
C., and Yen, J. (2010). Cyber sa: Situational aware-
ness for cyber defense. In Jajodia, S., Liu, P., Swarup,
V., and Wang, C., editors, Cyber Situational Aware-
ness, volume 46 of Advances in Information Security,
pages 3–13. Springer US.
David Tarrant, Steve Hitchcock, L. C. (2011). Where the
semantic web and web 2.0 meet format risk manage-
ment: P2 registry. International Journal of Digital
Curation, 6(1):165–182.
Dehak, N., Dehak, R., Glass, J., Reynolds, D., and Kenny,
P. (2010). Cosine similarity scoring without score
normalization techniques. in Proceedings of Odyssey
2010 - The Speaker and Language Recognition Work-
shop (Odyssey 2010), pages 71–75.
Graf, R. and Gordea, S. (2012). Aggregating a knowledge
base of file formats from linked open data. Proceed-
ings of the 9th International Conference on Preserva-
tion of Digital Objects, poster:292–293.
Graf, R. and Gordea, S. (2013). A risk analysis of file
formats for preservation planning. In Proceedings
of the 10th International Conference on Preservation
of Digital Objects (iPres2013), pages 177–186, Liss-
abon, Portugal. Biblioteca Nacional de Portugal, Lis-
boa.
Graf, R., Gordea, S., and Ryan, H. M. (2015). A tool
for facilitating an institutional risk profile definition.
17th International Conference on Digital Information
Management (ICDIM2015), pages 2998 – 3003.
Hunter, J. and Choudhury, S. (2006). Panic: an integrated
approach to the preservation of composite digital ob-
jects using semantic web services. International Jour-
nal on Digital Libraries, 6, (2):174–183.
Jackson, A. N. (2012). Formats over time: Exploring uk
web history. Proceedings of the 9th International
Conference on Preservation of Digital Objects, pages
155–158.
Kott, A. and Wang, C. (2014). Cyber Defense and Situa-
tional Awareness. Springer International Publishing
Switzerland.
Lawrence, G. W., Kehoe, W. R., Rieger, O. Y., Walters,
W. H., and Kenney, A. R. (2000). Risk management
of digital information: A file format investigation.
Morita, P., Burns C.M., H., and He, Q. (2011). Situa-
tion awareness and risk management understanding
the notification issues. In Stud Health Technol Inform.
PubMed.
Pearson, D. and Webb, C. (2008). Defining file format obso-
lescence: A risky journey. The International Journal
of Digital Curation, Vol 3, No 1:89–106.
Ryan, H. (2014). Occam’s razor and file format endan-
germent factors. In Proceedings of the 11th Interna-
tional Conference on Preservation of Digital Objects
(iPres2014) (accepted for publication), Melbourne,
Australia.
Ryan, H., Graf, R., and Sergiu, G. (2015). Human and
machine-based file format endangerment notification
and recommender systems development. In Proceed-
ings of the 12th International Conference on Digi-
tal Preservation (iPres2015), Chapel Hill, North Car-
olina, USA. UNC.
Salmon, P., Stanton, N., Walker, G., and Green, D. (2006).
Situation awareness measurement: A review of appli-
An Expert System for Facilitating an Institutional Risk Profile Definition for Cyber Situational Awareness
353

cability for {C4i} environments. Applied Ergonomics,
37(2):225 – 238.
Tanner, D. (2012). Using statistics to make educa-
tional decisions. Library of Congress Cataloging-in-
Publication Data, pages 77–104.
Vermaaten, S., Lavoie, B., and Caplan, P. (2012). Identify-
ing threats to successful digital preservation: the spot
model rsik assessment. D-Lib Magazine, 18(9/10).
Ye, J. (2011). Cosine similarity measures for intuitionistic
fuzzy sets and their applications. Mathematical and
Computer Modelling, 53(12):91 – 97.
Zacharski, R. (2012). A Programmer’s Guide to Data Min-
ing: The Ancient Art of the Numerati.
ICISSP 2016 - 2nd International Conference on Information Systems Security and Privacy
354
