
Feature Selection for Emotion Recognition based on Random Forest
Sonia Gharsalli
1
, Bruno Emile
1
, H´el`ene Laurent
2
and Xavier Desquesnes
1
1
Univ. Orl´eans, INSA CVL, PRISME EA 4229, Bourges, France
2
INSA CVL, Univ. Orl´eans, PRISME EA 4229, Bourges, France
Keywords:
Emotion Recognition, Feature Selection, Cohn-Kanade Database, Random Forest, SVM.
Abstract:
Automatic facial emotion recognition is a challenging problem. Emotion recognition system robustness is
particularly difficult to achieve as the similarity of some emotional expressions induces confusion between
them. Facial representation needs feature extraction and feature selection. This paper presents a selection
method incorporated into an emotion recognition system. Appearance features are firstly extracted by a Gabor
filter bank and the huge feature size is reduced by a pretreatment step. Then, an iterative selection method
based on Random Forest (RF) feature importance measure is applied. Emotions are finally classified by SVM.
The proposed approach is evaluated on the Cohn-Kanade database with seven expressions (anger, happiness,
fear, disgust, sadness, surprise and the neutral expression). Emotion recognition rate achieves 95.2% after
feature selection and an improvement of 22% for sadness recognition is noticed. PCA is also used to select
features and compared to RF base feature selection method. As well, a comparison with emotion recognition
methods from literature which use a feature selection step is done.
1 INTRODUCTION
Facial expressions particularly those indicating emo-
tions are very interesting in human interaction and in
feeling expression. P. Ekman (Ekman, 1992) defines
six universal emotions which are anger, happiness,
fear, disgust, sadness and surprise. In this paper only
these six emotions are considered.
Generally, emotion recognition system is based
on three steps namely face detection, feature extrac-
tion and feature classification. Each one of these
steps is fundamental for a good recognition. In this
work, we focus on feature extraction and selection.
Extracted features specially appearance features have
often huge dimensionality which consumes time and
memory. In addition confusion between emotion can
be made when high number of features are used. A
feature selection step is often integrated into emotion
recognition systems. Three groups of feature selec-
tion approaches are distinguished: “filter”, “embed-
ded” and “wrapper”. Filter-based feature selection
approach is applied before the classification step. It
often uses some criterion to measure the most dis-
criminative features independently of the classifica-
tion method. Zhang et al (Zhang et al., 2011) de-
velop a facial expression application based on tex-
ture extraction by three different methods, Local Bi-
nary Pattern (LBP), Gabor and Scale-Invariant Fea-
ture Transform (SIFT). The Correlation Feature Se-
lection (CFS) technique is then adopted to select dis-
criminative texture features. Good features are thus
defined as features highly correlated with the ground
truth class labels and yet un-correlated with other fea-
ture subsets. Another filter approach is adopted by
Soyel et al (Soyel and Demirel, 2010) to select the
optimal features generated by measuring 3D facial ex-
pression distances. The selection technique is based
on Fisher criterion. Lajevardi et al (Lajevardi and
Hussain, 2009) compare between three selection tech-
niques namely optimal filter selection technique, the
Principal Component Analysis (PCA) and the mutual
information feature selection (MIFS). They conclude
that MIFS improves the discrimination between facial
expression. Benli et al (Benli and Eskil, 2014) use the
Sequential Forward Selection (SFS) strategy to ob-
tain the best representation of facial muscle. Then,
a Support Vector Machine (SVM) is applied to recog-
nise the considered expressions. Conversely to filter
methods, embedded algorithms select features during
the training step to achieve best accuracy. Shan et al
(Shan et al., 2009) and Bartlett et al (Bartlett et al.,
2003) applied Adaboost to reduce respectively Lo-
cal Binary Pattern (LBP) features and Gabor features.
Adaboost is a powerful method that combines weak
classifiers to obtain a strong one. The set of weak
classifiers presents the selected features when a de-
610
Gharsalli, S., Emile, B., Laurent, H. and Desquesnes, X.
Feature Selection for Emotion Recognition based on Random Forest.
DOI: 10.5220/0005725206100617
In Proceedings of the 11th Joint Conference on Computer Vision, Imaging and Computer Graphics Theory and Applications (VISIGRAPP 2016) - Volume 4: VISAPP, pages 610-617
ISBN: 978-989-758-175-5
Copyright
c
2016 by SCITEPRESS – Science and Technology Publications, Lda. All rights reserved

cision stump is used. For its part, wrapper method
is based on information obtained from the classifi-
cation method to evaluate feature relevance. Li et
al (Li et al., 2010) develop an iterative method for
feature selection in 3D facial expression recognition
task. They firstly choose the feature with the high-
est class separation rate to initialise the selection set,
then compute the recognition rate and the mutual in-
formation score for each feature. Features with the
highest recognition rate and the lowest mutual infor-
mation score are selected.
In this paper, we develop a novel wrapper fea-
ture selection algorithm based on permutation impor-
tance computed by Random Forest (RF). Our selec-
tion method is incorporated in an emotion recogni-
tion system. In our system, we use for real-time face
detector an adapted version of Viola&Jones method
(Viola and Jones, 2001) available in OpenCV (Brad-
ski et al., 2006). Facial features are then extracted by
12 Gabor filters and selected by our selection method.
Finally, a Support Vector Machine is applied to clas-
sify the image as one of the six emotions (anger, hap-
piness, fear, sadness, surprise, disgust) or the neutral
expression.
The paper is organised as follows: feature extrac-
tion method is presented in section 2, followed in
section 3 by a presentation of Random Forest (RF)
method and RF parameter selection in section 4. Our
selection method is detailed in section 5. Section 6
develops experimental results and presents a compar-
ison to other emotion recognition methods.
2 FEATURE EXTRACTION
Gabor filters are powerful for appearance feature ex-
traction. We applied it to extract the skin changes in
facial expression. Faces are detected automatically
and normalized to 80 ×60 sub-images based on the
location of the eyes. They are then filtered by a Ga-
bor filter bank. Different orientations and scales ap-
plied on the mother wavelet generate the filter bank
(1) (Kotsia et al., 2008).
ψ
k
(z) =
||k||
2
σ
2
exp(−
||k||
2
||z||
2
2σ
2
)(exp(ik
t
z) −exp(
σ
2
2
)),
(1)
z = (x, y) presents the pixel coordinates and k
refers to the characteristic of the wave vector, k =
[k
v
cosφ
u
, k
v
sinφ
u
]
t
with k
v
= 2
−
v+2
2
π, φ
u
= µ
π
8
.
The parameter σ controls the width of the Gaus-
sian, we set σ = 2π. The subtraction in the second
term of equation (1) makes the Gabor kernels DC-
free to have quadrature pair (sine/cosine) (Movellan,
2005). Thus, the Gabor process becomes more simi-
lar to the human visual cortex.
Our bank is constructed by three frequencies
v=0, 1, 2 and four orientations 0,
π
4
,
π
2
,
3π
4
. We obtain
then a feature vector of 57600 descriptors, which cor-
responds to (60×80) pixels×12 filters. We applied
a first feature reduction by downsampling the filtered
face to 20×15. We obtain therefore 3600 features and
nearly the same recognition rate as when considering
the full set. Despite this reduction, the feature number
remains excessive.
3 FEATURE SELECTION
To minimise feature number and select the most effec-
tive ones for classification, we use a feature selection
method based on feature importance score. Among
the various techniques used in machine learning to
compute feature importance scores, we chose Ran-
dom Forest (RF) a widely used method in variable se-
lection problem when dense features are handled such
as in (Genuer et al., 2010).
3.1 Random Forest
RF is a collection of binary decision trees constructed
on several bootstrap samples. Bootstrapping is a ran-
domly sampling with replacement from the training
set N. A random descriptor selection (denoted by
mtry) from the whole sample p is also applied to con-
struct each node of the tree. Thus, it minimises the
correlation between the classifiers within the forest
and avoid the problem of large features (p >> N),
while maintaining the strength (Breiman, 2001). So,
RF results are sensitive to mtry parameter. The selec-
tion of this parameter is presented in section 4.2.
One of the most important characteristics of RF
is the use of the Out-Of-Bag (OOB) error estimation.
The Out-Of-Bag is a sample set not used in the train-
ing of the current tree. It is thus used for error esti-
mation. This internal estimation of the generalization
error enhances the accuracy of tree classification. It is
also crucial for feature importance quantification.
Different techniques are used to measure feature
importance from the naive measure to the most
advanced one. We use the permutation importance
measure, one of the most used feature importance
measures. Feature importance (FI) is computed by
the increase of the mean error when the feature value
(X
j
t
) is randomly changed by one of its values from
the OOB set (X
j
t
oob
).
Feature Selection for Emotion Recognition based on Random Forest
611
FI(X
j
) =
1
nb trees
∑
t
err
X
j
t
−err
X
j
t
oob
(2)
4 RF PARAMETERS SELECTION
RF method is sensitive to two parameters namely the
number of trees in the forest nb
tree and the num-
ber of features chosen for a split mtry. An appropri-
ate choice of RF parameters enhances the RF perfor-
mances.
In this section, an investigation of the appropri-
ate parameters for our emotion recognition system is
done. We study their variation impact on emotion
recognition rate for seven selected feature sets {100,
200, 500, 1000, 1500, 2000, 3000}.
4.1 Number of Trees in RF Method
We train RF method with different number of
nb
tree ∈ {100, 200, 300, 400} and we also vary the
mtry parameter. A five cross-validation method is ap-
plied to compute the SVM recognition rate on the se-
lected feature set.
Our experiment shows that when nb
tree ∈ {100,
200} the maximal recognition rate obtained is about
92%. However, it exceeds 93% when nb
tree ∈
{300, 400}. We chose for the remainder of the pa-
per nb tree = 400.
4.2 Parameter mtry
As mentioned above the number of randomly chosen
features for a split (mtry) has a real impact on RF
results. Five cross-validation folds are computed for
each of the feature sets mentioned above. The num-
ber of input features chosen to construct a node varies
from the default parameter used in RF classification
√
p to the whole features p (3600 features) which re-
duces RF to Bagging, mtry ∈{
√
p,
p
4
,
p
2
,
3p
4
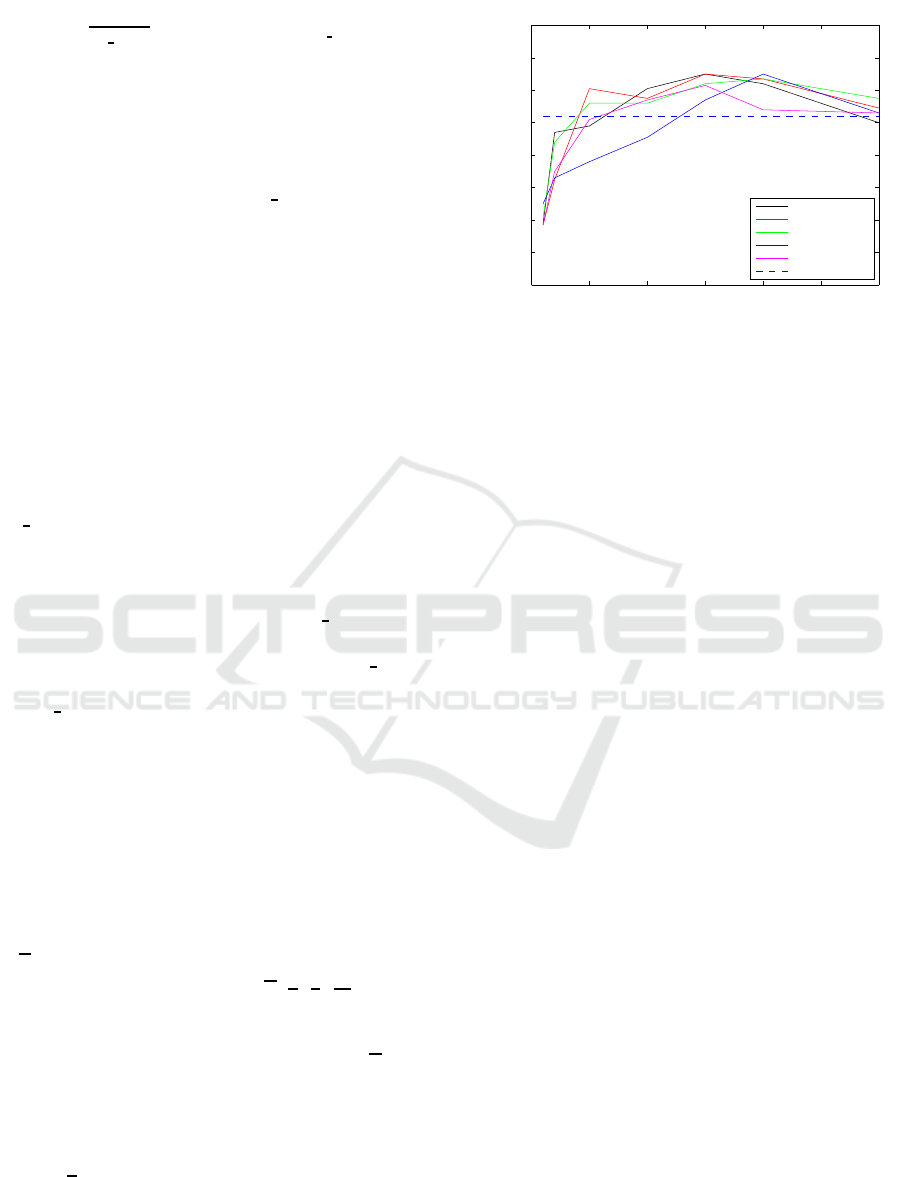
, p}. Fig-
ure 1 presents the recognition rate on the seven feature
sets with different mtry values.
We notice that the default value mtry =
√
p gives
low recognitionrates specially when the feature selec-
tion set is smaller than 2000 features. Bagging recog-
nition rates are also lower than other mtry recognition
rates. Thus, for the remainder of the paper we chose
mtry =
p
4
which gives a good recognition rate on ap-
proximately most feature sets.
We also remark that all recognition rates decrease
dramatically when only 200 features are selected.
0 500 1000 1500 2000 2500 3000
80
82
84
86
88
90
92
94
96
number of features selected
Recognition rates
Recognition rates for tree=400 with different value of mtry
mtry=p/4
mtry=p/2
mtry=3p/4
mtry=sqrt(p)
mtry=p
without selection
Figure 1: Mean cross-validation recognition rate at each of
the feature sets, using different mtry values.
5 FEATURE SELECTION
METHOD
The feature selection method is finally based on three
steps :
• Iterative feature reduction based on RF impor-
tance.
• Feature selection based on SVM recognition rate
and RF error rate.
• Evaluation of emotion recognition performance.
The dataset is divided on three sets : training
set {S
train
}, evaluation set {S
evaluation
} and test set
{S
test
}. Let F
t
be the feature set selected at each t
iteration. We initialize F
0
to the whole features.
5.1 Iterative Feature Reduction based
on RF Importance
In this step we use S
train
to construct the RF trees with
the parameters chosen in the previous section. Then,
based on the OOB sets chosen during the training, the
RF feature importance measures (FI) are computed
for F
t
. To smooth out the variability of FI, we repeat
these steps ten times and finally compute the mean
importance measures. As shown in figure 2, features
are ranked by sorting their mean FI in descending or-
der. The least important features are afterwards re-
moved.
Figure 3 presents a set of feature importance mea-
sures and their variability during the ten runs. We re-
mark that features with low mean FI have low vari-
ability, while features with high mean FI have large
variability. This instability is caused by useless fea-
tures, which are part of the features with low FI. This
VISAPP 2016 - International Conference on Computer Vision Theory and Applications
612
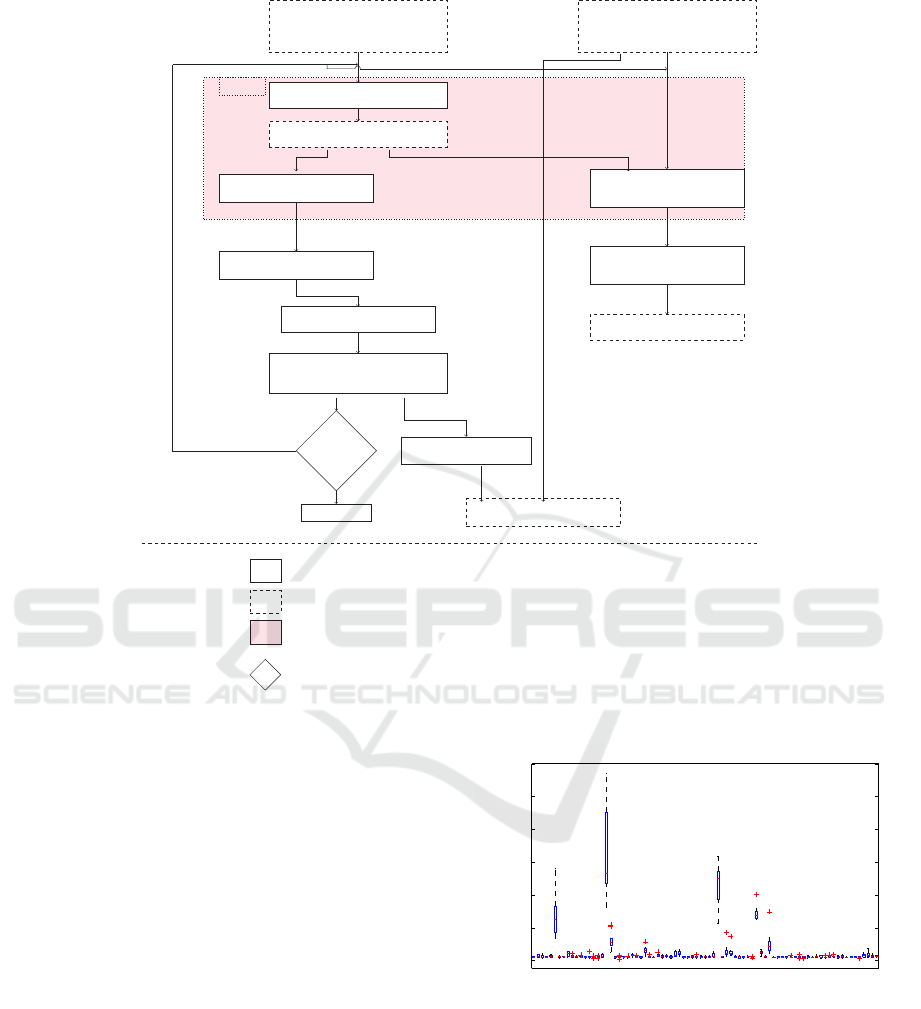
Feature extracted by
Gabor method
(S
train
)
Feature extracted by
Gabor method
(S
evaluation
)
Train RF
RF model
Compute FI
Compute RF
error
10 times
Compute mean FI
Compute mean RF
error
Rank features
Select F
t
(Remove least important features)
SVM training
Recognition rates
Mean RF errors
Legend :
Activity
Data (Input, output)
Block repeated 10 times
Test node
F
t
< 200
Stop iterations
true
false
Figure 2: Feature selection algorithm steps.
conclusion tallies with the tests conducted by Genuer
et al on variable importance computed by RF (Genuer
et al., 2010).
We chose to remove a percentage (30%) of the
least important features instead of removing the same
number of features on each iteration. This helps to
avoid the removal of important features when the
number of features is too low.
As shown in figure 2, SVM is trained with F
t
features on S
train
, then emotion recognition rates are
computed with F
t
features on S
evaluation
. In this pa-
per, we chose a linear SVM classifier since it has few
parameters to set and is fast to train. RF error rates
are also computed with F
t
features on S
evaluation
. Both
rates are recorded for each iteration to be analysed
during the second step.
This step is repeated until the number of features
is too low to discriminate the different classes. As
mentioned in section 4.2, the recognition rate de-
creases when the feature set is about 200 features.
0.05
0.1
0.15
0.2
0.25
0.3
0.35
123456789101112131415161718192021222324252627282930313233343536373839404142434445464748495051525354555657585960616263646566676869707172737475767778798081
Features
Feature importance measures
Importance
Figure 3: A set of feature importance measures during 10
runs.
5.2 Feature Selection based on SVM
Recognition Rate and RF Error
Rate
Based on the behaviour of emotion recognition rates
and RF error rates stored for each iteration, we select
Feature Selection for Emotion Recognition based on Random Forest
613

the best feature set for our task, denoted in the remain-
der by F
selection
. In some cases many feature sets are
good candidate for the feature selection. More details
are presented in section 6.1.
5.3 Evaluation of Emotion Recognition
Performance
Once the number of features is chosen, FI is com-
puted on S
train
+ S
evaluation
. Then, only the F
selection
most important features are selected. SVM is trained
with the selected features on both S
train
and S
evaluation
.
The performance is finally evaluated with F
selection
on
S
test
.
6 EXPERIMENTAL RESULTS
Our method is trained and evaluated on the Cohn-
Kanade database. This database (Kanade et al., 2000)
is largely used in automatic facial expression recogni-
tion. It includes 97 posers between the ages of eigh-
teen and thirty; 65% are female, 15% are African-
American, and 3% are Asian or Latino. They present
the six basic emotions, namely: anger (Ang), disgust
(Dis), surprise (Sur), happiness (Hap), fear (Fea) and
sadness (Sad). The last frame of each sequence ex-
pressing the required emotion is coded using the Fa-
cial Action Coding System (FACS). The first image
always presents the neutral expression (Neut). In this
paper, we use these images to train our approach on
the neutral expression.
6.1 RF based Feature Selection
In this section, feature selection results on the Cohn-
Kanade database are described . At first, features are
iteratively reduced and SVM recognition rates and RF
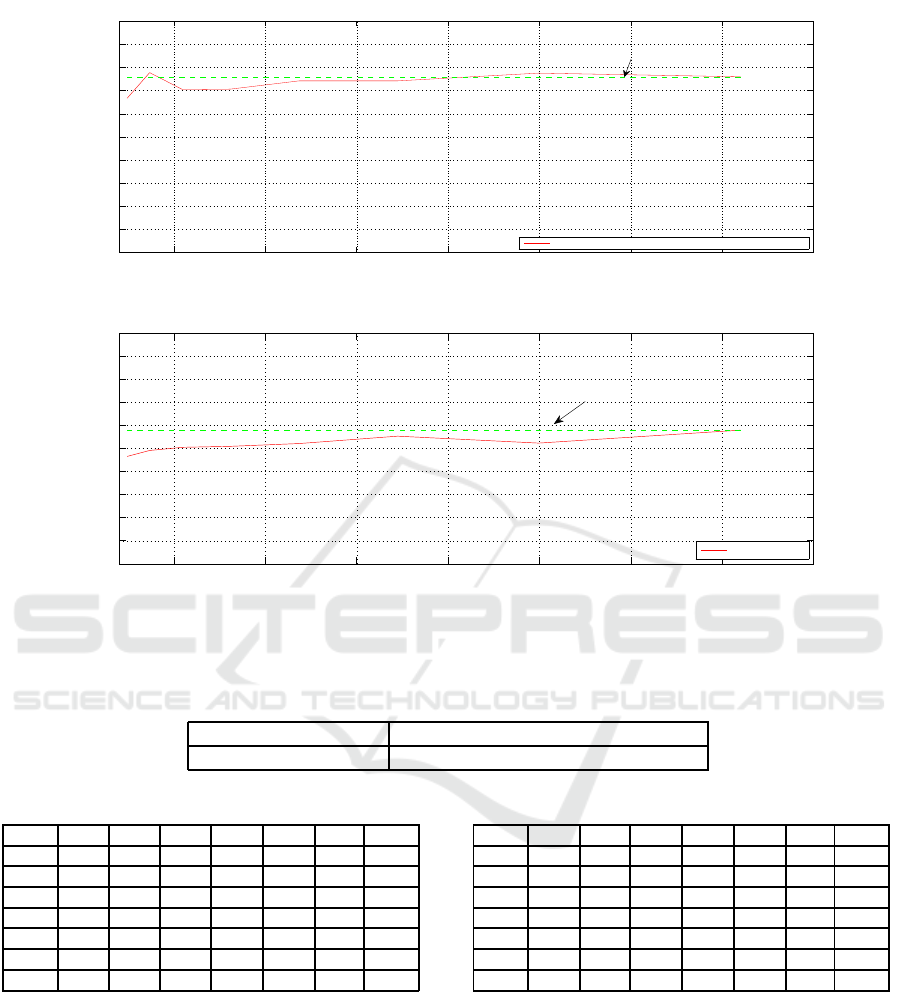
error rates are stored. Figure 4 presents respectively
the behaviour of SVM recognition rates and RF error
rates for different feature selection sets. We remark
that when the selected features number exceeds 1200
the recognition rate is very close to the one obtained
with the whole features. In the meanwhile the RF er-
ror rate is slightly reduced comparing to RF error rate
before feature selection. Feature sets from 1200 se-
lected features to 3000 selected features seems good
candidates to construct the final model.
We tested four feature sets F
selection
∈
{1200, 1500, 1800, 2500}. As mentioned pre-
viously, we compute FI on both sets S
train
and
S
evaluation
. First, all features are ranked and only
the most important features are chosen (F
selection
).
Finally, SVM is trained with the selected features.
Once the model is created, the recognition rate is
computed on the test set. Table 1 presents the four fea-
ture set recognition rates (RR). We notice that feature
sets 1500, 1800 and 2500 enhance emotion recogni-
tion rates respectively by 1.2%, 2% and 2.4%. Fea-
ture set containing 1200 features leads to a recogni-
tion rate which is about the same as the whole one.
While 1800 and 2500 feature sets allow an increase
of the performance, they both remain slightly differ-
ent. We thus chose for the remainder of the paper
1800 features (F
selection
= 1800).
Table 2 and table 3 present respectively the confu-
sion matrix before and the confusion matrix after fea-
ture selection. Labels are presented on rows and the
predicted emotions are presented on columns. The
comparison between both matrices reveals that re-
moving features mainly allows to decrease the confu-
sion between sadness and the neutral expression. In-
deed, sadness recognition rate is increased by about
22%, while the other emotions keep the same recog-
nition rate except disgust which decreases by 8%.
6.2 Comparison with Principal
Component Analysis
Principal component analysis (PCA) is a statistical
approach, often used in feature reduction. It trans-
forms feature space to an uncorrelated one. Principal
componentswhich form the newfeature space, are the
linear combination of the original features.
In this section, we use PCA to select a subspace of
the original features by thresholding feature weights
computed by the method and stored in the transfor-
mation matrix. This approach is used in (Chuang
and Wu, 2004) to select acoustic features for emotion
recognition speech.
PCA is firstly applied to create the principal com-
ponents on S
train
+ S
evaluation
. Various principal com-
ponent sets are chosen to capture different amount of
data variance {85%, 90%, 95%, 97%}. A threshold
set, from −0.01 to 0.04 in 0.005 steps, is also tested
to obtain the best recognition rate with the lowest fea-
ture set. After choosing 95% of the variance and a
threshold of 0.025 on feature weights, SVM is finally
applied on S
test
. The recognition rate is about 95.2%
for 3061 selected features.
The comparison between emotion recognition
rates before (see table 2) and after PCA feature reduc-
tion (see table 4) reveals that PCA feature reduction
enhances sadness recognition by only 13.8% (com-
pared with 22% for RF based feature selection) but
keeps a better recognition rate for disgust.
The main advantage of RF based feature selection
is that it selects less features (1800 features) than PCA
VISAPP 2016 - International Conference on Computer Vision Theory and Applications
614
500 1000 1500 2000 2500 3000 3500 4000
70
72
74
76
78
80
82
84
86
88
90
Recognition rate with different feature selection sets computed on the evaluation set
Recognition rate behaviour on setected feature
Recognition rate without selection
(a)
500 1000 1500 2000 2500 3000 3500 4000
15
16
17
18
19
20
21
22
23
24
25
RF error with different feature selection sets computed on the verification set
RF erreur rate
Error rate without selection
(b)
Figure 4: Results computed on different feature selection sets of the S
e
valuation on the CK+ database: (a) the mean recogni-
tion rate, (b) the mean RF error.
Table 1: Recognition rates with different feature selection and without selection.
Feature selection 1200 1500 1800 2500 3600
Recognition rate (RR) 93.2 94.4 95.2 95.6 93.2
Table 2: Confusion matrix before feature selection.
Ang Hap Fea Dis Sad Sup Neut
Ang 100 0 0 0 0 0 0
Hap 0 100 0 0 0 0 0
Fea 0 0 88.8 11.1 0 0 0
Dis 0 0 0 100 0 0 0
Sad 0 0 0 0 75 0 25
Sup 0 0 0 0 0 100 0
Neut 0 0 0 0 11.1 0 88.8
to achieve the same mean recognition rate. Figure
5 presents PCA emotion recognition rates when the
number of features is decreased. When features are
reduced to 2000, the PCA recognition rate decreases
to 90%. For the record, RF based feature selection
recognition rates remain greater than 93% until 1200
features (see table1).
Table 3: Confusion matrix after RF feature selection.
Ang Hap Fea Dis Sad Sup Neut
Ang 100 0 0 0 0 0 0
Hap 0 100 0 0 0 0 0
Fea 0 0 88.8 11.1 0 0 0
Dis 0 0 8.3 91.6 0 0 0
Sad 0 0 0 0 97.2 0 2.7
Sup 0 0 0 0 0 100 0
Neut 0 0 0 0 11.1 0 88.8
6.3 Comparison with Other Methods
for the Literature
This section presents a comparison between our
method and other methods from the literature that
also use the Cohn-Kanade database. Shan et al (Shan
et al., 2009) extract features with Local Binary Pat-
tern (LBP) method and select the most discrimina-
tive ones with Adaboost. In Adaboost training step,
the features are used as weak classifiers. Only the
Feature Selection for Emotion Recognition based on Random Forest
615
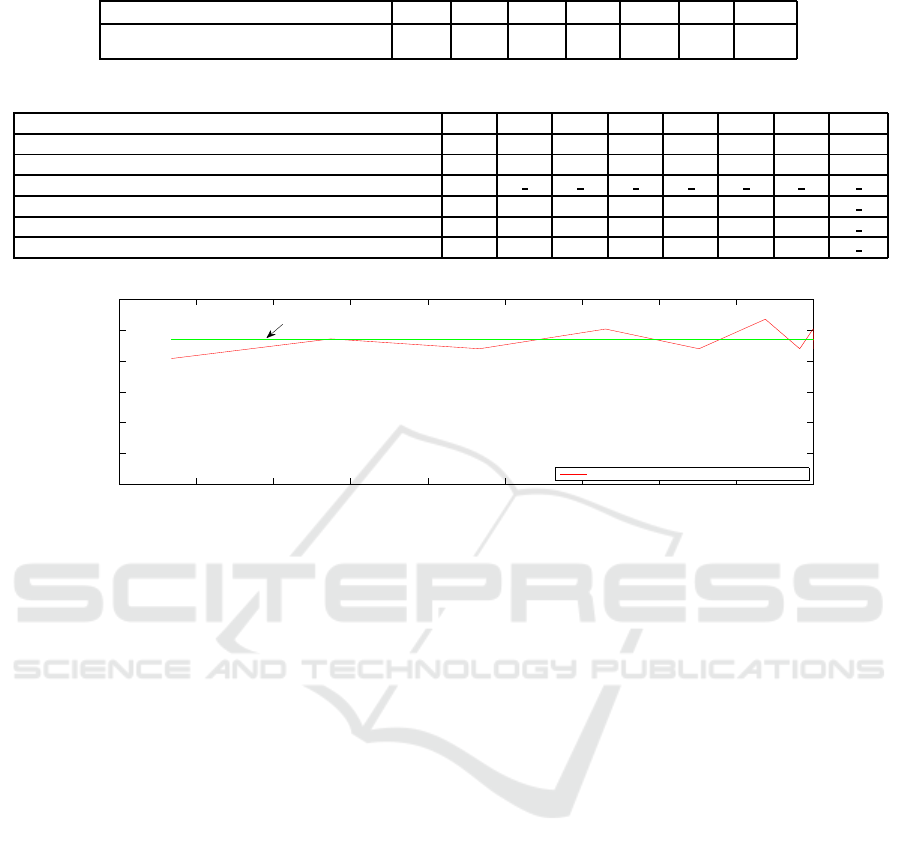
Table 4: Emotion recognition rates after PCA feature selection.
Ang Hap Fea Dis Sad Sup Neut
RR after PCA feature selection
100 100 88.8 100 88.8 100 88.8
Table 5: Emotion recognition performances of methods from literature. (-) not available.
Methods RR Ang Hap Fea Dis Sad Sup Neut
LBP+ Adaboosted+SVM (Shan et al., 2009) 91.4 85.1 97.5 79.9 97.5 74.7 97.3 92.0
LBP+Adaboost (Shan et al., 2009) 84.6 66.6 90.1 70.0 92.5 61.2 92.5 95.2
LBP+ AdaBoosted+LDA (Shan et al., 2009) 77.6
Log-Gabor+4-OF+K-NN (Lajevardi and Hussain, 2009) 68.9 45.2 96.0 41.3 68.2 75.6 87.4
Log-Gabor+PCA+K-NN(Lajevardi and Hussain, 2009) 52.5 23.1 63.5 58.5 66.7 36.7 66.7
Log-Gabor+MIFS+K-NN(Lajevardi and Hussain, 2009) 75.5 61.5 96.1 54.5 77.8 75.7 87.5
1800 2000 2200 2400 2600 2800 3000 3200 3400 3600
70
75
80
85
90
95
100
Recognition rate with different feature selection sets after PCA feature selection
Recognition rate behaviour on setected feature
Emotion recognition rate before PCA feature selection
Figure 5: Emotion recognition rates during PCA feature selection.
most discriminant features are combined on the final
Adaboost classifier. Three different classification ap-
proaches are then adopted for facial expression recog-
nition namely SVM, Adaboost and linear discrimi-
nant analysis (LDA). Lajevardi et al (Lajevardi and
Hussain, 2009) methods consider only the six basic
emotions without the neutral expression. Features are
extracted by 40 Log-Gabor filters. Three different
methods are used to select the best features. The op-
timal filter method is used to reduce filters from 40
to 4 optimal filters (4-OF). This method is used as a
pretreatment step for two feature reduction methods:
PCA and MIFS. The principal component analysis
(PCA) transforms extracted features from the feature
domain to a more reduced one based on the number
of chosen principal components. The mutual informa-
tion feature selection method (MIFS) measures com-
mon information of two randomly chosen vectors. An
iterative feature selection method based on MIFS is
then developed. Features selected by the three meth-
ods are classified by KNN method. The performances
of all these approaches are presented on table 5. We
remark that our method performs better, exceeding
the recognition rate of 95%, while the presented meth-
ods extracted from the literature don’t achieve 92%.
7 CONCLUSION
This paper presents a facial emotion recognition ap-
proach. Facial appearance is firstly extracted by Ga-
bor filters. RF based feature selection technique is
afterwards applied. Finally, emotions are classified
by SVM method. Evaluated on the Cohn-Kanade
database, the proposed system achieves a recognition
rate of 95.2%, features selection allowing particularly
to improve sadness recognition by about 22%. A
comparison between the proposed method and other
emotion recognition methods prove the robustness of
our approach while working with a reduced feature
set.
In future works, we intend to investigate the im-
pact of feature selection on each emotion. The study
of feature selection impact on spontaneous emotion
seems to be a promising direction, particularly be-
cause confusion between spontaneous emotions is
high.
REFERENCES
Bartlett, M.-S., Gwen, L., Ian, F., and Javier, R.-M. (2003).
Real time face detection and facial expression recog-
nition: Development and applications to human com-
VISAPP 2016 - International Conference on Computer Vision Theory and Applications
616

puter interaction. Computer Vision and Pattern Recog-
nition Workshop.
Benli, K. and Eskil, M. (2014). Extraction and selection
of muscle based features for facial expression recog-
nition. 22nd International Conference on Pattern
Recognition, pages 1651–1656.
Bradski, G., Darrell, T., Essa, I., Malik, J., Perona, P.,
Sclaroff, S., and Tomasi, C. (2006). http ://source-
forge.net/projects/opencvlibrary/.
Breiman, L. (2001.). Random forests. Machine learning,
45(1):5–32.
Chuang, Z.-J. and Wu, C.-H. (2004). Multi-modal emotion
recognition from speech and text. Computational Lin-
guistics and Chinese Language Processing, 9:45–62.
Ekman, P. (1992). An argument for basic emotions. cogni-
tion and emotion, pages 169–200.
Genuer, R., Poggi, J. M., and Malot, C. T. (2010). Variable
selection using random forests. Pattern Recognition
Letters, 31(14):2225–2236.
Kanade, T., Cohn, J. F., and Yingli, T. (2000). Comprehen-
sive database for facial expression analysis. 4th IEEE
International conference on Automatic Face and Ges-
ture Recognition.
Kotsia, I., Buciu, I., and Pitas, I. (2008). An analysis of fa-
cial expression recognition under partial facial image
occlusion. Image and Vision Computing, 26(7):1052–
1067.
Lajevardi, S. and Hussain, Z. (2009). Feature selection for
facial expression recognition based on mutual infor-
mation. 5th IEEE GCC Conference and Exhibition,
pages 1 – 5.
Li, P., Phung, P., Bouzerdoum, A., and Tivive, F. (2010).
Feature selection for facial expression recognition.
2nd European Workshop on Visual Information Pro-
cessing, pages 35–39.
Movellan, J. (2005). Tutorial on gabor filters. MPLab Tu-
torials, UCSD MPLab, Tech.
Shan, C., Gong, S., and McOwan, P. (2009). Facial ex-
pression recognition based on local binary patterns: A
comprehensive study. Image and Vision Computing,
27:803–816.
Soyel, H. and Demirel, H. (2010). Optimal feature selection
for 3d facial expression recognition using coarse-to-
fine classification. Turkish Journal of Electrical Engi-
neering and Computer Sciences., 18(6):1031–1040.
Viola, P. and Jones, M. (2001). Robust real-time object de-
tection. In international journal of computer vision.
Zhang, L., Tjondronegoro, D., and Chandran, V. (2011).
Evaluation of texture and geometry for dimensional
facial expression recognition. International Confer-
ence on Digital Image Computing: Techniques and
Applications, pages 620–626.
Feature Selection for Emotion Recognition based on Random Forest
617
