
Automated Soft Contact Lens Detection using Gradient based
Information
Balender Kumar
1
, Aditya Nigam
2
and Phalguni Gupta
3
1
Department of Computer Science and Engineering, Indian Institute of Technology Kanpur (IITK), Kanpur, India
2
School of Computer Science and Electrical Engineering, Indian Institute of Technology Mandi (IIT Mandi), Mandi, India
3
National Institute of Technical Teacher’s & Research (NITTTR), Salt Lake, Kolkata, India
Keywords:
Soft Contact Lens, Gradient, Spoofing, Biometric.
Abstract:
The personal identification number (PIN), credit card numbers and email passwords etc have something in
common. All of them can easily be guessed or stolen. Currently, users have been encouraged to create strong
passwords by using biometric techniques like fingerprint, palmprint, iris and other such traits. In all biometric
techniques, iris recognition can be considered as one of the best, well known and accurate technique but it
can be spoofed very easily using plastic eyeballs, printed iris and contact lens. Attacks by using soft contact
lens are more challenging because they have transparent texture that can blur the iris texture. In this paper a
robust algorithm to detect the soft contact lens by working through a small ring-like area near the outer edge
from the limbs boundary and calculate the gradient of candidate points along the lens perimeter is proposed.
Experiments are conducted on IIITD-Vista, IIITD-Cogent, UND 2010 and our indigenous database. Result of
the experiment indicate that our method outperforms previous soft lens detection techniques in terms of False
Rejection Rate and False Acceptance Rate.
1 INTRODUCTION
In such a dynamic and growing world population,
human personal authentication using physiological
biometric characteristics, can now been seen as a
prime social requirement and challenge. There are
several well studied traits such as fingerprint, face,
iris, ear, palmprint, hand geometry and voice. Since
none of them can provide the level of security re-
quired/desirable individually, several multimodal sys-
tems has also been proposed (Nigam and Gupta,
2015), (Nigam and Gupta, 2014a), (Nigam and
Gupta, 2013a) fusing various combinations of palm-
print, knuckleprint and iris images in pursuit of su-
perior performance. Image quality can play a very
important role in such systems, but it is a very chal-
lenging task. Quality can directly effect system per-
formance favorably or adversely. Very limited work is
done so far for iris (Nigam et al., 2013), knuckleprint
(Nigam and Gupta, 2013b) and palmprint quality esti-
mation as it lacks any such specific texture and struc-
ture as compared to face and fingerprints. Some more
work on non traditional traits such as knuckleprint
and palmprint recognition is reported in (Badrinath
et al., 2011), (Nigam and Gupta, 2011), (Nigam and
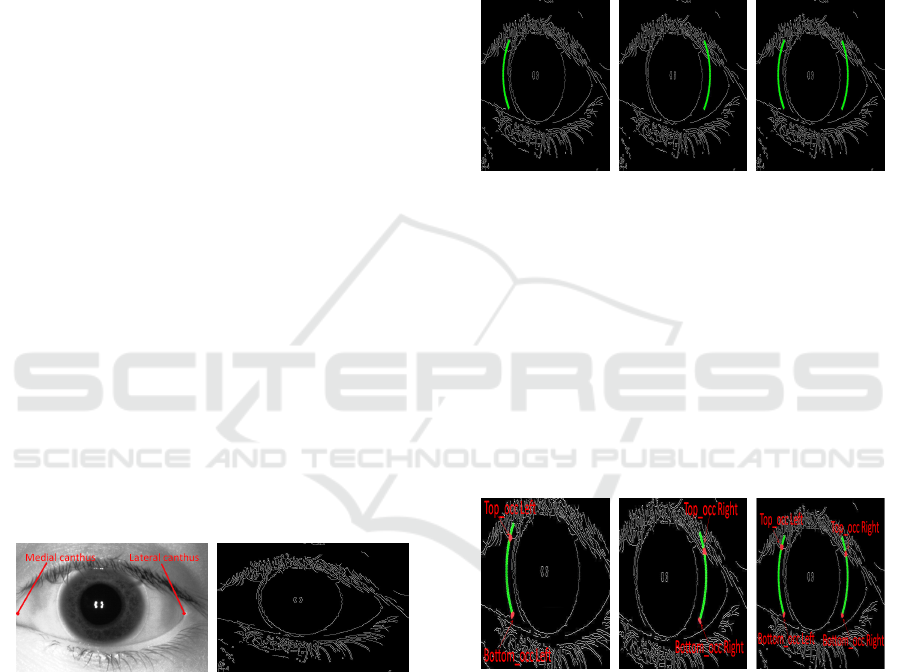
(a) Transparent Lens (b) Cosmetic Lens
Figure 1: Type of Contact Lens.
Gupta, 2014b) using SIFT and SURF fusion and
LK−tracking of corner features.
Iris is considered as the best available candidate
trait for biometric based systems. Flom and Safir
(Flom and Safir, 1987) have shown that iris texture is
unique for each individual. It has also been proved
that iris recognition systems performance degrades
when an iris without soft contact lens is compared
against same iris with contact lens (Nigam et al.,
2015), (Lovish et al., 2015). In this paper we have
proposed an algorithm to detect soft contact lens auto-
matically. Contact lenses can be considered as medi-
cal devices that can correct your nearsightedness, far-
sightedness and astigmatism vision problems. Con-
tact lenses have been around for more than four hun-
dred years. First contact lens introduce by Leonardo-
da-Vinci in 1505 (71, 2009). In 2004 it was estimated
that 125 million people use contact lenses worldwide
358
Kumar, B., Nigam, A. and Gupta, P.
Automated Soft Contact Lens Detection using Gradient based Information.
DOI: 10.5220/0005723903560363
In Proceedings of the 11th Joint Conference on Computer Vision, Imaging and Computer Graphics Theory and Applications (VISIGRAPP 2016) - Volume 3: VISAPP, pages 358-365
ISBN: 978-989-758-175-5
Copyright
c
2016 by SCITEPRESS – Science and Technology Publications, Lda. All rights reserved
(70, 2009). Contact lens can be categorized into two
types (i) Transparent contact lens or soft contact lens
(ii) Texture contact lens or Cosmetic contact lens.
Different types of contact lenses are shown in Fig-
ure 1.
Related Work and Background: Detection of
cosmetic lens is easier problem as compared to de-
tection of soft contact lens because former has a spe-
cific texture present over it. The soft contact lens
has no such texture, no color as shown in Figure1.
Hence techniques for detecting cosmetic contact lens
detection can not be used to detect soft contact lens.
In most of the NIR images it is very difficult to de-
tect soft contact lens even by the human eye. But
lens boundary is fairly visible because of specular
reflection which can be used to identify the contact
lens boundary. Algorithm for detection of soft con-
tact and cosmetic contact lenses has been proposed
in (Kywe et al., 2006) and the performance of this al-
gorithm is shown in Table1. The algorithm proposed
in (Erdogan and Ross, 2013) is based on traditional
edge detection exploiting sharp changes in pixel in-
tensity. Performance of this algorithm is also reported
in Table1.
Table 1: Related Work Summary of Soft Contact Lens De-
tection.
Technique used Database Result
(Kywe et al., 2006) Thermo-Vision 39 Subject 50-66%
(Erdogan and Ross, 2013) Edge Detection
ICE 2005 72-76%
MBGC 68.8-70%
(Yadav et al., 2014)
Texture Features
IIITD Cogent 56.66%
IIITD Vista 67.52%
UND I(2013) 65.41%
UND II(2013) 67%
2 PROPOSED APPROACH
In proposed approach contact lens donat (CLD) is de-
fined and extracted first. Later occlusion is estimated
and excluded from contact lens are. Finally Soft Con-
tact Lens Detection (SCLD) algorithm in introduced.
Contact Lens Donat(CLD): The Contact Lens
Donat (CLD) is the area where the possibility of con-
tact lens boundary is assumed to be maximum. It is
the part of sclera which lies from CLD
min
to CLD
max
as shown in Figure 2 and explained in Section 2.1.
2.1 CLD Detection
In this section, we detect the sclera area where the
possibility of contact lens boundary is maximum (in
case of contact lens iris image) by moving out radi-
ally from the limbus boundary. We call this area as
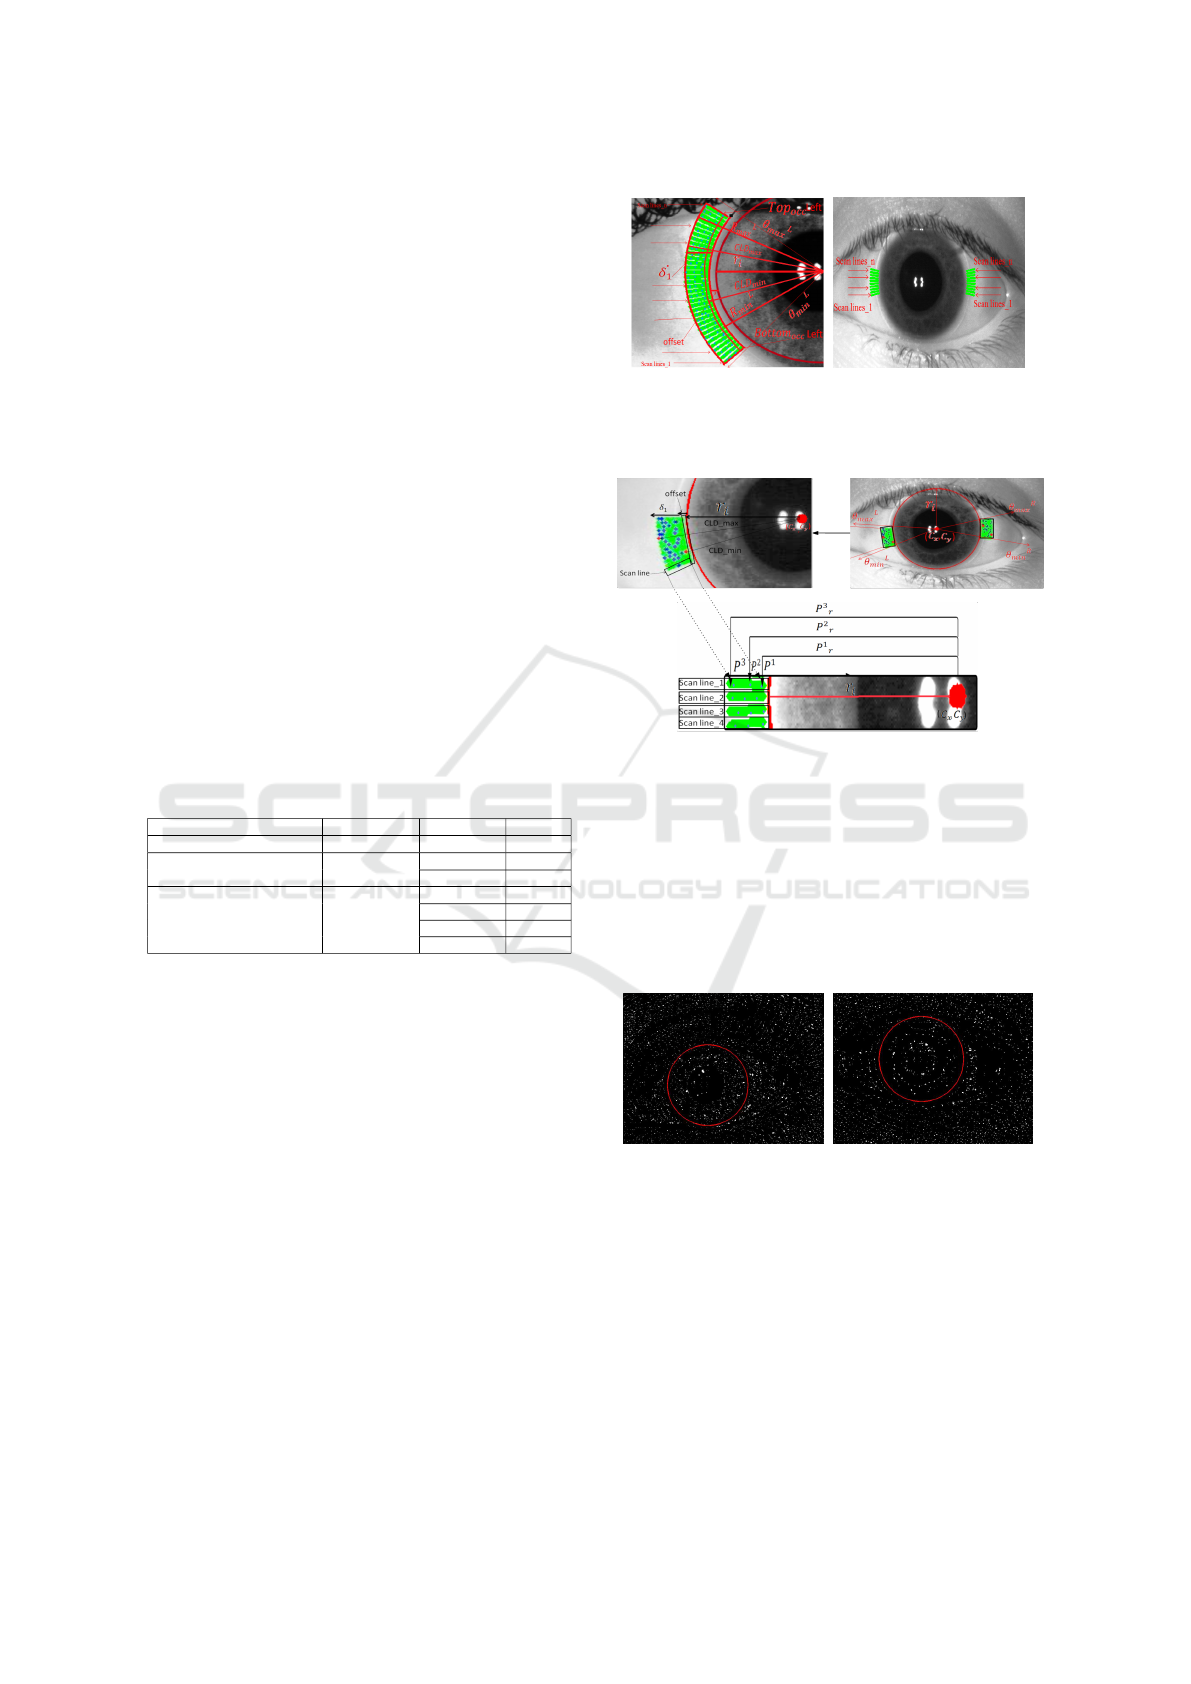
(a) CLD range (b) Scan Lines
Figure 2: Contact Lens Donat.
Figure 3: The Angular Range (CLD
min
and CLD
max
).
contact lens donat which is shown in Figure 2. De-
tection of contact lens donat has been done by com-
puting the contact lens area limits defined by (CLD
min
and CLD
max
) as shown in Figure 3. We have an input
iris image I over which we apply segmentation algo-
rithm (Daugman, 1993) and as a result, we get the
center (C
x
, C
y
) and radius r
i
of the iris in the input iris
image as shown in Figure 2.
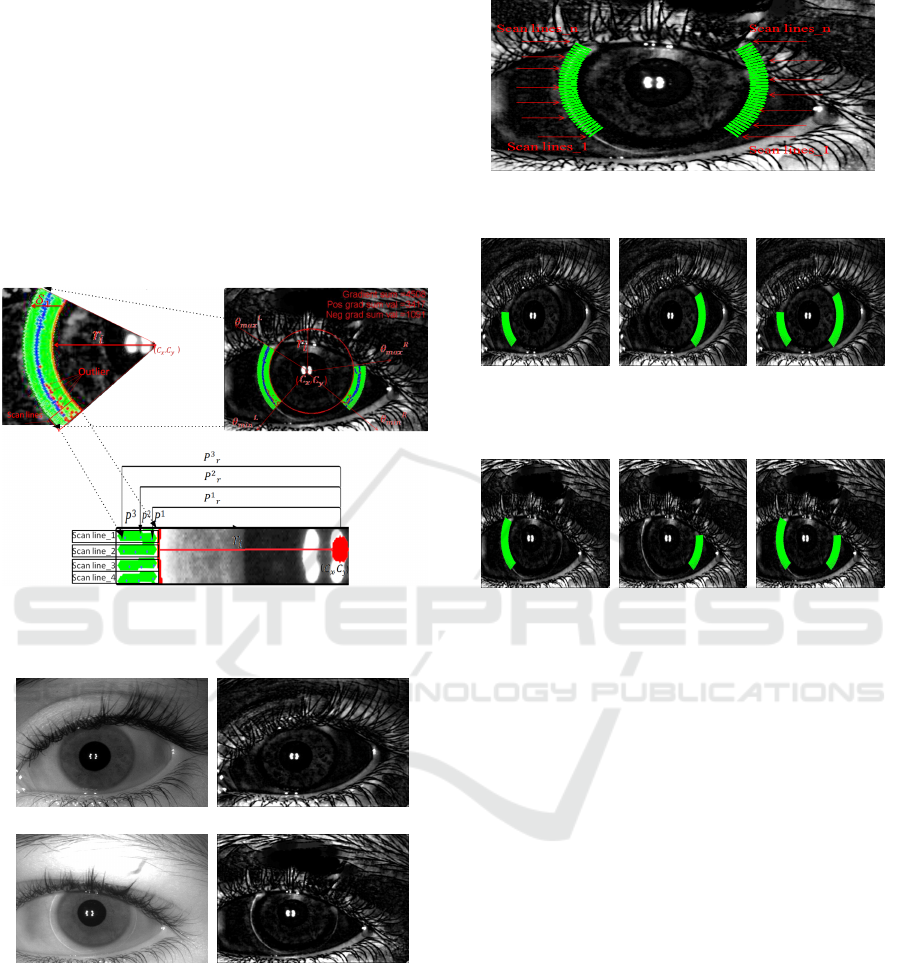
(a) NMS for no Lens (b) NMS for contact Lens
Figure 4: Effect of Non Maximal Suppression(NMS).
2.1.1 Non-Maximal Suppression(NMS)
Non-maximal suppression is a method to eliminate
those points which do not lie in the contact lens
boundary. For finding these candidate points, every
pixel is compared with its 4 neighboring (left, right,
top, bottom) pixels and if the selected pixel is maxi-
mum among them, then the corresponding value for
that pixel is set to 1, otherwise it is 0 producing a bi-
Automated Soft Contact Lens Detection using Gradient based Information
359
nary image. The figure 4(a) and Figure 4(b) shows
NMS of no lens iris image and soft lens iris image
respectively.
2.1.2 Search Range
The maximum possible radial distance for which con-
tact lens donat is present (radial range), can be rep-
resented as R
min
to R
max
as shown in Figure 2. We
define R
min
= r
i
+ o f f set and R
max
= R
min
+ δ, where
o f f set is a very small constant and δ
1
is the difference
between the maximum possible radius of the lens and
minimum possible radius of the iris in case of left por-
tion of iris, where radius of contact lens and iris are in
millimeter (mm). Similarly δ
2
can be defined for right
portion of iris. In general δ = δ
1
in case of left portion
of iris and δ = δ
2
in case of right portion of iris. But
it is observed that for humans, the diameter of the iris
lies in the range of 10.2 to 13.0 mm and typically it
is of 12 mm (Caroline and Andre, 2002). In case of
soft contact lens, the diameter ranges from 13mm to
15mm (87, 2015). However, diameter of an iris fluc-
tuates from 4 to 8 mm in the dark and 2 to 4 mm in
bright light (92, 2015). For calculating δ
1
and δ
2
, it is
assumed that 1 mm is equivalent to 3.779 pixels. Ide-
ally δ
1
(in pixels) is equal to 3.779 times of the differ-
ence between maximum possible contact lens radius
and minimum possible radius of iris but because of
dark and bright light effects, some times it may be
much more. Exact calculation of δ
1
or δ
2
is difficult
because it varies for database to database. We have
experimentally found out that it varies from 25 pixels
to 35 pixels in the three database that are considered
for our study. In ideal condition, δ
1
=δ
2
as shown in
Figure 5(a). But the lens may be misplaced or shifted
towards left or right. In case of shifting towards right,
δ
2
is greater than δ
1
as shown in Figure 5(b) and in
case of shifting towards left δ
1
is greater than δ
2
as
shown in Figure 5(c). Here we have fixed value of δ
1
,
δ
2
experimentally.
Scan Lines: These are the radial lines which
are orthogonal to the tangent at iris boundary within
the range R
min
to R
max
. Scan lines are characterized
in the region between R
min
to R
max
as shown in Fig-
ure 2(b). These scan lines are considered at angles
ranging from θ
min
to θ
max
at an angular distance of 1
◦
between two consecutive scan lines, where θ
min
and
θ
max
are determined experimentally.
With very high possibility, every scan line inter-
sects the lens boundary in case of contact lens im-
ages. In Figure 6(a), scan lines are at angles with in
the range [θ
L
min
,θ
L
max
] and [θ
R
min
,θ
R
max
] where L, R indi-
cates left & right portion of iris. Figure 6(c) shows
scan lines in both the regions.
Gradient of each pixel in a scan line is found by
(a) Equal (b) Right Shift (c) Left Shift
Figure 5: Shifting of Contact Lens.
(a) Left Side (b) Right Side (c) Both Region
Figure 6: Contact Lens Donat Selected Region.
using the formula given in Equation 1 and all gradient
values are stored in an array G.
f
0
(x) = f (x + 1) − f (x) (1)
Three absolute maximum gradient pixels from G
which are locally maximum are extracted. Non-
maximal suppression preserves local maximal prop-
erty. This process is repeated for each scan line. In
Figure 7, blue points indicate maximum gradient pix-
els in each scan line. Three maximum gradient pixels
(viz. P
1
, P
2
, P
3
) are considered because if only one
maximum intensity pixel is selected, then there is a
possibility that it is an outlier due to illumination ef-
fects, eyelid-eyelashes etc.
(a) Left (b) Right (c) Both
Figure 7: Three Maximum Intensity Pixel in Each line.
Corresponding to these three maximum intensity
pixels for each scan line their distances from the cen-
ter of the iris are stored and these distances are de-
noted as P
1
r
, P
2
r
and P
3
r
, where θ denotes the number
of scan lines. The minimum and maximum distances
from the selected pixel are denoted as CLD
min
and
CLD
max
respectively. In Figure 3, red points show
pixel values corresponding to CL D
min
and CLD
max
.
VISAPP 2016 - International Conference on Computer Vision Theory and Applications
360
2.2 Occlusion Exclusion from Lens
Eyelids and eyelashes are two major challenges in
contact lens detection. There is a need to detect them
initially because eyelashes cover some part of the con-
tact lens and due to which, the intensity varies, that in
turn, many affect the accuracy of the proposed lens
detection algorithm. Eyelids must also be detected
early as once can assume that lens cannot be beyond
the eyelid boundaries. So detection of eyelid helps to
set dynamic angle range which depends on the visibil-
ity of contact lens. The False Acceptance Rate(FAR)
and False Rejection Rate(FRR) increases sharply if
eyelid and eyelashes are not detected correctly.
We have proposed a novel approach for occlusion
exclusion from contact lens area. We detect the oc-
clusion from contact lens area using an edge detection
algorithm. It is assumed that over sclera, there cannot
be very prominent edge points (with higher thresh-
old). If some edges are present on sclera they must be
due to eyelashes and eyelids. Hence using these edge
points, we define our angle range which is dynamic
in nature. Therefore, use of eyelid can ensure that our
algorithm never crosses the eyelid boundaries.
Given any iris image I as input similar to the one
shown in Figure 8(a) segmentation algorithm is ap-
plied on I to obtain the iris center as (C
x
,C
y
) and the
distance from center to limbus boundary r
i
. In the first
step of the algorithm, we generate an edge map of iris
image on higher threshold. False edges are expelled
by removing those connected components which are
less than P pixels and a binary image is obtained with
no false edge as shown in Figure 8(b).
(a) Original Image (b) Edge Map
Figure 8: Generating edge map of original image.
In the next step, scan lines are characterized in the
range of R
L
min
to R
L
max
where R
L
min
=(r
i
+ δ
1
+o f f set)
and R
L
max
=(R
L
min
+ δ
3
) for left portion of iris and R
R
min
to R
R
max
where R
R
min
=(r
i
+ δ
2
+o f f set) and R
R
max
=(R
R
min
+ δ
4
) for right portion of iris on the iris edge map,
where δ
1
and δ
2
are the same as explained in Sec-
tion 2.1.2. But values of δ
3
and δ
4
depend on visible
part of contact lens and are selected experimentally.
We can set o f f set ≥ 0 with δ
3
, δ
4
∈ [1, 10]. If δ
3
,
δ
4
are greater then 10, there is a possibility that an-
gle is shrinking as medial canthus or lateral canthus
are reached as shown in Figure 8(a) that can degrade
the accuracy of the proposed algorithm. These scan
lines are at angles ranging from θ
L
min
to θ
L
max
for left
portion of iris image and θ
R
min
to θ
R
max
for right portion
of iris with 1
◦
angular distance between two consecu-
tive scan lines. Figure 9 shows the objective region
secured by the scan lines. In Figure 9(a) and Fig-
ure 9(b), scan lines are extracted from left and right
portion of iris image respectively where as Figure 9(c)
shows the union of both.
(a) (b) (c)
Figure 9: Eyelashes and Eyelid limits.
Scan line over sclera, has very few non-zero
(edge) pixels. On the other side if the current scan
line intersects eyelashes or eyelids then with very high
probability non-zero (edge) pixels are found. For each
scan line at an angle θ, the number of non-zero pixels
is counted. If the count of non-zero pixels is greater
than threshold T then a value 1 is set to H(θ) array,
otherwise value 0 is stored in H(θ), where θ repre-
sents the number of scan lines. This process is re-
peated for all scan lines.
(a) Left portion (b) Right portion (c) Union of both
Figure 10: Occlusion estimation [Bottom
occ
,Top
occ
].
In order to estimate top and bottom occlusion
angles, two maximal (in terms of angular distance)
scan-lines between which all scan-lines are having
their edge pixels less than T (i.e not occluded) in
H(θ) are found. The lower index angle is called
Bottom
occ
which represents lower eyelid or eyelash
and the higher index angle is called Top
occ
which rep-
resents the upper eyelid or eyelashes. In Figure 10, a
lower red line indicates the Bottom
occ
and upper red
line indicates the Top
occ
.
Automated Soft Contact Lens Detection using Gradient based Information
361
2.3 Soft Contact Lens Detection (SCLD)
In this section we explain the feature extraction of the
iris image on the basis of which one can determines
whether it is a contact lens iris or no lens iris. The
detailed description of feature encoding is shown in
Figure 11. The proposed algorithm starts with denois-
ing the image. The motivation behind denoising iris
image is to reduce the noise & and preserve iris fea-
tures. Top-Hat filtering is applied on the iris image to
reduce uneven illumination effect because it reduces
the accuracy of the system.
(a)
Figure 11: SCLD using Gradient.
(a) No Lens (b) Top hat filtering result
(c) Soft Lens (d) Top hat filtering result
Figure 12: Top Hat Filtering Effect.
Non maximal-suppression (NMS) algorithm is ap-
plied to predict and remove false edges. Scan lines
are characterized with in the search range explained
in Section 2.1.2 and result is shown in Figure 13.
Angular Range for these scan lines is also explained
previously. The parameter CLD
min
, CLD
max
and
Bottom
occ
, Top
occ
are calculated separately for left
and right part of the iris.
Scan lines satisfying the condition are extracted
Figure 13: Scan Lines Arrangement.
(a) Left region (b) Right region (c) Union of both
Figure 14: Region after Occlusion Exclusion (No Lens).
(a) Left region (b) Right region (c) Union of both
Figure 15: Region after Occlusion Exclusion (Soft Lens).
from the considered region defined as: they must lie
with in the radial range CLD
min
to CLD
max
with an
angular range Bottom
occ
to Top
occ
as shown as in Fig-
ure 14 for no lens and in Figure 15 for soft lens.
Each scan line has high probability to intersect
contact lens boundary (if belonging to contact lens
class). The gradient of each pixel in a scan line is cal-
culated using Equation 1 and stored in an array G. In a
scan line we extract three absolute maximum gradient
pixels from G which are locally maximum with their
pixel intensity more than t. The value t is the pixel
intensity threshold ensuring that any value less than t,
must be excluded from contact lens boundary. This
process is repeated for each scan line. These three
maximum gradient pixels are considered because se-
lecting only one maximum gradient pixel may result
in an outlier selection, due to uneven illumination. In
Figures 16, 17, blue points indicate the selected max-
imum intensity pixels and red points indicate the out-
lier in scan lines for no lens & soft lens iris image
respectively. These points depend on images.
An outlier can be seen as an extremely high or low
value in the stored gradient pixels. For remaining gra-
dient pixels, we maintain three separate accumulator
(sum of gradient pixels) viz. G1, G2 and G3 for posi-
VISAPP 2016 - International Conference on Computer Vision Theory and Applications
362
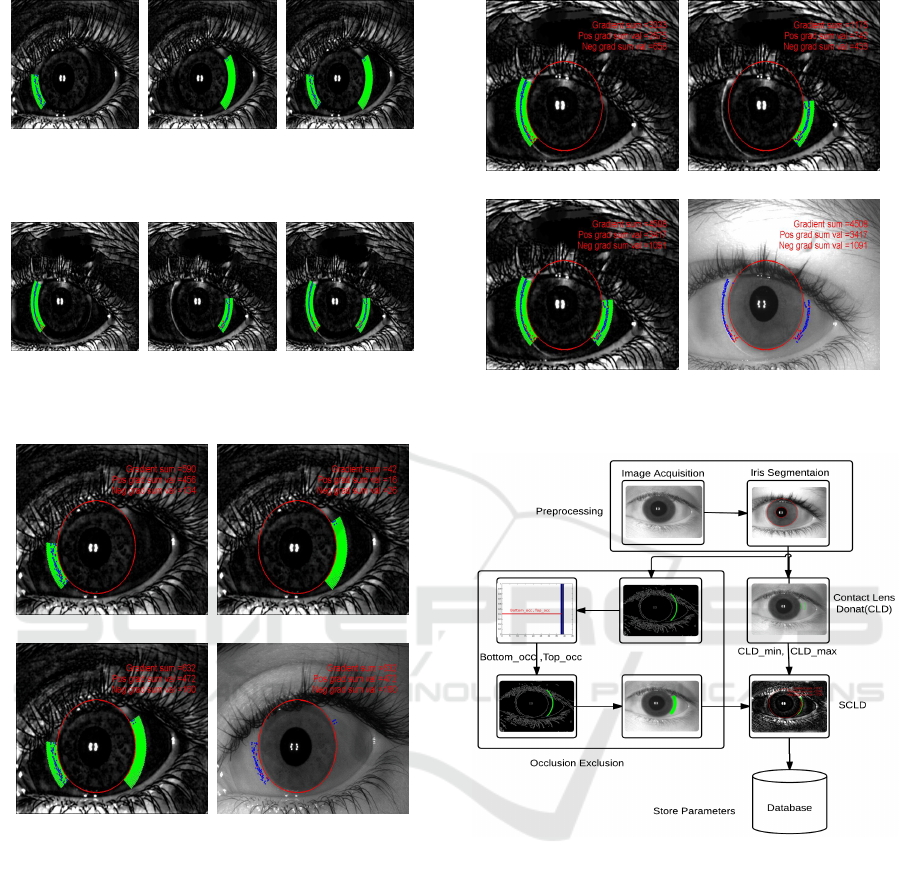
(a) Left region (b) Right region (c) Union of both
Figure 16: Largest Gradient Pixel (No Lens).
(a) Left region (b) Right region (c) Union of both
Figure 17: Largest Gradient pixel (Soft Contact Lens).
(a) Gradient sum left (b) Gradient sum right
(c) Gradient sum union (d) Original image
Figure 18: Gradient Pixel Sum (No Lens).
tive and negative and absolute gradient values. These
values form a feature vector that later has been used
to detect the contact lens. The positive, negative and
absolute gradient sums are marked in Figure 18 and
Figure 19 for no lens & soft lens iris image. The pro-
cess flow diagram to find out gradient sums from each
iris images is shown in Figure 20.
3 EXPERIMENTAL SECTION
Dataset: Three diverse publicly available database
are utilized to evaluate the performance of soft con-
tact lens detection system viz IITK , IIITD (Yadav
et al., 2014; Kohli et al., 2013) and UND Contact lens
(a) Gradient sum left (b) Gradient sum right
(c) Gradient sum union (d) Original image
Figure 19: Gradient Pixel Sum (Soft Lens).
Figure 20: Overview of SCLD algorithm using Gradient.
database. All databases are acquired using different
iris sensors like FA2, LG 4000. All three databases
contain iris images in three situations: (a) Iris image
with soft contact lens [’Y ’], (b) Iris image with color
lens [’C’], (c) Iris image with no lens [’N’]. In this
paper we have focused on soft contact lens detection
hence only [’N’,’Y ’] classes are taken into considera-
tion to test our system.
Database Division into Left and Right Eye: It
is observed that most of the databases are collected
by considering only single iris at a time using NIR
camera. While capturing left iris it is observed that
more light falls on right side of left iris. This infer
that left iris image has more visible lens part on its
right side as shown in Figure 21(a) and vice-versa as
shown in Figure 21(b). Another observation is that
Automated Soft Contact Lens Detection using Gradient based Information
363
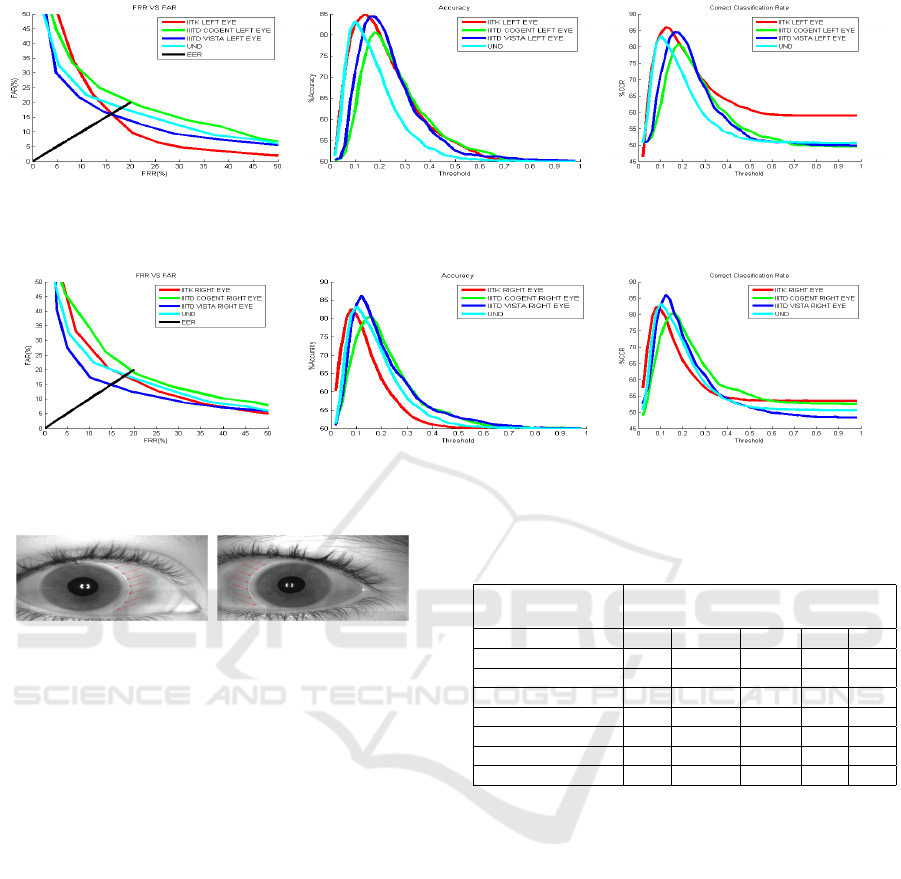
(a) Equal Error Rate (b) Accuracy (c) CCR
Figure 22: SCLD using Gradient Performance Comparison for various Left Eye Database.
(a) Equal Error Rate (b) Accuracy (c) CCR
Figure 23: SCLD using Gradient Performance Comparison on various Right Eye Database.
(a) Left Iris Image (b) Right Iris Image
Figure 21: Visibility of Soft Contact Lens.
θ range and r range depends on database but can be
fixed for any individual database.
Threshold Selection: Every dataset is divided
into two part with 66% being utilized for computing
feature value threshold and remaining for testing pur-
pose. In order to find the best suitable threshold over
this training data, all possible threshold in the range
{0 to 1} are tested. The threshold (say T
best
) at which
the system performance got maximized is used for
testing.
Prediction: The remaining 34% of the dataset
is used for testing. Again normalized feature values
are computed and compared with the above computed
threshold T
best
. If the calculated normalized feature
value is greater than or equal to the T
best
then that
sample is marked as lens, otherwise it is marked as
no lens.
The comparative performance analysis for the
proposed system in terms EER and accuracy for dif-
ferent databases is shown in Table2 and in Figures 22,
23. To best of our knowledge this can be considered
as an earliest work detecting only soft contact lens on
IIITD Vista, IIITD Cogent and UND database.
Table 2: CCR, Accuracy, FAR, FRR and EER across Vari-
ous databases.
Descriptor SCLD using Gradient
Database CCR Accuracy FAR FRR EER
Our Database Left Eye 85.92 84.99 15.41 16.52 15.96
Our Database Right Eye 82.40 82.62 20.59 14.15 17.37
IIITD Vista Left Eye 84.47 84.43 16.62 14.66 15.64
IIITD Vista Right Eye 86.05 85.86 13.11 17.63 15.37
IIITD Cogent Left Eye 80.52 80.70 18.89 21.66 20.28
IIITD Cogent Right Eye 84.99 80.46 18.4676 20.60 19.53
UND 83.24 83.31 17.28 19.60 18.44
4 LIMITATION OF THE SYSTEM
Some limitation that can also be seen as a future work
of the proposed algorithm are stated below.
[i] Defocused and Blurred Images: Defocus is
the variation in which a picture is essentially out of
core interest. This happens because of lens deviate
from accurate focus. There may also be blurring due
to defocus or movement of the lens. Some defocused
and blurred images are shown in Figure 24(a). Our
algorithm failed in such cases because lens edges are
not properly visible.
[ii] Shifted Lens toward Upper or Lower Eye-
lid: For data collection purposes, subject has to wear
contact lens. For individuals who have never used
contact lenses earlier found it difficult to wear it cor-
rectly and end up with shifted lens problem. In the
VISAPP 2016 - International Conference on Computer Vision Theory and Applications
364

(a) Defocused and Blurred (b) Shifted Lens (c) Sleepy Eye
Figure 24: Limitation of the system.
proposed algorithm we handle the lateral move i.e.
shifting towards lateral canthus and medial canthus.
However algorithm fails if shifting occurs toward up-
per or lower eyelid as shown in the Figure 24(b).
[iii] Sleepy Eye: In such cases contact lens
faintly visible causing algorithm to fail. Some images
are shown in the Figure 24(c).
REFERENCES
(2009). A Brief History of Contact Lenses. http://
www.contactlenses.org/timeline.htm. Accessed:
2015-04-27.
(2009). Contact lens. http://en.wikipedia.org/wiki/
Contact_lens. Accessed: 2015-04-27.
(2015). Soft Contact Lens Diameter. http:// softspecialedi-
tion.com/ base_curve. Accessed: 2015-5-13.
(2015). The Pupils. http://www.ncbi.nlm.nih.gov/books/
NBK381/. Accessed: 2015-06-12.
Badrinath, G., Nigam, A., and Gupta, P. (2011). An efficient
finger-knuckle-print based recognition system fusing
sift and surf matching scores. In Qing, S., Susilo, W.,
Wang, G., and Liu, D., editors, Information and Com-
munications Security, volume 7043 of Lecture Notes
in Computer Science, pages 374–387. Springer Berlin
Heidelberg.
Caroline, P. and Andre, M. (2002). The effect of corneal di-
ameter on soft lens fitting, part 2. Contact Lens Spec-
trum, 17(5):56–56.
Daugman, J. (1993). High confidence visual recognition of
persons by a test of statistical independence. IEEE
Transactions on Pattern Analysis and Machine Intel-
ligence, 15(11):1148–1161.
Erdogan, G. and Ross, A. (2013). Automatic detection of
non-cosmetic soft contact lenses in ocular images. In
SPIE Defense, Security, and Sensing, pages 87120C–
87120C. International Society for Optics and Photon-
ics.
Flom, L. and Safir, A. (1987). Iris recognition system. US
Patent 4,641,349.
Kohli, N., Yadav, D., Vatsa, M., and Singh, R. (2013). Re-
visiting iris recognition with color cosmetic contact
lenses. In Proceedings of International Conference
on Biometrics (ICB), pages 1–7. IEEE.
Kywe, W. W., Yoshida, M., and Murakami, K. (2006).
Contact lens extraction by using thermo-vision. In
Pattern Recognition, 2006. ICPR 2006. 18th Inter-
national Conference on, volume 4, pages 570–573.
IEEE.
Lovish, Nigam, A., Kumar, B., and Gupta, P. (2015). Ro-
bust contact lens detection using local phase quantiza-
tion and binary gabor pattern. In Computer Analysis
of Images and Patterns, volume 9256, pages 702–714.
Nigam, A. and Gupta, P. (2011). Finger knuckleprint based
recognition system using feature tracking. In Sun,
Z., Lai, J., Chen, X., and Tan, T., editors, Biometric
Recognition, volume 7098 of Lecture Notes in Com-
puter Science, pages 125–132. Springer Berlin Hei-
delberg.
Nigam, A. and Gupta, P. (2013a). Multimodal personal
authentication system fusing palmprint and knuck-
leprint. In Huang, D.-S., Gupta, P., Wang, L., and
Gromiha, M., editors, Emerging Intelligent Com-
puting Technology and Applications, volume 375 of
Communications in Computer and Information Sci-
ence, pages 188–193. Springer Berlin Heidelberg.
Nigam, A. and Gupta, P. (2013b). Quality assessment of
knuckleprint biometric images. In Image Processing
(ICIP), 2013 20th IEEE International Conference on,
pages 4205–4209.
Nigam, A. and Gupta, P. (2014a). Multimodal personal au-
thentication using iris and knuckleprint. In Huang,
D.-S., Bevilacqua, V., and Premaratne, P., editors, In-
telligent Computing Theory, volume 8588 of Lecture
Notes in Computer Science, pages 819–825. Springer
International Publishing.
Nigam, A. and Gupta, P. (2014b). Palmprint recognition
using geometrical and statistical constraints. In Babu,
B. V., Nagar, A., Deep, K., Pant, M., Bansal, J. C.,
Ray, K., and Gupta, U., editors, Proceedings of the
Second International Conference on Soft Computing
for Problem Solving (SocProS 2012), December 28-
30, 2012, volume 236 of Advances in Intelligent Sys-
tems and Computing, pages 1303–1315. Springer In-
dia.
Nigam, A. and Gupta, P. (2015). Designing an accurate
hand biometric based authentication system fusing
finger knuckleprint and palmprint. Neurocomputing,
151, Part 3:1120 – 1132.
Nigam, A., Kumar, B., Triyar, J., and Gupta, P. (2015). Iris
recognition using discrete cosine transform and rela-
tional measures. In Computer Analysis of Images and
Patterns, volume 9257, pages 506–517.
Nigam, A., T., A., and Gupta, P. (2013). Iris classification
based on its quality. In Huang, D.-S., Bevilacqua, V.,
Figueroa, J., and Premaratne, P., editors, Intelligent
Computing Theories, volume 7995 of Lecture Notes
in Computer Science, pages 443–452. Springer Berlin
Heidelberg.
Yadav, D., Kohli, N., Doyle, J., Singh, R., Vatsa, M., and
Bowyer, K. W. (2014). Unraveling the effect of tex-
tured contact lenses on iris recognition. IEEE Trans-
actions on Information Forensics and Security.
Automated Soft Contact Lens Detection using Gradient based Information
365
