
Facial Asymmetry Assessment from 3D Shape Sequences: The Clinical
Case of Facial Paralysis
Paul Audain Desrosiers
1
, Yasmine Bennis
2
, Boulbaba Ben Amor
1
, Mohamed Daoudi
1
and Pierre Guerreschi
2
1
Telecom Lille, CRIStAL (UMR CNRS 9189), Villeneuve d’Ascq, France
2
Service de Chirurgie Plastique Reconstructrice et Esth
´
etique, Universit
´
e Lille 2 Droit et Sant
´
e, Lille, France
Keywords:
4D Faces, Dense Scalar Fields, Face Asymmetry, Facial Paralysis, Dynamic Faces.
Abstract:
This paper addresses the problem of quantifying the facial asymmetry from dynamic 3D data. We investigate
here the role of 4D (i.e. 3D+time) data to reveal the amount of both static and dynamic asymmetry, in a clinical
use-case of facial paralysis. The final goal is to provide tools and solutions to clinicians for facial paralysis
assessment and monitoring, which can provide qualitative and quantitative evaluations. To this end, the ap-
proach proposed here consider 3D facial sequences and adopt a recently-developed Riemannian approach for
facial deformation analysis. After a preprocessing step, each frame of a given 3D sequence is approximated
by an indexed collection of elastic radial curves. Riemannian shape analysis of obtained curves and their sym-
metrical counterparts, both elements of the same shape space, give rise to a feature vector, called Dense Scalar
Fields (DSFs). The use of these DSFs reveals the amount of bilateral asymmetry of the face, when conveying
expressions. That is, given a 3D frame, it is first reflected with respect to the YZ-plane, then compared to the
obtained reflection using the DSFs. To exemplify the use of the proposed approach, a new dataset have been
collected (of patients) before and after injecting Botulinum Toxin (BT) in related facial muscles. Experimen-
tal results obtained on this dataset show that the proposed approach allows clinicians to evaluate the facial
asymmetry before and after the medical treatment.
1 INTRODUCTION
Human face is the most important non-verbal chan-
nel which allows to human beings to communicate
with their peers. Its dysfunction may causes discom-
fort among patients affected by facial paralysis. It oc-
curs in the case of partial or complete loss of func-
tioning of certain facial muscles. They are caused
by a lesion of the facial nerve for different reasons
– acute idiopathic facial paralysis (no cause) called a
Bell’s palsy, trauma, infection, chronic illness, tumor,
etc. One common medical treatment, widely used
since 1989 in surgery and aesthetic medicine (Clark
and Berris, 1989) (Filipo et al., 2012), is to inject
in the muscles of the face low doses of Botulinum
Toxin (BT) to handle compensatory over-activity of
the healthy muscles. The objective is to reduce the
degree of asymmetry in the facial dynamics (i.e the
facial temporal evolution) when talking or perform-
ing facial expressions. In general, the results of the
medical treatments are evaluated subjectively by the
clinicians after few weeks of each BT injection, so
no automated system exists to assist them conducting
their assessment. That is, the clinician ask the patient
to convey a specific facial expression or to read a text
and record him/her using a camera. The observation
of the video (recorded before the BT injection) and
the current dynamic allows the clinician to evaluate
the results and thus monitoring remaining treatments
(BT, surgery, etc.). To our knowledge, no automated
tools exist nowadays to allow clinicians quantitative
evaluation of the BT injection, in terms of facial dy-
namics.
1.1 Prior Work
Analyzing 3D facial sequences is still at the begin-
ning. The recent advances of 3D/4D sensors based
on two main technologies – stereo-photogrammetry
and structured-light – opened the doors to develop
approaches for analyzing static (3D) and dynamic
(4D) shapes. In particular, targeting the face recogni-
30
Desrosiers, P., Bennis, Y., Amor, B., Daoudi, M. and Guerreschi, P.
Facial Asymmetry Assessment from 3D Shape Sequences: The Clinical Case of Facial Paralysis.
DOI: 10.5220/0005721200300038
In Proceedings of the 11th Joint Conference on Computer Vision, Imaging and Computer Graphics Theory and Applications (VISIGRAPP 2016) - Volume 4: VISAPP, pages 30-38
ISBN: 978-989-758-175-5
Copyright
c
2016 by SCITEPRESS – Science and Technology Publications, Lda. All rights reserved

tion or expression classification problems, few groups
have recently collected new datasets (Sun and Yin,
2008)(Zhang et al., 2014)(Cosker et al., 2011)(Ma-
tuszewski et al., 2012) and have developed first tech-
niques (Sun et al., 2010)(Sandbach et al., 2012)(Ben
Amor et al., 2014) for expression recognition from 3D
sequences. These approaches have demonstrated the
role of 3D dynamic faces analysis to reveal deforma-
tions hidden in 2D videos. In fact, 2D images resulted
of the projection of the observed scene into a plane
(X-Y) which results in loosing the depth component
(Z). Using these 3D acquisition sensors allows to re-
cover the Z-coordinates and thus the use of a the com-
plete shape of the 3D face. Current literature is rich
of approaches for shape analysis of 3D and 4D faces.
However, only few studies have addressed the funda-
mental question of – How to quantify the amount of
bilateral facial asymmetry from the temporal evolu-
tion of 3D faces?
Earlier shape analysis studies are based on the de-
tection and tracking of 2D and 3D facial landmarks in
facial sequences. For instance, Al-Anezi et al. (Al-
Anezi et al., 2013) have proposed a new method for
automatic tracking of facial landmarks in 4D videos.
A set of 23 anthropometrics landmarks with no per-
manent ink are marked on the faces of 32 subjects
aged 18 to 35 years. The subjects are asked to per-
form a facial animation like maximal smile, lip purse,
cheek puff. They have concluded that an accurate
tracking solution facilitate the analysis of the dynamic
motion. Shujaat et al. (Shujaat et al., 2014) have pur-
sued the study conducted in (Al-Anezi et al., 2013)
and have developed a new method to quantify dy-
namic 3D facial animations, in order to character-
ize the dynamics of 3D lips movement in head, and
neck oncology patients before and after lower lip split
mandibulotomy. A dataset of 7 subjects aged 42-80
years old is collected. Moreover, a set of nine facials
soft tissue landmarks are manually annotated on the
first frame of each 3D sequence by an operator, and
then tracked automatically. Six landmarks are used to
analyze the lip motions, assessing of the magnitude,
and the three others to track the effect of the head mo-
tion, and to align all the frames into a common ref-
erence frame. They measured the feasibility of the
change in the magnitude, speed, and motion simi-
larity of facial animation. The results show that the
magnitude and the speed difference decreased after
the surgical operation for the smile and the lip purse,
while motion similarity shows a high score in the case
of lip purse animation. Recently, Wei et al. (Quan
et al., 2012) proposed a novel approach to analyze
the asymmetry of the face on 3D dynamic scan. A
data set which comes from the Hi4D-ADSIP database
is used, and allow them to make a comparison be-
tween stroke patients and healthy individuals. At first
sight, in each frame, the nose tip is determined, and
a sphere of radius r = 130 mm is centered at the nose
tip for segment of the 3D face. Then, with their pro-
posed method, they extracted the symmetry plan of
the 3D face. Thus, the asymmetry plan can be ex-
tracted directly from the symmetry plan by using the
original data and the mirrored data obtained by reflec-
tion across the symmetry plan. After matching the
original 3D face and its mirror with the help of ICP,
they calculated the Euclidean distance between each
point of the 3D original face and its mirror. From this,
they measured the higher asymmetry level of the 3D
face which based on the bigger value of the average
closest distance. They have concluded that, the pro-
posed method is able to measure the asymmetry of
the face, facial dysfunction, and the method is also
able to detect minor change in asymmetry which not
been observed by the clinician during examination.
1.2 Methodology and Paper
Organization
The main goal of this work is to propose a com-
prehensive and automated pipeline for efficient facial
asymmetry evaluation. Using a 3D sensor, several 3D
video acquisitions are recorded before and after clin-
ician’s intervention. A preprocessing step is then ap-
plied to each frame of the 3D videos including – holes
filling, smoothing, pose normalization, and nose tip
detection. On preprocessed 3D faces a mirror opera-
tion with respect to the YZ-plane is applied to produce
new meshes (i.e the left half the original face corre-
sponds to the right half of the mirrored face). Shape
analysis of the obtained faces (original mesh and its
mirror) allows alignment and accurate dense registra-
tion, leaded jointly. In particular, using the initial ve-
locity vector along the geodesic path connecting their
shapes (Ben Amor et al., 2014), one can quantify the
amount of deformations between them. As a result,
at each instant of the 3D video, a Dense Scalar Field
which reflects the facial asymmetry is computed. Fi-
nally, the extension of the previous step to the tempo-
ral domain allows quantifying the evolution of facial
asymmetry across the video. An experimental illus-
tration of the above-mentioned idea is reported where
a new dataset of the patient’s face before and after BT
injection is recorded.
The rest of the paper is organized as follows. In
section 2, we describe the clinical data used in this
study which consists of 3D facial sequences of pa-
tients recorded before and after the clinician’s inter-
vention. The Riemannian shape analysis approach
Facial Asymmetry Assessment from 3D Shape Sequences: The Clinical Case of Facial Paralysis
31

and its capability to quantify the amount of facial
asymmetry is presented in section 3. An experimental
illustration involving the clinical dataset is discussed
in section 4. In section 5 are drawn some concluding
remarks and future investigation.
2 DATASET DESCRIPTION AND
PREPROCESSING
Due to the novelty of the topic, we have conducted
with clinicians the acquisition of patients suffering
from facial paralysis. The patients are asked to per-
form some specific facial expressions in front of the
3D camera. These expressions have been dictated by
the clinicians.
2.1 4D Data Acquisition
In total five patients with facial paralysis have been
invited for two acquisition sessions, one time before
the BT injection and a second time after two weeks
of the injection. The participants have been asked to
convey three different expressions (1) normal smile,
(2) forced smile, and (3) raising-up the eyebrows. The
average duration of the recorded 3D videos is 4-6 sec-
onds with a total of 60 to 100 3D frames. In our ac-
quisition process, we have used the ARTEC MHT 3D
scanner
1
. This single-view 3D scanner allows cap-
turing 3D videos of 15 fps (frame per second), each
frame consists of about 5500 vertices, and the 3D res-
olution is 0.5 mm. To allow an optimal acquisition,
the participants are asked to sit in front of the camera
at a distance of about 80 cm to continuously focus on
a fixed point. In addition, we have recorded following
the same settings, 3D sequences of a healthy face (as
a control sample). Figure 1 illustrates a sequence of
3D facial surfaces obtained using the 3D sensor of a
patient’s face asked to exhibit a forced smile.
2.2 Pre-processing of 3D Frames
As mentioned before, the 3D sequences presents im-
perfections such as missing data (i.e holes in the
mesh), noise (i.e. spikes) and contain undesirable
parts (neck, clothes, hair, etc.). We applied the fol-
lowing pipeline in order to extract the informative part
of the face,
– Clean up the meshes by removing identical ver-
tices,
– Fill small holes on the mesh by interpolation,
1
http://www.artec3d.com/fr/hardware/artec-mht/
Figure 1: An example of 3D sequence of a patient’s face ex-
hibiting a forced (maximum) smile. The sequence follows
the evolution model neutral-onset-apex-offset-neutral.
– Detect the nose tip of each face on each frame,
– Crop the face, the nose tip is used to define a
sphere with a constant radius which serves to crop
the face region,
– Smooth the meshes using a Laplacian filter to re-
duce the noise,
– Apply a mirror operator on the 3D faces with re-
spect to the YZ-plan,
– Apply the ICP (Iterative Closest Point) algorithm
between the original 3D frame and the mirrored
3D frame for pose normalization.
An efficient implementation of this pipeline is de-
signed using filters of the VTK
2
library. This pre-
processing pipeline is applied to each 3D frame of the
3D video, separately. As a result, we obtain a 3D
animations of the 3D faces and their mirrored. The
next step is to extract radial curves and to quantify the
amount of asymmetry by comparing each 3D shapes
to their reflections.
The problem is turned to a comparison of 3D
(static) facial shapes, i.e. at each instant t, we pre-
processed the 3D face with its mirrored. To achieve
such comparison, one needs for an accurate registra-
tion algorithm which can handle the non-rigid defor-
mations (bending, stretching/compression) of the fa-
cial surfaces. The registration of vertices across 3D
faces is an important ingredient when studying their
shapes (we assume here an invariance to rigid motions
– translation, scaling and rotation). Specifically, in
comparing shapes of faces, it is important that similar
2
http://www.vtk.org
VISAPP 2016 - International Conference on Computer Vision Theory and Applications
32

biological parts are registered to each other, in partic-
ular the left and right halves of the face, when study-
ing the face asymmetry. Several methods have been
proposed in the literature as discussed above such as
the Non-rigid ICP algorithm (Cheng et al., 2015), the
Free Form Deformation (FFD) algorithm (Sandbach
et al., 2012) and the Thin-plate Spline (TPS) algo-
rithm (Fang et al., 2012). Most of these solutions try
to find an optimal registration between two 3D faces,
however, their cost functions which minimize the dis-
tance between 3D meshes is not a proper metric; it is
not even symmetric. That is, the optimal registration
of a 3D face F
1
to another 3D face F
2
may not be
the same as the registration of F
2
to F
1
. This makes
difficult to interpret the results (i.e. quantifying the di-
vergence between the compared 3D faces). The Rie-
mannian framework used in (Ben Amor et al., 2014)
for 4D facial expression analysis grounding on elastic
radial curves (i.e. an elastic metric is used (Srivastava
et al., 2011)) provides a nice physical interpretation
of measuring the facial deformations between curves
using a combination of stretching and bending. These
elastic deformations are captured by the Dense Scalar
Field (DSFs) features. Hence, the main motivation of
using a Riemannian approach is to perform registra-
tion that matches corresponding anatomical features,
and obtain deformation fields that are physically inter-
pretable. In the next section, we recall essential mate-
rials to compute the Dense Scalar Fields (DSFs) and
illustrates their used to quantify the amount of facial
asymmetry. Finally, we will make their extensions to
study dynamic 3D faces.
3 BILATERAL FACIAL
ASYMMETRY
Given a 3D facial sequence, our aim is to measure the
amount of bilateral symmetry at each time and extend
it to the temporal dimension. We will start by the first
case (i.e. static 3D face), the most common way to
quantify the asymmetry is to first detect the plane of
symmetry of the face (called also the mirror plane),
then apply registration algorithms as the well-know
Iterative Closest Point as proposed in (Quan et al.,
2012). Here, the most problematic step is to detect ac-
curately the mirror plane before comparing the shape
divergence between the two halves of the facial sur-
face. Quan et al. (Quan et al., 2012) consider the 3D
vertices of the face as a cloud of points in R
3
, they ap-
ply a Principal Component Analysis (PCA) to extract
its dominant direction, which corresponds to the mir-
ror plane. When this approach achieved good results
on ”normal” faces, it is problematic to use on faces
with paralysis. That is, in the latter, the plane location
may be far from the the nose tip, for example. A sec-
ond problem of this approach, is the use of the ICP al-
gorithm, which consider in its cost function only rigid
transformations (translation, scaling and rotation) and
a very basic optimization criteria based on the point-
to-point (or point-to-plane) distance. This makes dif-
ficult to achieve any physical interpretation of the re-
sults. In the case of facial paralysis, the registration
algorithm may register different anatomical parts on
the two halves of the 3D face.
According to the above-mentioned issues, we pro-
pose in this paper a different approach to measure
the bilateral facial asymmetry, when first avoiding the
mirror plane detection, and use a Riemannian shape
analysis framework developed recently (Ben Amor
et al., 2014) to achieve accurate registration. The ba-
sic idea is to approximate the facial surface by an in-
dexed (ordered) collection of radial curves, then con-
sider pairwise curves comparison, using a Rieman-
nian elastic metric which account for the stretching
and shrinking of the face. Before reaching this step,
we avoid the step of mirror plane detection by apply-
ing a simple mirroring to the original face according
to the YZ-plane, then align the two surfaces using the
ICP algorithm, and finally use the Riemannian ap-
proach to quantify the optimal deformation between
the 3D face and the mirrored face. To this end, we ex-
ploit the notion of geodesic (shortest path between the
facial surfaces) on the shape space that we will note
S
[0,2π]
, and we will detail later.
Let first note the facial curves emanating from the
nose tip and tracking directions dictated by an angle
α ∈ [0, 2π[. The obtained collection of curves pro-
vides, Figure 2, not only a nice approximation of the
face, but also impose on it a parametrization. That
is, considering the nose tip as an origin, each point
on the face is identified, in a unique way, by α the
index of the curve and k, the index of the point on
the curve. Based on this radial curves representation,
the problem of face-to-face registration is turned to
a pairwise-curves registration. Elastic shape analysis
of open and closed curves is a well-explored prob-
lem. An emerging solution using Riemannian geom-
etry have demonstrated convincing results, when the
problems of alignment and registration are leaded in
the same and unique step. Recently, Ben Amor et
al. (Ben Amor et al., 2014) have extended the geo-
metric framework of curves proposed by (Srivastava
et al., 2011) to facial surfaces. Using the SRVF repre-
sentation q
α
(t) of the facial curves β
α
(t), where α is
the curve index on the face, to form the shape space
S
[0,2π]
. As the shape space is a quotient space an
Hyper-sphere of the Hilbert space L
2
([0, 1], R
3
), the
Facial Asymmetry Assessment from 3D Shape Sequences: The Clinical Case of Facial Paralysis
33

geodesic path between two facial shapes is given by
the minor arc of the great circle of the Hyper-sphere.
Figure 2: Three views of the same collection of curves ex-
tracted to approximate a 3D facial shape. The point in red
represent the detected nose tip (origin of the radial curves).
To capture and model the deformations between
the 3D face and its mirror during different facial ex-
pressions, we pursued with the work of Ben Amor et
al. (Ben Amor et al., 2014) which have proposed to
represent the facial surface through a set of parame-
terized radial curves that originate from the tip of the
nose. Approximating the facial surface by an ordered
set of radial curves, which locally captures its shape
can be seen as a parameterization of the facial surface.
The mathematical setup for the shape theory offered
here comes from Hilbert space analysis.
A facial surface is represented by a collection of
radial curves and a Riemannian framework is used
to study shapes of these curves. We start by repre-
senting facial curves as absolutely continuous maps
from β : [0, 1] → R
3
and our goal is to analyze shapes
represented by these maps. The problem in study-
ing shapes using these maps directly is that they
change with re-parameterizations of curves. If γ is
a re-parameterization function (typically a diffeomor-
phism from [0, 1] to itself), then under the standard
L
2
norm, the quantity kβ
1
− β
2
k 6= kβ
1
◦ γ − β
2
◦ γk,
which is problematic. The solution comes from
choosing a Riemannian metric under which this in-
equality becomes equality and the ensuing analysis
simplifies. As described in (Srivastava et al., 2011),
we represent the facial curves using a new function q,
called the square-root velocity function (SRVF) (see
Eq. (1)). The advantage of using SRVF representa-
tion is that under this representation the elastic metric
becomes the standard L
2
metric and an identical re-
parameterization of curves preserves the L
2
norm of
between their SRVFs. The mapping from a curve β to
q is a bijection (up to a translation) and the space of
all SRVFs is the Hilbert space of all square-integrable
maps of the type q : [0, 1] → R
3
. This space under
the natural L
2
inner product is actually a vector space
and geodesics between points in this space are straight
lines.
With the proposed representation, a 3D facial sur-
face is approximated by an indexed collection of ra-
dial curves β
α
, where the index α denotes the angle
formed by the curve with respect to a reference radial
curve. In particular, the reference radial curve (i.e.,
the curve with α = 0) is chosen as oriented along the
vertical axis, while the other radial curves are sepa-
rated each other by a fixed angle and are ordered in a
clockwise manner.
Considering a generic radial curve β of the face,
it can be parameterized as β: I → R
3
, with I = [0, 1],
and mathematically represented through the square-
root velocity function (SRVF) (Joshi et al., 2007; Sri-
vastava et al., 2011), denoted by q(t), according to:
q(t) =
˙
β(t)
q
k
˙
β(t)k
, t ∈ [0, 1]. (1)
This specific representation has the advantage of cap-
turing the shape of the curve and makes the calcu-
lus simpler. Let us define the space of the SRVFs as
C = {q : I → R
3
, kqk = 1} ⊂ L
2
(I, R
3
), with k · k
indicating the L
2
norm. With the L
2
metric on its tan-
gent space, C becomes a Riemannian manifold. Ba-
sically, with this parametrization each radial curve is
represented on the manifold C by its SRVF. Accord-
ing to this, given the SRVFs q
1
and q
2
of two radial
curves, the shortest path ψ
∗
on the manifold C be-
tween q
1
and q
2
(called geodesic path) is a critical
point of the following energy function:
E(ψ) =
1
2
Z
||
˙
ψ(τ)||
2
dτ , (2)
R where ψ denotes a path on the manifold C between
q
1
and q
2
, τ is the parameter for traveling along the
path ψ,
˙
ψ ∈ T
ψ
(C ) is the tangent vector field on the
curve ψ ∈ C , and ||.|| denotes the L
2
norm on the tan-
gent space.
Since elements of C have a unit L
2
norm, C is
a hypersphere in the Hilbert space L
2
(I, R
3
). As
a consequence, the geodesic path between any two
points q
1
, q
2
∈ C is simply given by the minor arc of
the great circle connecting them on this hypersphere,
ψ
∗
: [0, 1] → C . This is given by:
ψ
∗
(τ) =
1
sin(θ)
(sin((1 − τ)θ)q
1
+ sin(θτ)q
2
) , (3)
where θ = d
C
(q
1
, q
2
) = cos
−1
(
h
q
1
, q
2
i
). We point out
that sin(θ) = 0, if the distance between the two curves
is zero, in other words q
1
= q
2
. In this case, for each
τ, ψ
∗
(τ) = q
1
= q
2
.
The tangent vector field on this geodesic is then
written as
dψ
∗
dτ
: [0, 1] → T
ψ
(C ), and is obtained by the
following equation:
dψ
∗
dτ
=
−θ
sin(θ)
(cos((1 − τ)θ)q
1
− cos(θτ)q
2
) . (4)
VISAPP 2016 - International Conference on Computer Vision Theory and Applications
34
Knowing that on geodesic path, the covariant deriva-
tive of its tangent vector field is equal to 0,
dψ
∗
dτ
is
parallel along the geodesic ψ
∗
and one can represent
it with
dψ
∗
dτ
|
τ=0
without any loss of information. Ac-
cordingly, Eq. (4) becomes:
dψ
∗
dτ
|
τ=0
=
θ
sin(θ)
(q
2
− cos(θ)q
1
) (θ 6= 0). (5)
Based on the above representation, we define a Dense
Scalar Field capable to capture deformations between
two corresponding radial curves β
1
α
and β
2
α
of two 3D
faces approximated by a collection of radial curves.
Let q and q
r
the SRVFs of the curves β and its re-
flection β
r
, respectively. ψ
∗
is the optimal path (the
geodesic) connecting q and q
r
and the angle θ is the
length of the geodesic which represents the geodesic
distance between q and q
r
. By integrating θ over all
α ∈ [0, 2π] gives rise to a scalar value which measures
the divergence between the face and its reflection. We
will use this measure later on in section 4 in our quan-
titative analysis. To quantify densely the divergence
between faces across a 3D video, Ben Amor et al.
(Ben Amor et al., 2014) proposed the Dense Scalar
Fields. Roughly speaking, it consists to compute the
initial velocity vector
dψ
∗
dτ
|
τ=0
along the geodesic ψ
∗
,
as the geodesic is by definition a constant speed curve
on the shape manifold in Eq. (5).
As describe above, the Dense Scalar Field (be-
tween a curve and its reflection) denotes the magni-
tude of
dψ
∗
dτ
|
τ=0
at each point of the curves.
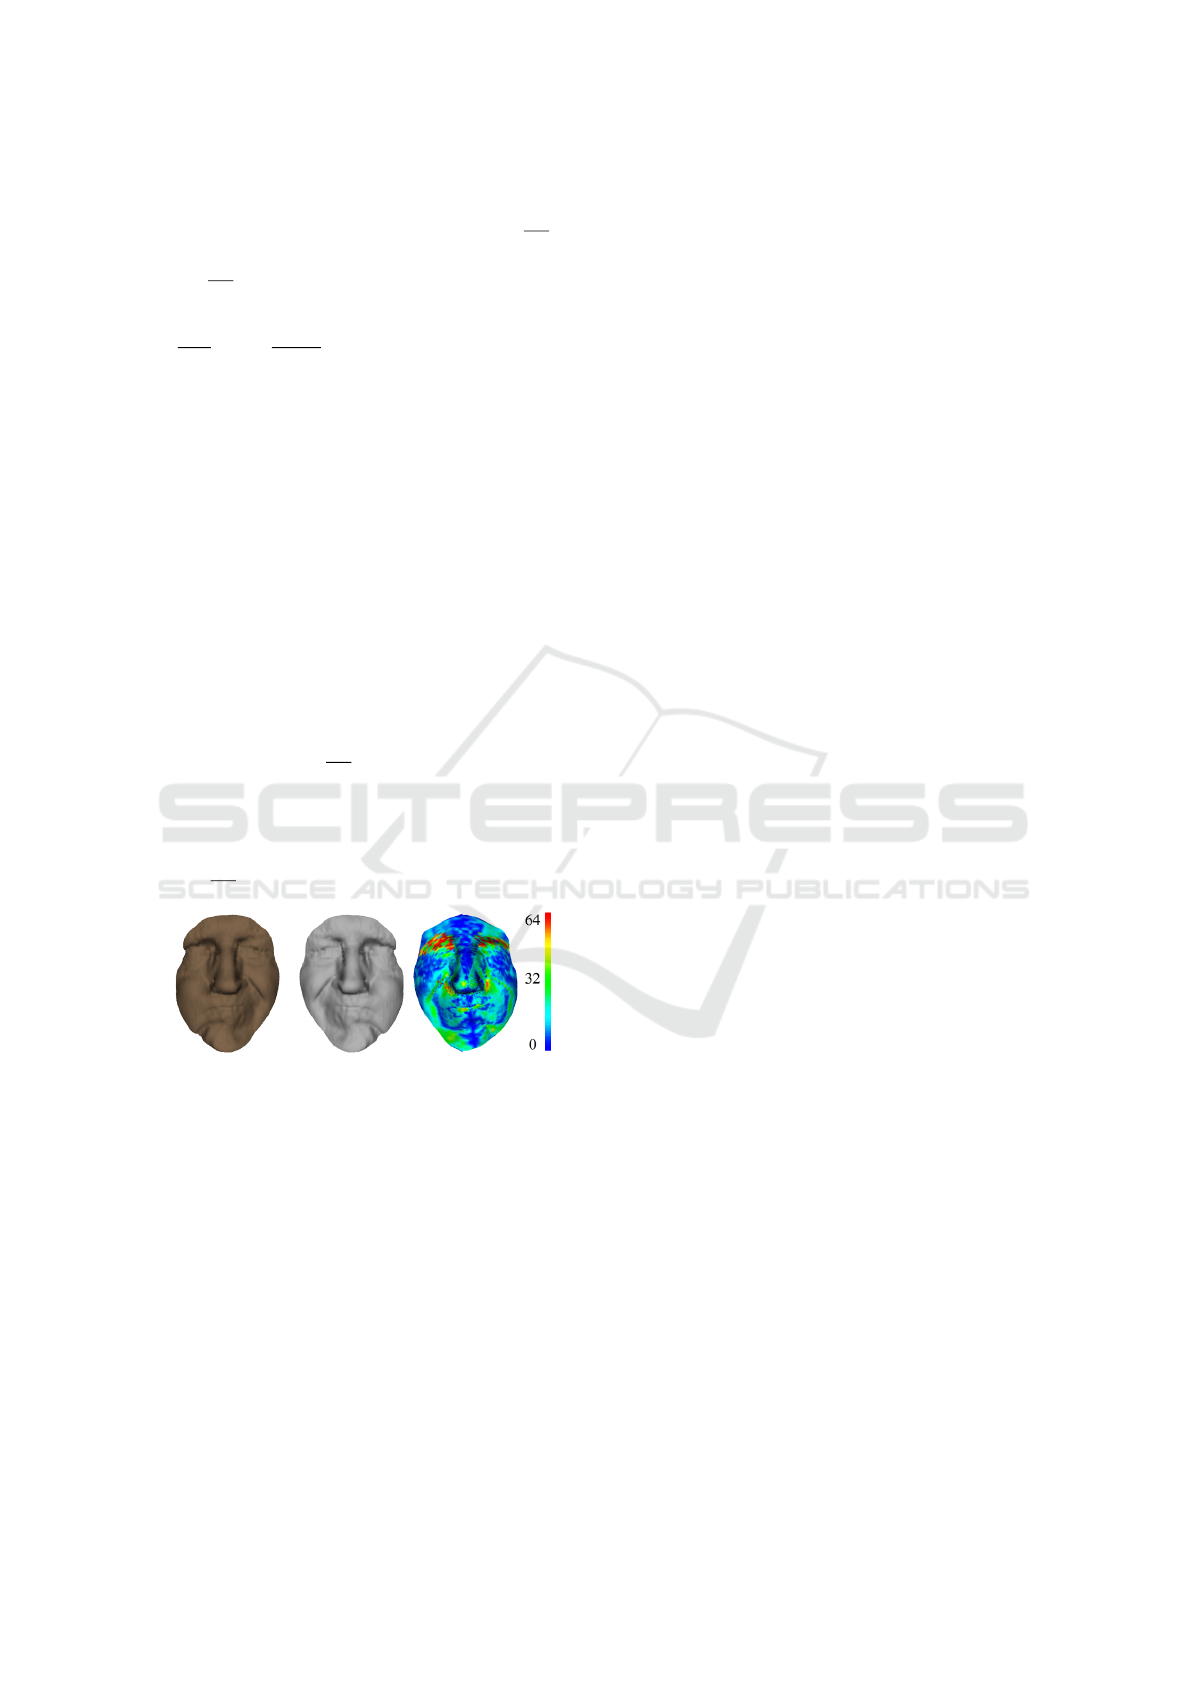
Figure 3: An example of computing the Dense Scalar Fields
(DSFs) on a patient’s face with paralysis. From left to right
(a) original 3D face, (2) 3D face after reflection, and (3) the
DSFs shown as a color map mapped on the original 3D face.
Figure 3 illustrates this idea, on the left the origi-
nal static 3D face, in the middle its reflection and on
the right the result of DSFs computation given as a
color map of 64 colors ranging from blue to red. In
this figure, cold colors represent the most symmet-
ric parts of the 3D face and warm colors highlight
the most asymmetric parts. Colors in between reflect
a scale of the amount of bilateral asymmetry of the
face. Compared to the 3D landmarks-based approach
adopted in (Shujaat et al., 2014), our approach pro-
vides dense measurements of the bilateral asymme-
try on the face. This could be of high importance for
clinicians to evaluate locally the bilateral asymmetry
of the face. This is because the BT injection is done
locally in some specific muscles.
The main motivation behind computing the shape
deviation between an arbitrary 3D facial shape and its
mirrored shape is to avoid the difficult task of mirror
plane detection. In fact, our approach allows to quan-
tify accurately the bilateral (left-right) face asymme-
try by (1) a fine alignment of the two shapes using
the ICP algorithm, then (2) compute the shape devia-
tion using elastic radial curves (i.e. computing DSFs).
Thus, the quantifying the bilateral asymmetry is inde-
pendent of any plane of symmetry. In particular, this
is suitable when working with paralyzed faces when
conveying expressions for whom the detection of a
plane of symmetry is not an easy task.
4 EXPERIMENTS AND
DISCUSSIONS
In this section we illustrate experimentally the use of
DSFs to quantify the bilateral symmetry of the face.
To this end, we used some samples taken from the
new dataset described in section 2. To conduct these
experiments, given a 3D sequence of the face, each
frame is first reflected then aligned to the original
face. As a final step, the DSFs are calculated between
the original and the reflected (aligned) shapes. We
present in the following four main experiments which
involve (1) Neural states pre- and post-operative of a
patient’s face; (2) Smiling faces (natural) in pre- and
post-operative; (3) Forced smiling in pre- and post-
operative; and (4) Eyebrows raised in pre- and post-
operative. In the following, we report also quantita-
tive and qualitative results on a control subject’s face
(i.e. normal or healthy subject’s face). In these ex-
periments, the facial surfaces are approximated with
a total of 100 radial curves, each consists of 50 points,
in total each DSF vector contains 5000 scalar points.
1. Neutral State – in this experiment, we simply
restrict our study to a static neutral face. Thus, a sin-
gle 3D surface is considered for the patient’s face be-
fore and after the BT injection. Figure 4 illustrates the
DSFs computed to capture densely the degree of bi-
lateral symmetry on the 3D face. It is quite clear from
this figure that only minors changes are shown when
comparing the pre- and the post-operative asymmetry
results. In contrast, a difference exists when compar-
ing with the asymmetry of a control healthy face. We
can note also that the face is not perfectly symmetric
(see third row of Figure 4, and the acquisition pro-
cess may cause some aberrant depth calculations, in
particular in the eyes regions.
Facial Asymmetry Assessment from 3D Shape Sequences: The Clinical Case of Facial Paralysis
35
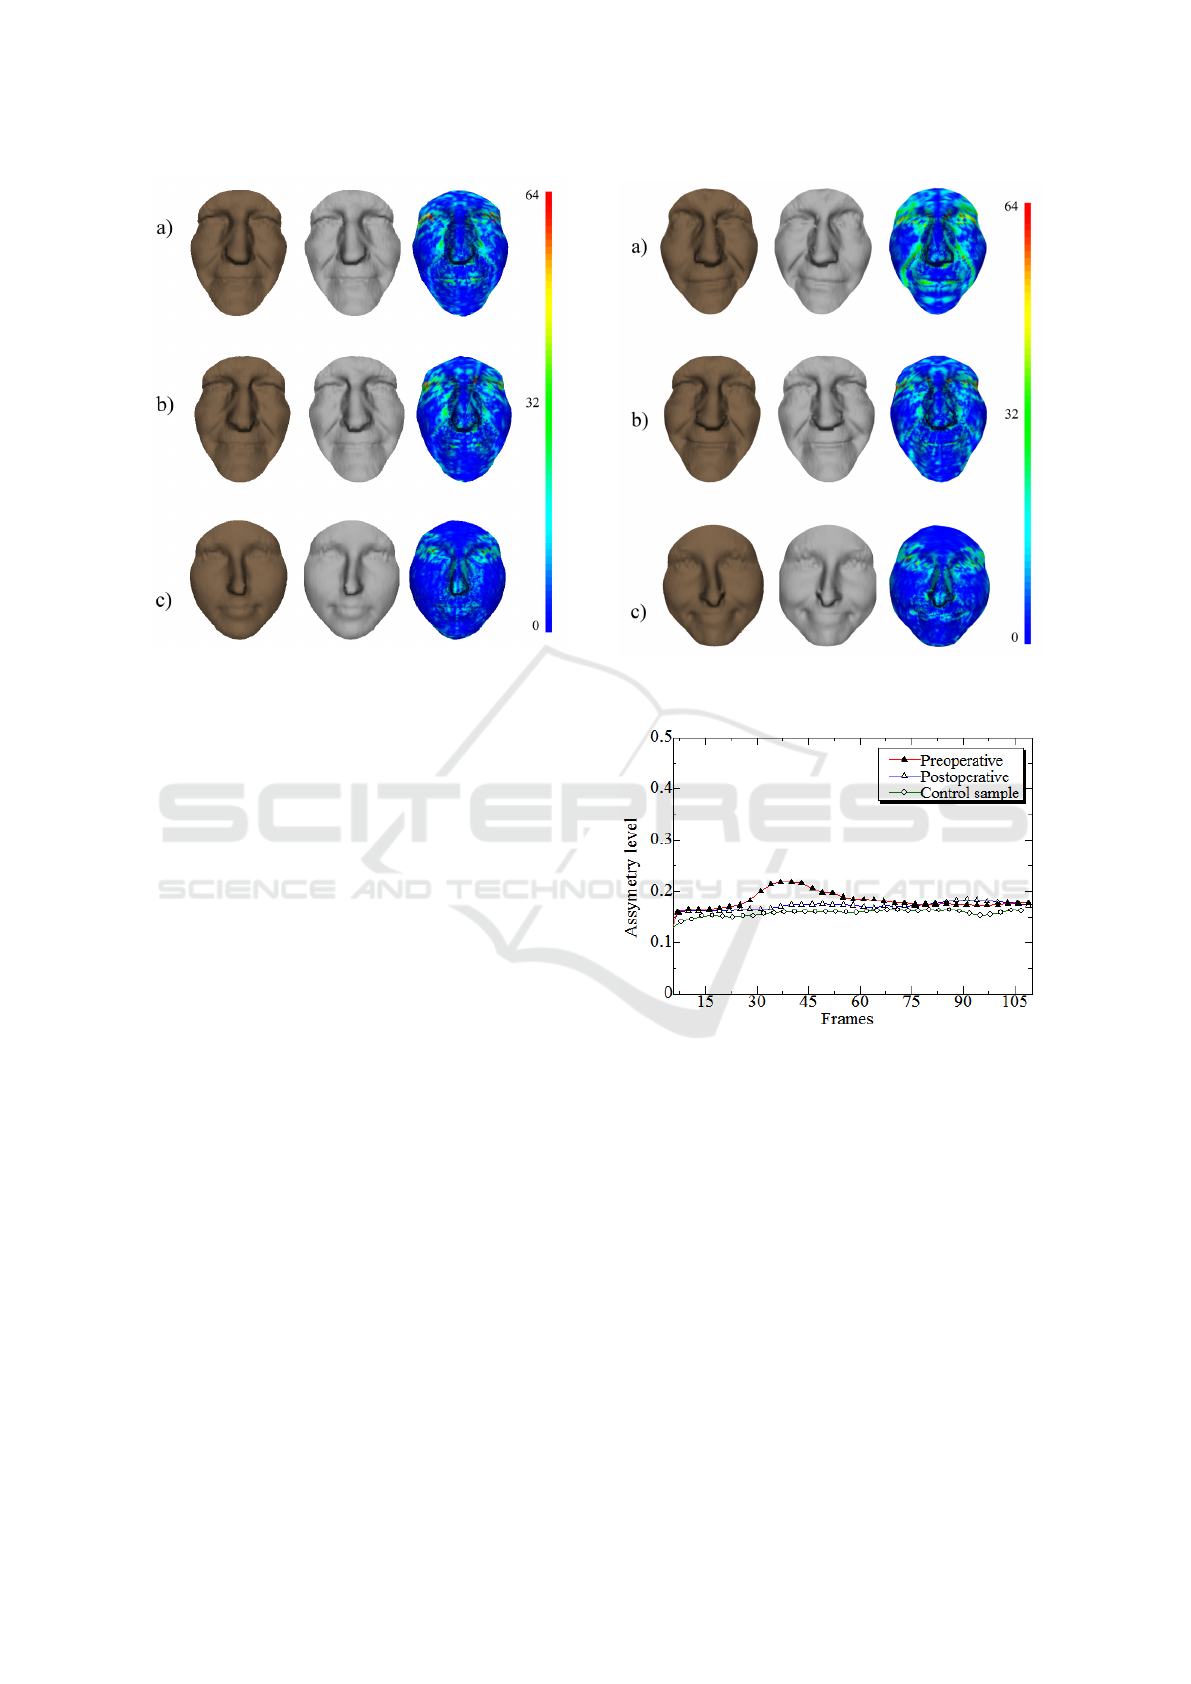
Figure 4: From left to right, the original shape, its reflec-
tion, and the bilateral asymmetry mapped into the reflection
shape. From top to bottom, DSFs on (a) pre-operative, (b)
post-operative , and (c) healthy subject’s faces.
From this first experiment, its is important that the
patient convey a facial expression to allow in-depth
analysis of the results.
2. Smiling – in this experiment, the patient is
asked to perform a natural smile. In Figure 5 we re-
port the degree of asymmetry for the apex (maximum
expression) of the smile. Compared to the previous
experiment (Figure 4) the DSFs reveal the difference,
in terms of asymmetry, between the pre-operative and
the post-operative result. Looking to the first two
rows of Figure 5, one can note an improvement of
facial symmetry after the BT injection on the same
patient. This can be seen in the surface of the blue
areas in the two DSFs. It is clear that the amount of
asymmetry is reduced along the Zygomaticus muscle.
We recall that the post-operative 3D acquisitions hap-
pened 2 weeks after the BT injection.
The bilateral asymmetry is evaluated at each
frame of the 3D video, we can note here report the
DSFs color map along the 3D video, however, we re-
port in Figure 6, the geodesic distance (global devi-
ation value) between the facial shape and its reflec-
tion. From this graph, we note a decrease of the facial
asymmetry when the expression happened in the tem-
poral segment between the frames 28 and 60.
This graph showed clearly the importance of con-
sidering the temporal evolution of the facial 3D shape
in stead of the static one. When comparing the post-
operative results with the healthy face (curves in red
and green) in Figure 6, one can note the efficiency of
Figure 5: Natural smiling experiment (a) pre-operative, (b)
post-operative and (c) healthy subject.
Figure 6: Degree of asymmetry across the video for the nat-
ural smiling experiment.
the BT injection to symmetrizing the facial shape and
its temporal evolution. However, what happen if the
expression is more prominent than a natural smile?
3. Forced Smiling – in response of the previous
question, the patients are asked to convey a forced
(maximum) smile. Then the same pipeline is applied
as previously.
From Figure 7, one can establish the same con-
clusions than in the previous experiment. That is the
degree of asymmetry of static and dynamic faces de-
creases after the BT injection. It can be seen from
this graph in Figure 8 that during the time-interval
between frames 14 to the end, when the expression
happened the amount of bilateral asymmetry before
the injection is higher (red curve) than after. The blue
VISAPP 2016 - International Conference on Computer Vision Theory and Applications
36
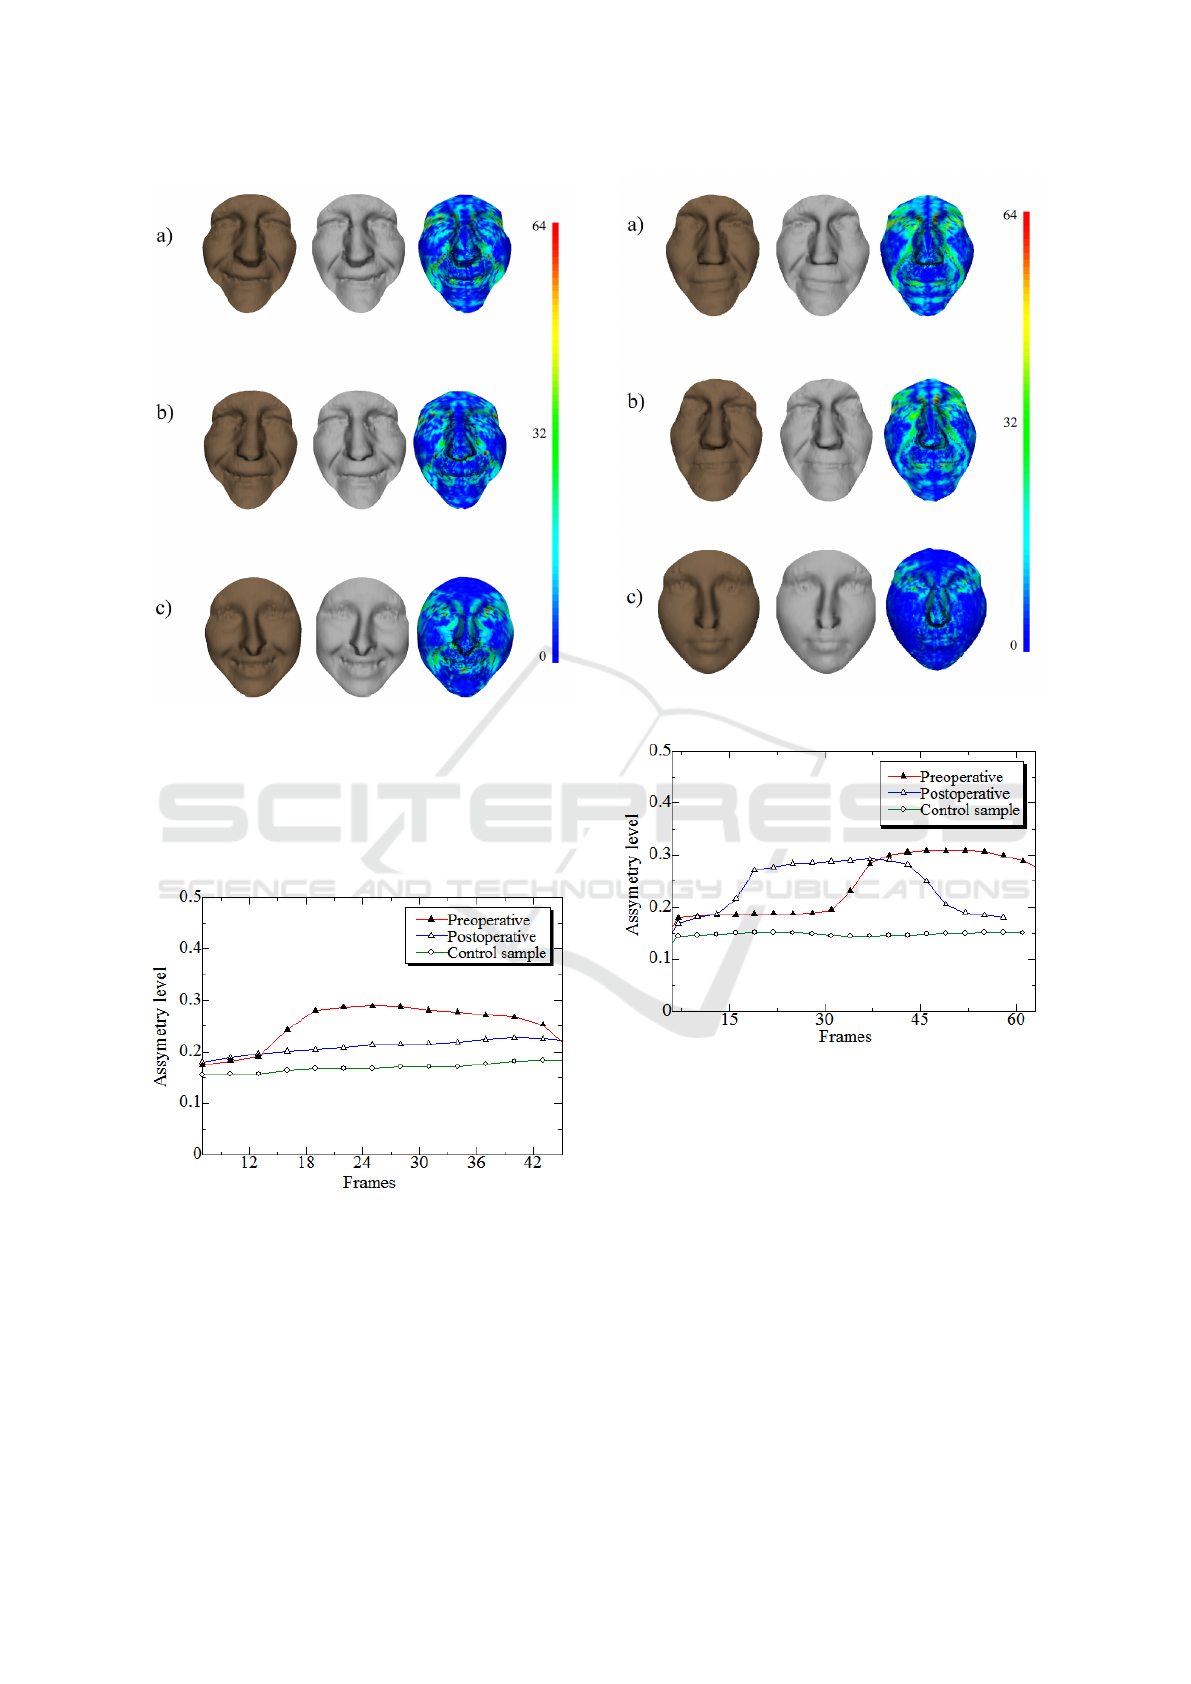
Figure 7: Forced (maximum) smiling experiment.
curve (after the BT injection) is always higher than the
green one (healthy subject). This could be explained
by the fact that healthy face taken is our experiments
is younger than the patient’s face.
Figure 8: Forced smiling in the experiment.
4. Raising-up the Eyebrows – in this experiment,
the patients are asked to raised up his eyebrows. From
figure 9, one can note again that the amounts of the
asymmetry before and after the BT injection are com-
parable. This is mainly due to the fact that the BT in-
jection is concentrated only on the zygomaticus mus-
cles and the muscles related to the eyebrows move-
ments (i.e. the corrugator muscle) do not received any
treatments. This result is also confirmed with the con-
Figure 9: Raising-up the eyebrows experiment.
Figure 10: Asymmetry along time for the raising-up the
eyebrows experiment.
trol sample, the amount of asymmetry is huge in the
patient’s face compared to the normal face.
The graph reported in Figure 10 confirm this ob-
servation. We note here a shift in the time interval
which corresponds to different starting and ending
time of the expression performed before and after re-
ceiving the treatments.
In the table 1, we present the amount of the asym-
metry level measured in each 3D video sequence.
We can observe that, in the the pre-operative (pre-
op) case, the asymmetry level is higher than the post-
operative (post-op) case, and the control sample (cs)
has the lower asymmetry level during all facial ex-
pressions.
Facial Asymmetry Assessment from 3D Shape Sequences: The Clinical Case of Facial Paralysis
37

Table 1: Maximum asymmetry level in each 3D video.
Facial Expression pre-op post-op cs
Smiling 0.218 0.173 0.159
Force smiling 0.288 0.227 0.182
Raise up the eyebrows 0.308 0.291 0.146
5 CONCLUSIONS
In this paper we have proposed a new technique to
quantify facial asymmetry from 4D facial data. The
main ingredient of this approach is the accommoda-
tion of the recently-developed Dense Scalar Fields
(Ben Amor et al., 2014) to compare a given face with
its reflection and achieve a vertex-to-vertex registra-
tion in order to accurately measure the amount of
asymmetry in the face. A new dataset of five pa-
tients has been collected in clinical conditions. We
have demonstrated using the collected 3D dynamic
sequences the usefulness of the proposed methodol-
ogy. In particular, the comparison of the facial asym-
metry by using DSF features before and after the BT’s
injection reveals shows that the proposed approach is
a promising solution. This work provides a quanti-
tative tools to the clinicians in order to evaluate the
treatment.
REFERENCES
Al-Anezi, T., Khambay, B., Peng, M., O’Leary, E., Ju, X.,
and Ayoub, A. (2013). A new method for automatic
tracking of facial landmarks in 3d motion captured im-
ages (4d). International Journal of Oral and Maxillo-
facial Surgery, 42(1):9 – 18.
Ben Amor, B., Drira, H., Berretti, S., Daoudi, M., and Sri-
vastava, A. (2014). 4-d facial expression recognition
by learning geometric deformations. IEEE T. Cyber-
netics, 44(12):2443–2457.
Cheng, S., Marras, I., Zafeiriou, S., and Pantic, M. (2015).
Active nonrigid ICP algorithm. In 11th IEEE Interna-
tional Conference and Workshops on Automatic Face
and Gesture Recognition, FG 2015, Ljubljana, Slove-
nia, May 4-8, 2015, pages 1–8.
Clark, R. and Berris, C. (1989). Botulinum toxin: a treat-
ment for facial asymmetry caused by facial nerve
paralysis. Plast Reconstr Surg, 84(2):353—5.
Cosker, D., Krumhuber, E., and Hilton, A. (2011). A facs
valid 3D dynamic action unit database with applica-
tions to 3D dynamic morphable facial modeling. In
Int. Conf. on Computer Vision (ICCV), pages 2296–
2303.
Fang, T., Zhao, X., Ocegueda, O., Shah, S. K., and Kaka-
diaris, I. A. (2012). 3d/4d facial expression analysis:
An advanced annotated face model approach. Image
and Vision Computing, 30(10):738–749.
Filipo, R., Spahiu, I., Covelli, E., Nicastri, M., and Bertoli,
G. (2012). Botulinum toxin in the treatment of fa-
cial synkinesis and hyperkinesis. The Laryngoscope,
122(2):266–70.
Joshi, S., Klassen, E., Srivastava, A., and Jermyn, I. (2007).
A novel representation for Riemannian analysis of
elastic curves in R
n
. In Proc. IEEE Conf. on Com-
puter Vision and Pattern Recognition, pages 1063–
6919, Minneapolis, MN.
Matuszewski, B., Quan, W., Shark, L.-k., McLoughlin, A.,
Lightbody, C., Emsley, H., and Watkins, C. (2012).
Hi4d-adsip 3D dynamic facial articulation database.
Image and Vision Computing, 30(10).
Quan, W., Matuszewski, B. J., and Shark, L. (2012). Fa-
cial asymmetry analysis based on 3-d dynamic scans.
In Proceedings of the IEEE International Conference
on Systems, Man, and Cybernetics, SMC 2012, Seoul,
Korea (South), October 14-17, 2012, pages 2676–
2681.
Sandbach, G., Zafeiriou, S., Pantic, M., and Rueckert, D.
(2012). Recognition of 3D facial expression dynam-
ics. Image and Vision Computing, 30(10):762–773.
Shujaat, S., Khambay, B., Ju, X., Devine, J., McMahon,
J., Wales, C., and Ayoub, A. (2014). The clinical ap-
plication of three-dimensional motion capture (4d): a
novel approach to quantify the dynamics of facial an-
imations. International Journal of Oral and Maxillo-
facial Surgery, 43(7):907 – 916.
Srivastava, A., Klassen, E., Joshi, S. H., and Jermyn, I. H.
(2011). Shape analysis of elastic curves in euclidean
spaces. IEEE Trans. Pattern Anal. Mach. Intell.,
33(7):1415–1428.
Sun, Y., Chen, X., Rosato, M. J., and Yin, L. (2010).
Tracking vertex flow and model adaptation for three-
dimensional spatiotemporal face analysis. IEEE
Transactions on Systems, Man, and Cybernetics, Part
A, 40(3):461–474.
Sun, Y. and Yin, L. (2008). Facial expression recognition
based on 3d dynamic range model sequences. In Pro-
ceedings of the 10th European Conference on Com-
puter Vision: Part II, ECCV ’08, pages 58–71.
Zhang, X., Yin, L., Cohn, J. F., Canavan, S., Reale, M.,
Horowitz, A., Liu, P., and Girard, J. M. (2014). Bp4d-
spontaneous: a high-resolution spontaneous 3D dy-
namic facial expression database. Image and Vision
Computing, 32(10):692 – 706.
VISAPP 2016 - International Conference on Computer Vision Theory and Applications
38
