Lane-level Positioning based on 3D Tracking Path of Traffic Signs
Sung-ju Kim and Soon-Yong Park
School of Computer Science & Engineering, Kyungpook National University, Daegu, South Korea
Keywords:
Lane-level Vehicle Positioning, Ego-lane Detection, ADAS, Autonomous Driving, Driver Assistant, SVM,
Stereo Matching, Traffic Sign Detection.
Abstract:
Lane-level vehicle positioning is an important task for enhancing the accuracy of in-vehicle navigation sys-
tems and the safety of autonomous vehicles. GPS (Global Positioning System) or DGPS (Differential GPS)
techniques are generally used in lane-level poisoning systems, which only provide an accuracy level up to 2-3
m. In this paper, we introduce a vision based lane-level positioning technique that provides more accurate
prediction results. The proposed method predicts the current driving lane of the vehicle by tracking the 3D
location of the traffic signs that are in the side-way of the road using a stereo camera. Several experiments are
conducted to analyse the feasibility of the proposed method in driving lane level prediction. According to the
experimental results, the proposed method could achieve 90.9% accuracy.
1 INTRODUCTION
Lane-level positioning is a technique that finds the in-
dex of the driving lane of a vehicle. It is an impor-
tant technique in the field of autonomous driving and
Advanced Driver Assistant Systems (ADAS). Know-
ing the position of a vehicle with the lane-level accu-
racy, advanced navigation services can be provided.
For example, a current in-vehicle navigation platform
provides simple directions to the destination. Due to
the limited accuracy of the GPS signal, the current
navigation platform provides only the road-level po-
sition of the vehicle. By the way, if there is a tech-
nique of lane-level positioning, more advanced ser-
vices can be provided. For example, the navigation
platform knows in which lane the vehicle is driving.
If the vehicle is not in the correct lane of the direction,
the platform can provide a warning signal to the driver
and suggest a correct lane. Another service can be ap-
plied to an autonomous driving system. By knowing
the lane-level position of the vehicle, the autonomous
driving system can drivethe vehicle to the correct lane
for the destination.
In the previous work, various techniques have
been employed for lane-level positioning. There are
promising systems that predict the lane-level position
by obtaining the location of the driving car using ex-
pensive high-precision GPS and digital map informa-
tion(Du et al., 2004; Du and Barth, 2008). Techniques
based on wireless network communication between
vehicles are also used to determine the lane-level po-
sition(Dao et al., 2007). In (K¨uhnl et al., 2012;
Kuhnl et al., 2013), the authors proposed a lane-level
positioning technique, which extract SPRAY(SPatial
RAY) features at lane marking and classify the driv-
ing lane with GentleBoost. However, the accuracy is
approximately 15 m for GPS-based systems and 2-3
m for DGPS-based systems, which is not enough for
predicting the vehicle position in lane-level. Further-
more, the systems based on vehicle to vehicle com-
munication networks require partner vehicles and will
60
60
60
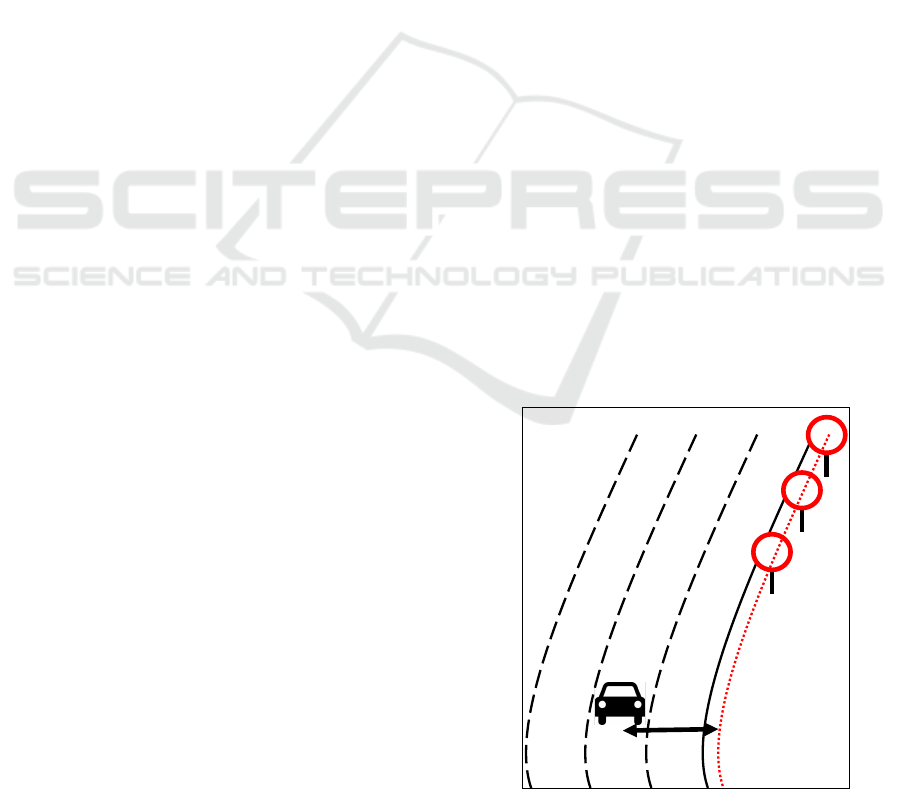
Figure 1: Lane-level vehicle positioning using path of traffic
signs.
644
Kim, S-j. and Park, S-Y.
Lane-level Positioning based on 3D Tracking Path of Traffic Signs.
DOI: 10.5220/0005721106420648
In Proceedings of the 11th Joint Conference on Computer Vision, Imaging and Computer Graphics Theory and Applications (VISIGRAPP 2016) - Volume 3: VISAPP, pages 644-650
ISBN: 978-989-758-175-5
Copyright
c
2016 by SCITEPRESS – Science and Technology Publications, Lda. All rights reserved
not work accurately in rural areas.
Therefore, this paper proposes a more accurate
and standalone method offering promising result us-
ing stereo vision techniques. The proposed method
utilizes the 3D information of the traffic signs, which
are tracked by a stereo camera. Traffic sign detec-
tion, stereo matching, and lane-level positioning are
the three main stages of the proposed method. Sec-
tion 2 first gives an overview of the proposed method
and then provides a detail explanation of each stage;
traffic sign detection, tracking, stereo matching, and
lane-level positioning. Experimental results are de-
scribed in Section 3, and the conclusions and future
works are included in Section 4.
2 LANE-LEVEL POSITIONING
In this paper, we present a lane-level positioning
method using a stereo camera. Most of the traffic
signs are located between the side-way and the driv-
ing lane as in Figure 1. We can use the information on
traffic sign locations to determine the current lane of
the vehicle. The system consists of four main stages;
traffic sign detection, tracking, stereo matching and
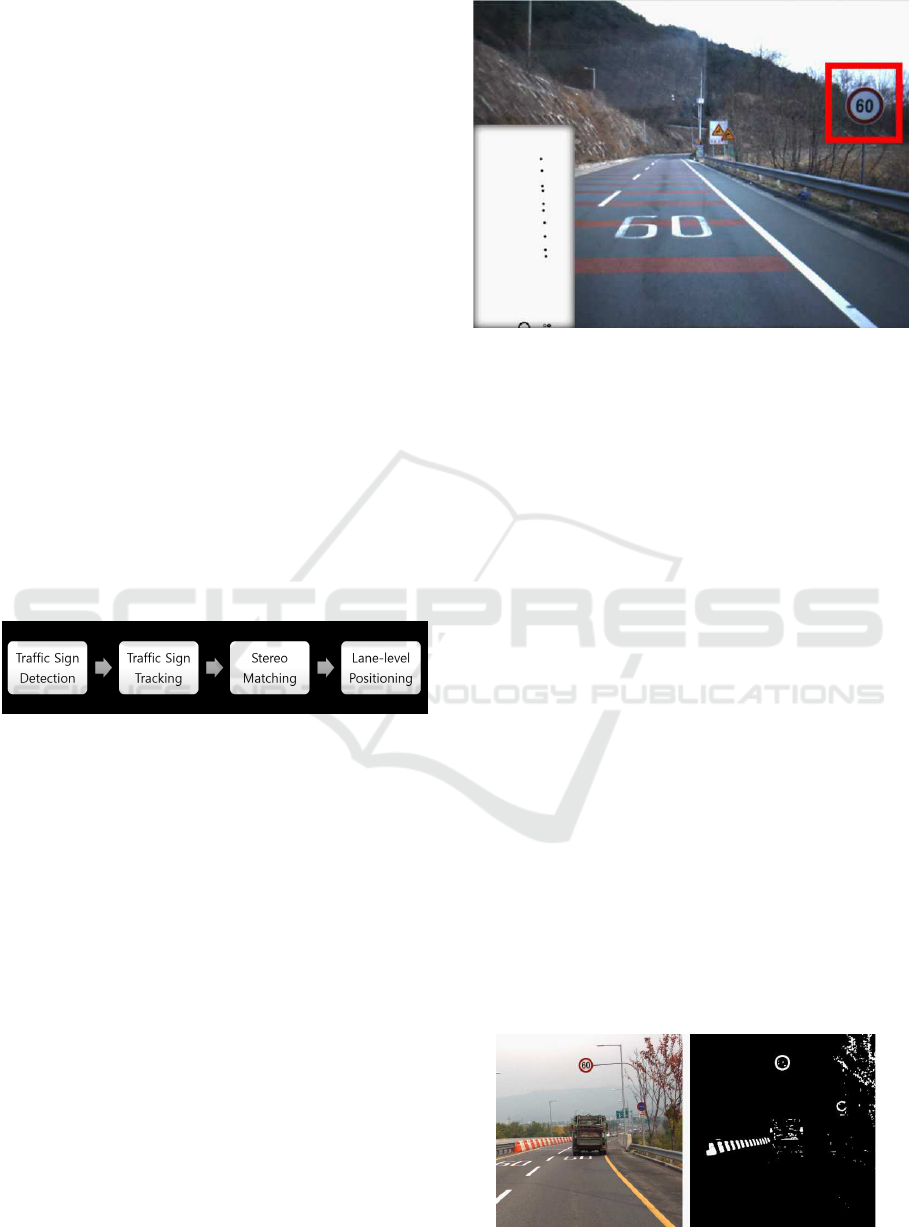
lane-level positioning (Figure 2).
Figure 2: Flow chart of the proposed vehicle lane-level po-
sitioning system.
2.1 Traffic Sign Detection
The proposed system determines the lane-level posi-
tion using 3D path of the traffic signs. Therefore, the
first step of the proposed system is detecting traffic
sign. The traffic sign detection process consists of two
parts; detecting the traffic sign candidates and classi-
fication using machine learning.
Detecting traffic signs by searching through the
whole image is very time-consuming. Therefore, in
the proposed method, we first extract few convincing
traffic sign candidates from the input image. There
are promising methods, which can be used to extract
the traffic sign candidates, such as binarization with
red color (Maldonado-Basc´on et al., 2007; Bahlmann
et al., 2005; De La Escalera et al., 1997) and using
geometrical features of the traffic signs (Bahlmann
et al., 2005; Garcia-Garrido et al., 2006; Garc´ıa-
Garrido et al., 2005). In this papers, binarization with
red color used to define traffic sign candidates. To
Figure 3: Generating path of traffic signs with detection,
tracking and calculation 3D location of it.
detect the red boundary of the traffic signs, we first
converted the input images to HSV (Hue, Saturation,
Value) color space and defined appropriate threshold
values for each channel. Then these threshold values
are used to make a binary image by applying thresh-
olding. A connected component labeling method is
used to connect the red pixels and generate clusters.
However, not all clusters are the traffic sign. The
clusters are the candidates of the traffic sign. To
determine the traffic sign, machine learning meth-
ods which like neural network or SVM are gener-
ally used(Maldonado-Basc´on et al., 2007; Bahlmann
et al., 2005; De La Escalera et al., 1997; Garcia-
Garrido et al., 2006; Garc´ıa-Garrido et al., 2005).
Deep learning technique which as neural network
based methods are popular recently but the deep
learning technique needs tons of images as 10 thou-
sand or more. However,this paper detects traffic signs
in Korea, and there is no open traffic sign database.
Hence, it is hard to obtain enough amount of traf-
fic sign images to apply deep learning technique.
General backpropagation algorithm in neural network
method also easily fall in local minima, when there
doesn’t exist enough amount of training data. How-
ever, SVM always finds global minima (Antkowiak,
2006; Burges, 1998). Therefore, proposed system
uses SVM.
Figure 4: Binarization with red color.
Lane-level Positioning based on 3D Tracking Path of Traffic Signs
645
Figure 5: Extract candidates in binarization image.
Abovementioned, there is no open traffic sign
database in Korea. Therefore, the used database was
formed with our lab. Traffic signs are consist of 3
types geometrically; circle, triangle, invert triangle. If
putting the 3 types of traffic sign to one positive class,
then it’s hard to find hyperplane which have maxi-
mal margin between positive and negative classes be-
cause variation of the boundary of traffic sign is too
large. Therefore, to train SVM appropriate, we de-
signed 3 positive classes; circle, triangle, invert trian-
gle classes {Class
circle
, Class
triangle
, Class
invtriangle
}.
Multi-classification method, ’one versus all’, are
used to determine traffic sign. Eventually, traffic
sign detection SVM is trained with positive 3 class
{Class
circle
, Class
triangle
, Class
invtriangle
} and negative
class {Class
negative
}.
Training SVM with known features gives better
performance than training with vectorized original
RGB image only. The proposed training method of
traffic sign detection extracts 5 features at the traffic
sign image and concatenate those features to create a
single feature vector. First, original traffic sign im-
age is resized to 50× 50 pixel. Applying sobel oper-
ator with three directions, horizontal, vertical, diago-
nal, generates 3 edge value feature image. Extracting
red color at traffic sign image generates one binary
feature image. The last feature is intensity feature im-
age. After extracting 5 features at traffic sign image,
vectorizing each feature image and concatenating the
vectorized feature makes 50×50×5dimensional fea-
ture. The proposed SVM training technique is trained
(a)
(b)
(c)
(d)
(e)
Figure 6: Used 5 features. (a) diagonal edge feature, (b)
horizontal edge feature, (c) vertical edge feature, (d) red
channel feature, (e) intensity feature.
60
60
ID 1
ID 1
ID 1
ID 2
ID 2
60
ID 2
Figure 7: Tracking traffic sign ID in sequence of frames.
with this 50× 50 × 5 dimensional feature.
Eventually, The proposed traffic sign detection
SVM is trained with circle, triangle, invert tri-
angle, negative classes, {Class
circle
, Class
triangle
,
Class
invtriangle
, Class
negative
}. Each classes are classi-
fied with multi-classification method named ’one ver-
sus all’ method.
2.2 Tracking Traffic Sign
The path of the traffic sign is used to determine the
lane-level position. In order to create the path, the
system should track the traffic sign and also calculate
3D location of the traffic sign. Therefore, the system
tracks the traffic sign in image frame sequence. To
track the traffic sign, template matching based track-
ing is used. If the system detects newtraffic sign in the
frame, the system gives identification number to it. If
the system detects already detected traffic sign which
detected in the previous frame, the system gives same
identification number to it. Template matching be-
tween traffic signs which in previous five frames and
traffic sign in the current frame makes same traffic
sign have the same identification number.
2.3 Stereo Matching
To find locations of the traffic signs in 3D space, we
use stereo matching not between whole left image and
whole right image but only between left traffic sign
and right traffic sign.
The system detects traffic sign only in left image.
6060
m
l
l
Figure 8: Stereo images. l indicates center of traffic sign in
left. m indicates max disparity. Red rectangle shows search
range for stereo matching.
VISAPP 2016 - International Conference on Computer Vision Theory and Applications
646
Matching cost
pixel
-5 -4 -3 -2 -1 0 +1 +2 +3 +4 +5
Figure 9: Find exact matching pixel as subpixel using least
square method.
But, to calculate 3D location, the location of the traffic
sign in the right image should be determined, so left
detected traffic sign image is used to detect traffic sign
is right image.
To find corresponding traffic sign in the right im-
age, setting ROI (Region Of Interest) in the right
image is efficient. For stereo matching, the stereo
images should be rectified first because rectification
makes two stereo images locate to a common image
plane. With rectification, traffic signs in the left image
and right image have the same height, so it can limit
height of ROI. The max disparity can limit the width
of ROI. With above two constraints, Traffic sign de-
tection ROI in the right image is determined.
To find corresponding traffic sign in the right
image, template matching with matching cost NCC
(Normalized Cross Correlation) is used. Maximum
NCC value point is corresponding point. However,
this corresponding point is pixel scale value. To more
accurate calculation, left 5 point of corresponding
point, right 5 point of corresponding point and cor-
responding point, total 11 points are used to calcu-
late subpixel corresponding point. To find most corre-
sponding point in subpixel, quadratic function which
fit with 11 point is calculated and most corresponding
point is found at point of inflection.
The 3D coordinate of the traffic sign is finally cal-
culated with triangulation with detected traffic sign in
the left image and corresponding traffic sign in right
image. With 3D coordinate of traffic sign and track-
ing in the sequence of frames, the path of traffic signs
can be measured.
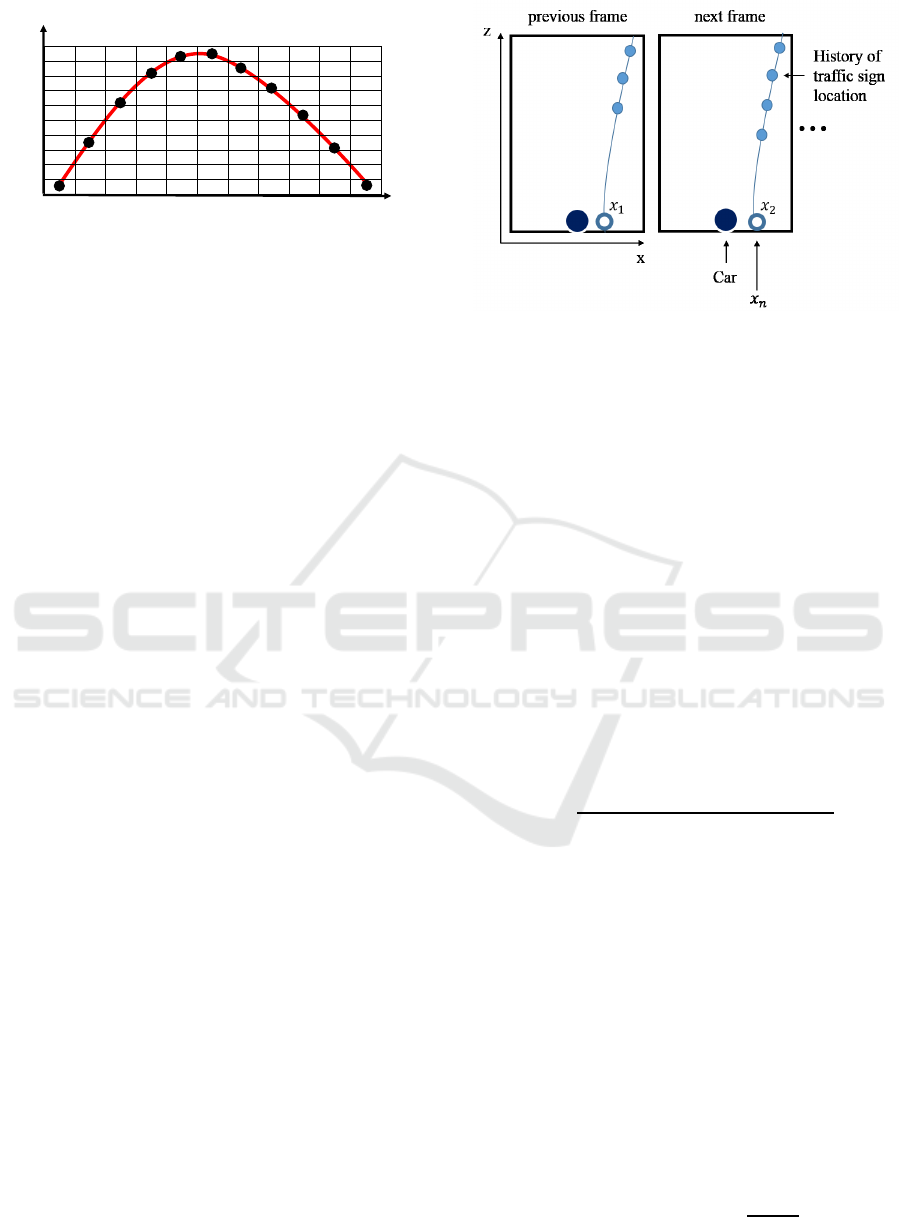
2.4 Lane-level Vehicle Positioning
Main idea of this paper is to find current lane-level
position. Now, the system knows the 3D coordinates
of the traffic sign not only current frame but also pre-
vious frames. So, the path of traffic signs can be de-
termined. When traffic sign is captured a scene of
frames, 5 to 15 traffic sign is captured at one scene,
so curve fitting with these points is needed. To fit the
Figure 10: 3D tracking path of traffic signs. x
n
indicates
interception of x-axis of quadratic function which is deter-
mine with 3D tracking path of traffic signs.
curve on those traffic signs, projection on XZ plane
is applied. locations of the traffic signs is now on the
XZ plane, so the path of traffic signs is determined
with applying least square method with those traffic
sign points. Interception of x-axis is distance between
driving car and side-way. Proposed system finds driv-
ing car’s its own lane-level using with width of lane.
Using width of lane and the distance between driving
car and side-way identify current lane-level position.
Coordinate of interception of x-axis indicates dis-
tance between the car and side-way but distance are
determined not just one interception but weighted
sum of interceptions that are made with sequence of
frames. Equation of weighted sum is shown below
equation (1). n indicates number of the interceptions.
x
n
indicates the interception.
D =
n
2
x
n
+ (n− 1)
2
x
n−1
+ · · · + 1
2
x
1
n
2
+ (n− 1)
2
+ · · · + 1
2
(1)
Driving lane is generally count from left to right,
so dividing distance between driving car and side-way
by lane width is not correct because this is count from
right to left. Therefore, Total lane is used to re-index
to left to right counting. Also, there are some gap
between road and side-way, so it should be consider
when calculate the real distance.
W is width of lane. With theW, current lane-level
position can be measured. Calculating lane-level can
solved with equation (2). L indicates the total lane
of driving direction and W indicates lanes width and
x
n
indicates the distance between the driving car and
side-way and α indicates gap which between road and
side-way.
Driving lane = L−
L×W
D− α
(2)
Lane-level Positioning based on 3D Tracking Path of Traffic Signs
647
(a)
(b)
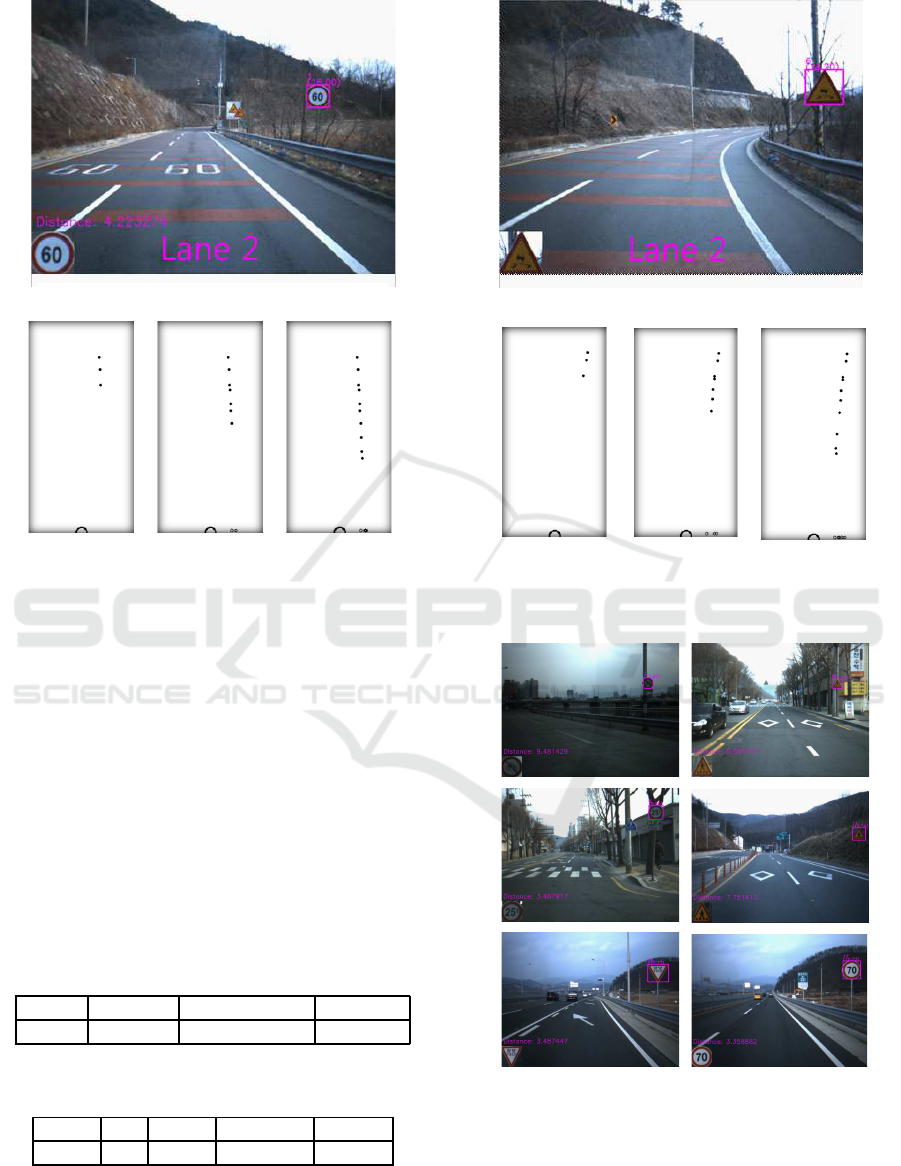
Figure 11: Result image of straight road. (a)shows result
image. (b) shows 3D tracking position of traffic sign.
3 EXPERIMENTS
BumbleBee Xbee3 is used to capture the stereo im-
ages. The camera was mounted on the front wind-
screen of the car. The experiment data was captured
on typical roads in Korea.
For traffic sign detection, abovementioned SVM
is trained with 4 classes, {Class
circle
, Class
triangle
,
Class
invtriangle
, Class
negative
}, which include 402 cir-
cle data, 229 triangle data, 156 invert triangle data,
and 1,164 negative data. The detection performance
is shown in table 2.
Table 1: Training data of traffic sign detection SVM.
Circle Triangle Invert trinagle Negative
402 229 156 1,164
Table 2: Performance of detection Traffic sign. TP: True
Positive, FP: False Positive, FN: False Negative.
TP FP FN Precision Recall
1,754 51 2,061 0.9717 0.8510
The distance between the driving lane and the
side-way is measured by the interceptions of the x-
axis, which is calculated frame by frame. However,
(a)
(b)
Figure 12: Result image of curved road. (a) shows curved
road. (b) shows 3D tracking position of traffic sign.
Lane 1
Lane 2
Lane 1
Lane 1
Lane 2
Lane 3
Figure 13: Result image of lane-level positioning.
the system does not use the interception for calculat-
ing the distance, if the number of traffic sign history
points is less than five. If we generate a curve us-
ing only 3 or 4 points of the traffic sign path, that
curve may contain large error especially in the case
of straight lanes. A curve generated using 5 points is
VISAPP 2016 - International Conference on Computer Vision Theory and Applications
648
Table 3: Result of lane-level positioning.
Scene Total
number
of lanes
Ground
truth
lane
Detected
lane
position
Measured
distance
(m)
1 2 1 1 2.42
2 2 2 2 3.46
3 2 1 1 5.66
4 2 2 2 4.01
5 2 2 2 4.28
6 2 1 1 6.95
7 2 1 1 7.75
8 2 2 2 4.31
9 2 2 2 3.77
10 2 2 2 3.69
11 3 3 3 3.48
12 2 2 2 3.35
13 2 2 2 3.52
14 4 3 4(Fail) 1.64
15 3 2 2 5.65
16 3 2 2 5.91
17 3 2 2 5.52
18 2 1 1 9.09
19 2 1 1 6.64
20 2 1 1 6.95
21 2 2 2 4.14
22 3 1 3(Fail) 1.27
Table 4: Result of vehicle lane-level positioning.
Number of scene Correct Fail Accuracy
22 20 2 90.9%
almost a straight line; therefore, we use the intercep-
tion for calculating the distance only if there are more
than four history points. Frame by frame ground truth
driving lane is determined by human inception. Fig-
ure 11 and figure 13 show sequences of traffic sign
tracking frames, which is related to a straight lane and
a curved lane respectively.
There are special parameters, α and L, to solve in
equation (2). According to the standards in Korea,
the lanes width is about 3 m to 3.5 m, and it is wide
enough to permit some amount of error of measure-
ments. As the most of the roads have less than six
lanes, α was set to 1.0 m in our experiments. L can
be identified from lane detection process or industrial
map API using GPS, however in this experiment, L is
determined by the ground truth data.
4 CONCLUSIONS
Autonomous driving needs not only the global po-
sition and the relative position between vehicles but
also the lane-level position. Very few research works
have been done on lane-level positioning using vision
based approach so far. This paper proposed a new
computer vision based approach of predicting lane-
level position using traffic sign tracking. The perfor-
mance of the system is 90.9% of accuracy.
As future works, we are planning to collect more
experiment data in different environmental conditions
to analyze the robustnessof the proposed system. Fur-
thermore, we can integrate the proposed method with
existing lane detection methods to improve the accu-
racy and the robustness of the lane-level positioning.
ACKNOWLEDGEMENT
This research was supported by the MSIP(Ministry
of Science, ICT and Future Planning), Korea, un-
der the C-ITRC(Convergence Information Technol-
ogy Research Center) (IITP-2015-H8601-15-1002)
supervised by the IITP(Institute for Information &
communications Technology Promotion). This work
was supported by the National Research Foundation
of Korea funded by the Korean Government (NRF-
331-2007-1-D00423).
REFERENCES
Antkowiak, M. (2006). Artificial neural networks vs. sup-
port vector machines for skin diseases recognition.
Master Degree, Department of Computing Science,
Umea University, Sweden.
Bahlmann, C., Zhu, Y., Ramesh, V., Pellkofer, M., and
Koehler, T. (2005). A system for traffic sign detection,
tracking, and recognition using color, shape, and mo-
tion information. In Intelligent Vehicles Symposium,
2005. Proceedings. IEEE, pages 255–260. IEEE.
Burges, C. J. (1998). A tutorial on support vector machines
for pattern recognition. Data mining and knowledge
discovery, 2(2):121–167.
Dao, T.-S., Leung, K. Y. K., Clark, C. M., and Huissoon,
J. P. (2007). Markov-based lane positioning using in-
tervehicle communication. Intelligent Transportation
Systems, IEEE Transactions on, 8(4):641–650.
De La Escalera, A., Moreno, L. E., Salichs, M. A., and
Armingol, J. M. (1997). Road traffic sign detection
and classification. Industrial Electronics, IEEE Trans-
actions on, 44(6):848–859.
Du, J. and Barth, M. J. (2008). Next-generation auto-
mated vehicle location systems: Positioning at the
Lane-level Positioning based on 3D Tracking Path of Traffic Signs
649

lane level. Intelligent Transportation Systems, IEEE
Transactions on, 9(1):48–57.
Du, J., Masters, J., and Barth, M. (2004). Lane-level po-
sitioning for in-vehicle navigation and automated ve-
hicle location (avl) systems. In Intelligent Trans-
portation Systems, 2004. Proceedings. The 7th Inter-
national IEEE Conference on, pages 35–40. IEEE.
Garc´ıa-Garrido, M.
´
A., Sotelo, M.
´
A., and Mart´ın-
Gorostiza, E. (2005). Fast road sign detection us-
ing hough transform for assisted driving of road vehi-
cles. In Computer Aided Systems Theory–EUROCAST
2005, pages 543–548. Springer.
Garcia-Garrido, M. A., Sotelo, M. A., and Martm-
Gorostiza, E. (2006). Fast traffic sign detection and
recognition under changing lighting conditions. In
Intelligent Transportation Systems Conference, 2006.
ITSC’06. IEEE, pages 811–816. IEEE.
K¨uhnl, T., Kummert, F., and Fritsch, J. (2012). Spatial ray
features for real-time ego-lane extraction. In Intelli-
gent Transportation Systems (ITSC), 2012 15th Inter-
national IEEE Conference on, pages 288–293. IEEE.
Kuhnl, T., Kummert, F., and Fritsch, J. (2013). Visual
ego-vehicle lane assignment using spatial ray features.
In Intelligent Vehicles Symposium (IV), 2013 IEEE,
pages 1101–1106. IEEE.
Maldonado-Basc´on, S., Lafuente-Arroyo, S., Gil-Jimenez,
P., G´omez-Moreno, H., and L´opez-Ferreras, F. (2007).
Road-sign detection and recognition based on support
vector machines. Intelligent Transportation Systems,
IEEE Transactions on, 8(2):264–278.
VISAPP 2016 - International Conference on Computer Vision Theory and Applications
650
