
Post Flash Crash Recovery: An Agent-based Analysis
Iryna Veryzhenko
1
and Nathalie Oriol
2
1
LIRSA, Conservatoir National des Arts et M
´
etiers, 40 rue des Je
ˆ
uneurs, 75002, Paris, France
2
GREDEG-CNRS, University of Nice Sophia-Antipolis, 250 rue Albert Einstein, 06560 Valbonne, France
Keywords:
Agent-based modeling, Limit order book, Technical trading, Flash crash.
Abstract:
In this paper we focus on the traders that purely rely on algorithms in their decision making and their impact
on market quality during moments of instability. We describe an agent-based framework that successfully
reproduces main aspects of flash crash. We simulate the effect of a large liquidity shock generated by a
very aggressive market order. We show that, despite the absence of market makers, the electronic order-book
architecture favors market resiliency and recovery.
1 INTRODUCTION
Artificial intelligence-based applications for assets
trading has completely reshaped financial markets de-
sign and end-users behaviors. The development of
information systems trading over the centuries stim-
ulated the emergence of financial clusters and located
geographic proximity at the heart of recent trading
strategies. At a microscopic level, the development
of algorithms able to compute past charts set the ba-
sic tenets of automated trading systems. Human fun-
damentalists traders has been partly replaced by me-
chanical trading strategies based on various types of
indicators designated as technical analysis strategies.
At a macroscopic level, the 1970s saw the introduc-
tion of the first exclusive electronic stock exchanges
(such as the NASDAQ in 1971), while the tradi-
tional open outcry call market’s organization began
to wane. Taking advantage of technological innova-
tion, the double auction system based on an electronic
order book (a dematerialized version of the open out-
cry blackboard hosted by an algorithm) started to be
widely adopted by official stock exchanges. The shift
from a physical artifact, such as a blackboard man-
aged by humans, to a digital artifact, such as an algo-
rithm managed by computers, led to a complete reor-
ganization of the price discovery process and the co-
ordination between traders. Interestingly, this recent
process of digital transformation of trading desks and
microstructure coincides with appearance of extreme
events initiating the so-called ”flash crashes era” for
financial markets (Giles, 2012). We propose to study
the role of agents’ behaviors and market microstruc-
ture derived from artificial-based applications on flash
crash emergence.
Agent-based models, which provide the condi-
tions for a controlled experiment and allow to il-
lustrate cause and effect relationships between ini-
tial scenario settings and model behavior, is a proper
tool to study extreme events on the stock market,
like flash crash phenomena. Moreover, the flexible
character of simulation program allows to study sep-
arately the influence of electronic order book and au-
tomated chartists strategies, to test different regula-
tor policies in order to prevent such market dynam-
ics. To the best of our knowledge there is only few
papers that study flash crash in an artificial market
framework. A wide variety of traders are designed
in the paper of (Vuorenmaa and Wang, 2014) to sim-
ulate the key aspects of the flash crash of May 6,
2010. The authors define stylized traders (fundamen-
talists, noise and opportunistic traders), institutional
algorithmic trader and high-frequency traders (HFT).
It is reported that HFT agents provide higher liquidity
in normal trading conditions, but they become aggres-
sive liquidity takers during the crash. As the num-
ber of HFT agents increases, so does the probabil-
ity of flash crash. (Paddrik et al., 2012b), propose
a similar agent-based model of the E-Mini S&P 500
futures market including fundamental traders, market
makers, HFT, small traders and opportunistic traders.
They conclude that a ”hot potato” effect was gen-
erated by HFT. Alternatively, (Lee et al., 2011) or
(Brewer et al., 2013) distinguish themselves from pre-
vious papers by their conclusions. (Lee et al., 2011)
claim that extreme event problem might be less about
190
Veryzhenko, I. and Oriol, N.
Post Flash Crash Recovery: An Agent-based Analysis.
DOI: 10.5220/0005707401900197
In Proceedings of the 8th International Conference on Agents and Artificial Intelligence (ICAART 2016) - Volume 1, pages 190-197
ISBN: 978-989-758-172-4
Copyright
c
2016 by SCITEPRESS – Science and Technology Publications, Lda. All rights reser ved

HFT but rather about a dominant population of traders
that are responding to a given set of market variables
in similar ways. They conclude that any regulatory at-
tempt to ”slow down” trading may cause more prob-
lems than it solves. (Brewer et al., 2013) focus on
the effect of large-volume order and change in funda-
mentals on the market quality. In this paper, market
is populated only by zero-intelligence agents. They
conclude that the nature and impact of liquidity ero-
sion is sensitive to the market structure and that the
exact nature of crash and book erosion depends on
the structure of the order flow. Authors test differ-
ent mechanisms to reduce the negative effect of flash
crashes: introducing minimum resting time; shutting
off trading for a certain period; switching to call auc-
tion market session, that is particularly effective.
Our paper is most closely related to those two lasts.
We study the impact of market participants relying
only on algorithm decision making on market qual-
ity during a liquidity shock. We argue that both mi-
crostructure and agents’ behavior are part of the crash
and the market recovery.
2 FLASH CRASH IN ARTIFICIAL
MULTI-AGENT MARKET
To study flash crash phenomenon we use ArTifcial
Open Market (ATOM) (Brandouy et al., 2013), which
is highly flexible simulations platform and allows dif-
ferent parametrization of microstructure and traders
behavior for different scenarios. This platform con-
tains three main modules. The first one is market
microstructure, that provides a mechanism for or-
ders routing. ATOM clones the main features of
the Euronext-NYSE stock exchange microstructure.
Such market is ruled by a negotiation system be-
tween traders on a double auction machanism struc-
tured in an order book. The next system’s com-
ponent is economic world that provides exogenous
information about corporate development, dividends
and coupons changes. Finally, agents component en-
compasses multiple types of agents with different util-
ity functions, believes and strategies. Trading strate-
gies take into account exogenous information, func-
tionality and rules of market microstructure, and en-
dogenous information (post transaction information,
generated by agents interaction).
2.1 Continuous Double Auction Market
For current experiments, we choose to set a continu-
ous double auction (CDA) microstructure which is a
replication of the widely used electronic order book.
The CDA is a market protocol where agents place or-
ders on separate buying (bid) and selling (ask) books.
There are two main types of orders: limit and mar-
ket orders. Limit order is an order to buy or sell a
given quantity of stocks with a specific price or bet-
ter. These orders are stored in the order book until
their complete execution or end of validity. The high-
est bid is called best bid, the lowest ask is the best ask.
A transaction occurs when best bid is higher than best
ask. Market order is an order to immediately buy or
sell a given quantity at the best available prices. A
transaction occurs when market order hits the limit
orders stocked on the opposite side.
A major aspect of the quality of market place is its
liquidity. Liquidity is a possibility to realize immedi-
ately a big-size transaction without affecting a price in
significant way. A market order for more shares than
the size of best bid (ask) will execute at worse price
until it is fully executed and will provoke significant
price variations. This type of orders is considered as
an aggressive one. Liquidity is directly related to mar-
ket resilience, which is a speed of recovery of the mar-
ket after a large shock, like big-size aggressive market
order. We test these properties in the market popu-
lated by strategic agents and zero-intelligence traders.
2.2 Traders’ Strategies
One of the goals of our paper is to determine the
impact of strategic agents driven only by the techni-
cal signals on market quality (liquidity and volatility)
during a liquidity shock. We wish to keep our model
as simple as possible, to be able to catch such effects.
For this reason we focus only on two types of traders,
fundamentalists and chartists (technical traders).
Fundamentalists are driven by the true (funda-
mental) asset’s value. The fundamental value of
each stock evolves according to the jump process
V
t
= V
t−1
+ δ
t
, where δ
t
∼ N(0,σ). As the agents
are bounded rational (or noisily informed), the fun-
damental value is biased by ε
i
, which determines the
accuracy of the agent i to interpret the fundamen-
tal information W
t
= V
t
+ ε
i
, ε
i
∼ N(0, σ
W
). Agents
are heterogeneous with respect to their parameter ε
i
.
To make a buy/sell decision an agent compares the
stock’s current price P
t
with fundamental value W
t
.
The price fixing mechanism is inspired from the pa-
per (Chan et al., 1999).
The fundamentalists submit their order according
to procedure described in Table 1. To summarize,
agents buy undervalued stocks and sell overvalued
stocks according to their beliefs. They stop trading
when they are out of cash or stocks, if short selling is
not allowed.
Post Flash Crash Recovery: An Agent-based Analysis
191

Table 1: The order-submission procedure. P
ask
denotes a best ask price, P
bid
best bid price, al ph
t
ask tick size, β
t
bid tick
size, Q
t
is a volume of the order issued at the moment t, S
t−1
is a number of stocks hold by an agent at moment t −1, C
t−1
is
available cash hold by an agent at moment t −1, U(x
1
,x
2
) the uniform distribution in the interval [x
1
,x
2
].
Conditions Order type
Existing bid, existing ask
W
t
> P
ask
bid market order
W
t
< P
bid
ask market order
P
bid
< W
t
< P
ask
bid/ask order with probability 50%/50% at price ∼ U (P
bid
,P
ask
)
Order book is empty
with probability 1/2 limit ask order at W
t
+ α
t
, Q
t
∼ U (1,S
t−1
)
with probability 1/2 limit bid order at W
t
− β
t
, Q
t
∼ U (1,C
t
/(W
t
− β
t
))
Empty bid side, existing ask
W
t
> P
ask
bid market order, Q
t
∼ U (1,C
t
/P
ask
)
W
t
≤ P
ask
limit bid order at W
t
− β
t
, Q
t
∼ U (1,C
t
/(W
t
− β
t
))
Existing bid side, empty ask side
W
t
< P
bid
ask market order, Q
t
∼ U (1,S
t−1
)
W
t
≥ P
bid
limit ask order at W
t
+ α
t
, Q
t
∼ U (1,S
t−1
)
Technical traders or chartists rely on algorithms
to generate trading signals using historical price series
or charts as a main source of information. The basic
hypothesis of technical trading are as follows:
• Market is not efficient, price is impacted not only
by a fundamental information but also by past
trends.
• Price series follows the trends.
• History is repeating itself.
• Price reflects predictions and a common mood of
traders.
A graphic is considered as a synthesis of market be-
havior. There exist upward and downward trends. Up-
ward and downward confirmed trends determine buy
and sell trades. Technical traders use the algorithms
to determine a trend and to estimate whether the stock
is underpriced of overprice compared to this trend. In
other terms, they identify tradings signals based on
past price movements (Murphy, 1999). Technical an-
alysts focus on generating trading signals that provide
a higher investment return. For these simulations we
use three strategies of technical analysis, widely used
by practicians and largely studied in theoretical and
empirical literature and quoted as profitable on intra-
day data (Aldridge, 2013).
Momentum indicator compares the current price
with the price in the past D(t, n) =
P
t
P
t−n
× 100, where
n is a historical window length, which is uniformly
driven from an interval [50,500]. If D > 100, an agent
sends a bid order, and if D < 100 the agent sends an
ask order.
Simple Moving Average strategy determines a gen-
eral tendency on the market. A price series is replaced
by Y
t
=
1
n
∑
t
i=t−n
P
t
∀t =
¯
n,N. They issue bid/ask
orders when price P
t
crosses either above or below
a long-period trend Y
t
. The lower the length of the
moving average n the more closely it tracks the price
moving and more often it generates buy/sell signals.
Longer moving average indicates overall direction of
the market and reacts slower to market fluctuations.
Relative Strength Index strategy measures the
strength of a trend.
RSI =
U
U +D
× 100
U – an upward change, D – a downward change. The
RSI indicator is plotted on a scale of 0 to 100. 0 rep-
resents the most oversold conditions and 100 the most
overbought.
The population of chartist is heterogeneous with
respect with their trading signals and their individ-
ual periods of position recalculation. Then, at each
tick, you can have either trend followers or contrarian
traders.
To decide a volume of new bid limit order an agent
computes first of all a potential quantity Q
potential
t
=
b
C
t−1
P
t
c, the order volume is determined as Q
t
∼
U(1,4 × Q
potential
t
), where 4 is borrowing rate. 4 >
1 if borrowing is allowed. The volume of ask order
is determined as follow Q
t
∼ U(1,4 × S
t−1
), where
4 is a short selling rate. 4 > 1 if short selling is
allowed. Q
t
is a volume of the order issued at the mo-
ment t, S
t−1
is a number of stocks hold by an agent at
moment t − 1, C
t−1
is available cash hold by an agent
at moment t − 1, U (x
1
,x
2
) the uniform distribution in
the interval [x
1
,x
2
]
However, we recognize the importance of quantity
as a choice variable and that our volume submission is
a simplification of a real one, which depends on risk
aversion.
Another important issue is how the limit price of
chartists is determined, as it impacts market liquidity
ICAART 2016 - 8th International Conference on Agents and Artificial Intelligence
192

and volatility. In each trading session, chartist agents
trade near best bid and best ask. For this type of
agents, we use the procedure inspired by price setting
rules described in (Jacobs et al., 2004).
1. Bid price
P
Bid
t
= P
Bid
t−1
+ β
t
where P
Bid
t−1
is the best bid price in the order
book in t − 1; β
t
is a random value in the range
[1; 5]: it means that best bid price at the moment t
will be increased by value from 1 to 5 cents. P
Bid
0
is equal to the previous day closing price. If agent
gets an intention to buy stocks, she should check
our the best bid order and increase it by a certain
value β
t
in order to set up her order on the top
of the order book, decrease bid-ask spread and in-
crease own chances to realize transaction. In other
words, bidder is ready to pay up to 5 cents more
than the rest of traders.
2. Ask price
P
Ask
t
= P
Ask
t−1
− α
t
where P
Ask
t−1
is the best ask price in the order
book in t − 1; α
t
is a random value with the range
[1; 5]: it means that best ask price at the time t will
be decreased by value from 1 to 5 cents. P
Ask
0
is
previous day closing price.
This rule provides liquidity and reduce the bid-ask
spread (difference between buy/sell prices).
In the condition of double auction market, a profit-
oriented buyer sets up the price lower his limit price
because there would be a seller willing to accept this
low bid price. Similarly, a seller sets a price higher
his limit price, expecting that there would be a bidder
ready to accept a high ask price. In condition of com-
petitive market, the price comes closer to the market
equilibrium price. As long as the buyer can under-
cut a competitor and still make a profit, he will add
some insignificant amount to the last best bid price,
similarly, seller will decrease the last best ask price
by insignificant value, if it does not exceed his limit
price.
2.3 Simulations and Results
Here we describe the model of market mechanism and
agents interaction parameters we use in our experi-
ments.
As in real market, trading occur asynchronously
at discrete-time interval t = 1,2...510, that represents
a trading day of 8.5 hours at a minute granularity. At
each round a trader is picked by the system to make
a decision. A trader can have only one open position
at the time and, therefore, before issuing a new or-
der he should cancel an old one pending in the order
book. The agents send limit, market and cancel or-
ders. They also have a possibility to send a null order.
In such a way we model different trading frequencies,
and hence model realistic patterns of activity through-
out the day.
According to study realized by (Paddrik et al.,
2012a) there are around 2500 fundamentalists (buy-
ers and sellers). Due to the large number of traders,
we scale our simulations to 1/10 of the market, and
populate our artificial market by 250 fundamentalists.
In the first experiment we run two scenarios: i)
operation shock (without fundamental reasons) in the
market populated by 250 fundamentalists only (these
simulation results serve as a benchmark to study an
impact of technical traders) ii) operation shock in the
market populated by 100 fundamentalists, 50 momen-
tum agents, 50 RSI agents, and 50 SMA agents. Each
of these experiments we conduct consists of 100 runs,
where each run begins with the same initial condi-
tions (initial wealth, hold stocks, etc). In such a way,
all statistics are averaged by over 100 repetitions. The
main parameters of these experiments are detailed in
Table 2.
Flash crash can be initiated by events and prac-
tices destroying liquidity. In two scenarios we cause
a flash crash by introducing an aggressive market or-
der like in the paper of (Brewer et al., 2013). In such a
way we get an immediate effect on the market dynam-
ics. Flash crash is produced by submitting a 20-time
higher volume market order compared to average or-
der size, that can be considered as operational error
produced by a trader. Liquidity measures take about
20 best limit updates to return to their initial level (De-
gryse et al., 2005). For this reason an agent submits
a 20-times higher volume market order in the expec-
tation of matching about 20 best limits. This error
is introduced in the middle of trading day, at 255th
round.
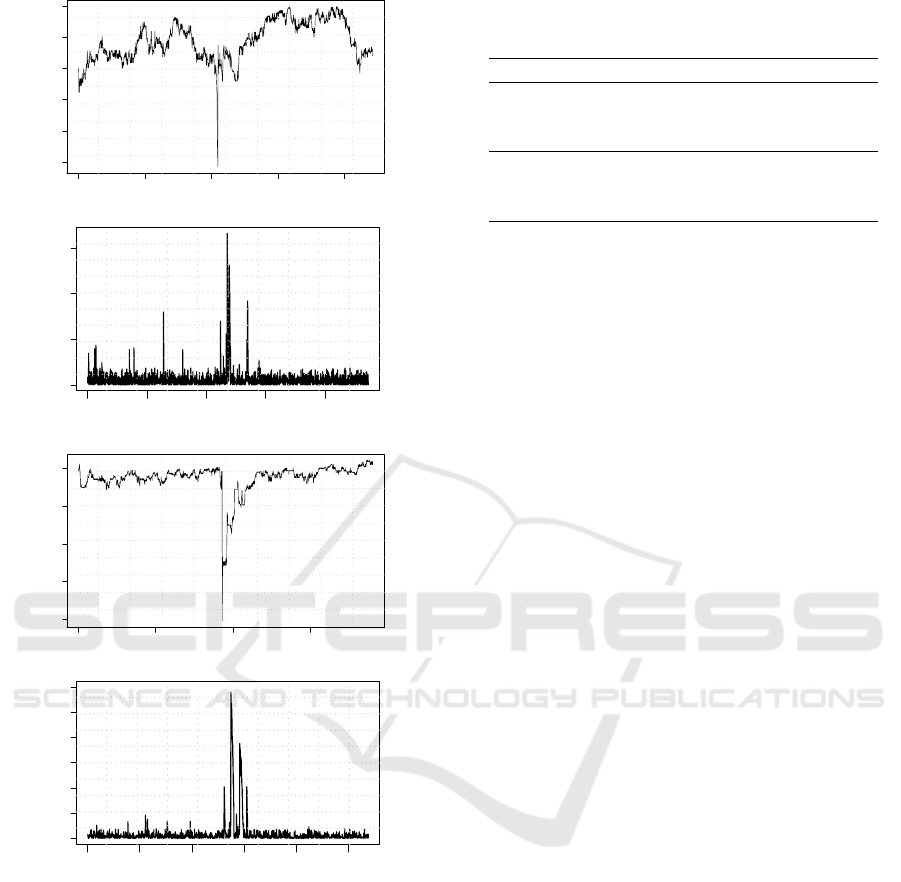
We study the impact of this operational shock on
the market liquidity and price dynamic. In both sce-
narios, ask market order destroys bid side liquidity
and price falls rapidly. Just after this crash, bid side
contains few orders, hence the market is at its most
vulnerable and sensitive stage. High volatility period
follows the crash. Figures 1(b) and 1(d) report an in-
creasing of bid/ask spread, and consequently, a high
volatility.
In the presence of intraday technical traders,
which ignore the true value of the stock, the market
crash is deeper (for the same shock, the speculative
market loses on average 26.5%, while fundamental-
ists market declines on 12.3%) because speculative
strategies bring down the prices. Downward trend
is quickly explored by chartist, which exacerbate the
Post Flash Crash Recovery: An Agent-based Analysis
193

Table 2: Parameters and their initialization used in simulations.
Parameter Value Description
N
f und
i) 250 ii) 100 Number of fundamentalists
N
tech
i) 0 ii) 150 Number of technical traders
C
0,i
[1 000 000; 2 000 000] Initial cash attributed at moment 0 to the agent i
S
0,i
[100; 10 000] Number of stocks attributed at moment 0 to the agent i
N
rounds
510 Number of rounds per day
4 2 Short selling and borrowing are allowed with respect to
the portfolio constraints: ϖ
s
∈ [−1,1] and ϖ
c
∈ [−1,1],
where ϖ
s
and ϖ
c
are respectively stock and cash weights
in total portfolio
already declining prices. As far as downward trend
is registered, some part of speculative traders cancel
their old bid orders to submit the new ones with lower
limit price, the other part takes short position on this
stock.
In the market of fundamentalists, the crash depth
is determined by the initial state of the order book.
The crash is finished as far as market order is over. If
a large majority of agents (60%) follows speculative
strategy bid side of order book is negatively impacted
by orders canceling and short sales. It provokes liq-
uidity problems and makes the correction more com-
plicated. As far as fundamentalists start actively buy-
ing the stocks (as it is undervalued) the stock price
goes back up but high volatility is registered due to
high bid/ask spread.
Next, we study the statistical properties of stock
market before and after flash crash in the two sce-
narios. We particularly focus on volatility as risk
measure (Grouard et al., 2003). A price series is
divided in two subsequences before and after the
crash. The first series is represented by P
1
,P
2
,...,P
k
,
where k is a moment of big-volume ask order ar-
rival. We calculate returns based on this price series
r
1
,r
2
,...,r
k−1
, where r
i
= ln(P
i+1
) − ln(P
i
). This se-
ries represents a period before the crash. The sec-
ond series is based on the prices P
k+m+1
,...,P
n
, where
P
k+1
> P
k+2
> ... > P
k+m
and P
k+m
< P
k+m+1
, m is
the time length of the flash crash. Next we calculate
the series r
k+m+1
,r
k+m+2
,...,r
n−1
which represents a
series after the flash crash.
In table 3, we show the mean and standard devi-
ation of each subsets along with higher order statis-
tics such as skewness and kurtosis for historical intra-
day returns. We report increased volatility just after
the crash: in the market populated by fundamental-
ists increases on average by 20% (from 0.003777883
to 0.004609726), in the mixed market standard de-
viation jumps (from 0.003969339 to 0.005433639).
Next, we estimate skewness and kurtosis as well. In
the market populated by fundamentalists only, the co-
efficient of asymmetry is negative (from -6.138734
to -2.496489, that indicates a high probability of ex-
treme loss, which decreases after crash), this coeffi-
cient is positive in the mixed market (it varies from
1.807211 to 3.125376, that means a high probability
for extreme loss, which increases after crash).
Table 3: Summary statistics of log returns before and after
flash crash. All statistics are averaged by over 100 repeti-
tions.
Market of fundamentalists Mixed market
Before After Before After
Mean -0.0001 4.5420e-05 -1.9091e-06 0.0002
Sd 0.0038 0.0046 0.0039 0.0054
Skewness -6.1387 -2.4965 1.8072 3.1254
Kurtosis 131.1714 38.6699 38.76373 77.4977
The results provide the evidence that in presence
of chartists the operational shock affects a price dy-
namic in a more significant manner. In addition, this
practice reduces resiliency properties of market and
makes the price rapid convergence towards its fair
value more difficult. In the next section we focus on
the market microsctructure mechanisms and their ef-
fect on the price dynamic during an operational shock.
3 THE ROLE OF MARKET
MICROSTRUCTURE
The literature indicates that many stylized facts and
price patterns are due to the market microstructure
and not to some sophisticated traders strategies. Good
market performance should not be automatically at-
tributed to traders rationality and intelligence, it can
be also explained by market mechanisms (auction)
(Gode and Sunders, 1997). In this section, we fol-
low the spirit of Gode and Sunder’s (1993) ”zero-
intelligence” traders (ZIT) to study the role of market
micro-structure in market recovery after flash crash.
To address this question formally, we use artificial
market populated only by zero-intelligence agents.
For traceability reasons, the market is populated
ICAART 2016 - 8th International Conference on Agents and Artificial Intelligence
194
0 1000 2000 3000 4000
21 22 23 24 25 26
Times
Price
(a) Price. Market of fundamentalists.
0 1000 2000 3000 4000
0.0 0.5 1.0 1.5
Times
Price
(b) Bid/ask spread. Market of fundamentalists.
0 1000 2000 3000
22 24 26 28 30
Times
Price
(c) Price. Mixed market.
0 500 1000 1500 2000 2500
0.0 1.0 2.0 3.0
Times
Bid/Ask Spread
(d) Bid/ask spread. Mixed market.
Figure 1: Simulations with 250 agents.
only by 15 zero-intelligence traders, who negotiate
only one asset. The fixed price is a result of orders
submitted to the order book by traders. The price
of an order is randomly selected from the interval
[P
min
,P
max
]. That are settled to 43 and 46 respectively.
This interval initially communicated to all agents and
stay constant over simulations. We define two sub-
groups of agents which differ with respect to their
traded volume: ”Small fishes” and ”Big fishes” (send
10-times higher volume orders). Big fishes ”feed”
Small fishes. In other words, Small fishes can eas-
ily buy or sell stocks with a price close to the cur-
rent market price, until a big order is completely exe-
Table 4: Zero intelligence trader’s decision making. P
min
,
P
max
, V
min
, V
max
minimum and maximum prices and vol-
umes, which are input parameters for algorithm.
Conditions Order type
with probability 1/2 limit ASK order at
price ∼ U(P
min
,P
max
)
volume Q ∼ U(V
min
,V
max
)
with probability 1/2 limit BID order at
price ∼ U(P
min
,P
max
)
volume Q ∼ U(V
min
,V
max
)
cuted. That generates patters of price stability. ”Small
fishes” and ”big fishes” represent 33% (1/3) and 67%
(2/3) of the total population respectively. This pro-
portion is explained in (Brandouy et al., 2012). Small
fishes determine the trading volume arbitrary from the
interval [V
min
,V
max
]. The order’s volume of big fishes
is uniformly driven from the interval [V
max
,10×V
max
].
V
min
and V
max
are defined as 5 and 50 respectively.
The ZIT decision making is presented in Table 4
There are two possible order types: limit, market.
Market order is used only once by an agent to generate
a market crash and to get an immediate effect on the
market dynamics. The rest of the agents submits only
limit orders, with no expiry.
Each agent can buy or sell the asset with the same
probability. The short selling is allowed, so the agents
can conclude the transaction even if they don’t have
enough cash to do so.
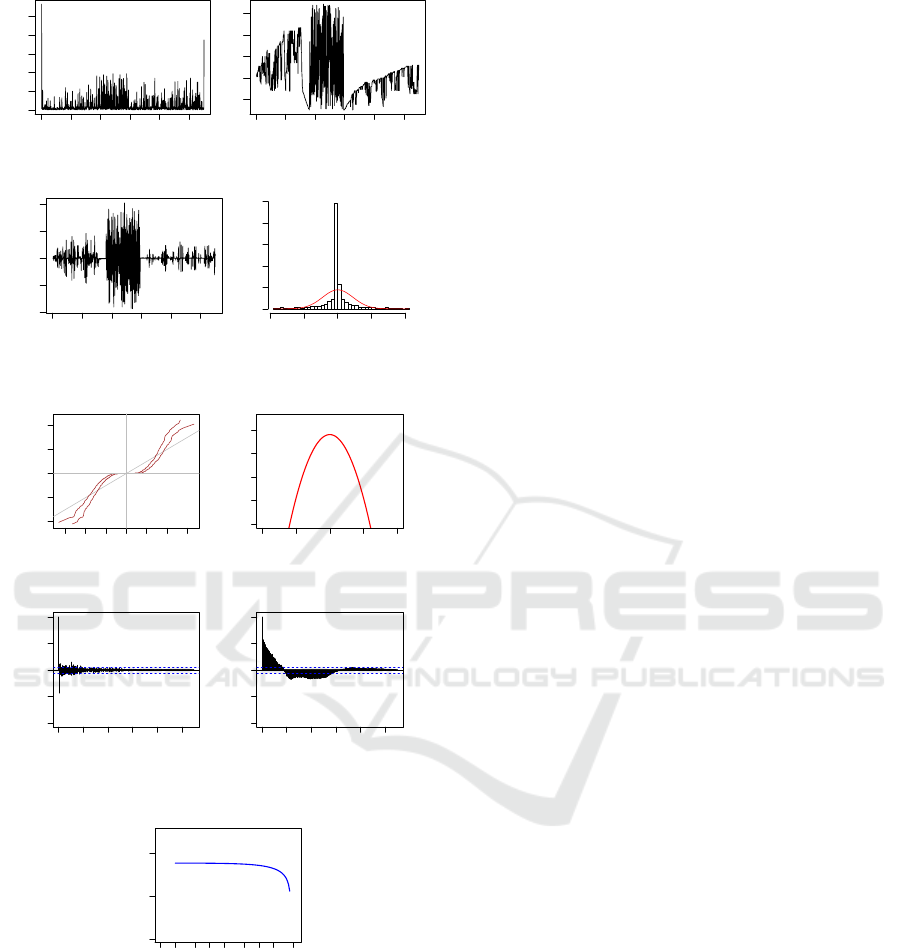
Figure 2(b) reports a typical picture of the
price series generated by the population of zero-
intelligence agents. The crash is followed by the high-
volatility regime over about 200 ticks. The upward
trend comes just after the high-volatility period. We
also report a significant reduction of volatility. The
market mechanism explains this phenomenon. Over
first 200 ticks big fishes provide liquidity and permit
the market to stay quite stable. Due to operational
error a new big-size market order appears in the ask
side. This order immediately matches all Bid orders
pending in the order book as well as new incoming
orders. While the big-size ask order is not totally
fulfilled we observe the high-volatility regime. As
bid/ask orders arrive with the same probability and
only ”ex-market” order takes part in transaction, ask
side becomes deep and dense. As far as market order
is completed, other ask orders pending in the order
book can be proceed. According to the timestamps
priority, the concluded transaction price corresponds
to the ask order which generates a transaction. As a
result, market goes up that can be considered as the
market ”autocorrection”.
Figure 2(h) reports unusual behavior of slow de-
cay of autocorrelation in absolute returns |r
t
| over 174
lags that is followed by a cluster of negative corre-
Post Flash Crash Recovery: An Agent-based Analysis
195
0 200 400 600 800 1000
0 500 1500 2500
(a) Trading volume
0 200 400 600 800 1000
43.6 44.0 44.4
(b) Price
0 200 400 600 800 1000
−0.02 0.00 0.01 0.02
(c) Log returns
−0.02 −0.01 0.00 0.01 0.02
0 100 300 500
(d) Distribution of re-
turns
●
●
●
●
●
●
●
●
●●
●
●
●
●
●
●
●
●
●
●
●
●
●
●
●
●
●
●
●
●
●
●
●
●
●
●
●
●
●
●
●
●
●
●
●
●
●
●
●
●
●
●●
●
●
●
●
●
●
●
●
●
●
●
●
●
●
●
●
●
●
●
●
●
●
●
●
●
●
●
●
●
●
●●
●●
●
●
●
●
●
●
●
●
●
●●
●
●●●●
●
●
●
●
●
●
●
●
●
●
●
●
●
●
●
●
●●
●
●●
●●
●●
●
●
●
●
●
●
●
●
●●
●
●
●
●
●●
●
●
●
●
●
●●
●●
●●
●
●
●
●
●
●●
●
●●
●
●
●
●
●●
●●●●●
●
●
●●
●●
●
●●●●
●●
●
●●●
●
●
●
●●
●●●●
●
●
●
●
●●
●●●●●●
●●●
●
●●
●●●
●●●●
●●
●
●●●●●●●●●●●●●●
●●●●●●
●●
●●
●
●●
●●●●●●●●●●●●●●●●●●●●
●
●●
●●●●●●●●●●●●●●●●●●●●●●●●●●●●●●●●●●●●●●●●●●●●●●●
●●●●●●
●●●●●●●●●●●●●●●●●●●●●●●●●●●●●●●●●●●●●●●●●●●●●●●●●●●●●●●●●●●●●●●●●●●●●●●●●●●●●●●●●●●●●●●●●●●●●●●●●●●●●●●●●●●●●●●●●●●●●●●●●●●●●●●●●●●●●●●●●●●●●●●●●●●●●●●●●●●●●●●●●●●●●●●●●●●●●●●●●●●●●●●●●●●●●●●●●●●●●●●●●●●●●●●●●●●●●●●●●●●●●●●●●●●●●●●●●●●●●●●●●●●●●●●●●●●●●●●●●●●●●●●●●●●●●●●●●●●●●●●●●●●●●●●●●●●●●●●●●●●●●●●●●●●●●●●●●●●●●●●●●●●●●●●●●●●●●●●●●●●●●●●●●●●●●●●●●●●●●●●●●●●●●●●●●●●●●●●●●●●●●●●●●●●●●●●●●●●●●●●●●●●●●●●●●●●●●●●●●●●●●●●●●●●●
●●●●●●●●●●●●●●●
●●●●●●●●●●●●●●●●●●●●●●●●●●●●●●●●●●●●●●●●●●●●●●●●●●●●●●●●●●●●
●
●●●●●●●●
●●●●●●●●
●●
●●●●●
●●●
●●●●●●●●●
●●●●●●
●
●
●●●
●●●
●
●
●
●
●●
●●
●●
●●
●
●●●
●●
●●
●●●●●
●●
●
●●
●●●
●
●●●●●
●●
●
●
●
●●
●●
●
●
●
●
●
●●
●
●
●
●
●●
●●
●
●
●
●
●●
●
●●
●
●●
●
●
●
●
●●
●
●
●●
●
●
●
●
●●
●
●
●
●
●
●
●
●
●
●
●
●
●●
●
●
●
●
●
●
●●●
●
●
●
●●
●●
●
●●
●
●●
●
●
●
●
●
●
●
●●
●
●
●
●
●
●
●
●
●
●
●
●
●●
●
●
●
●
●
●
●
●
●
●
●
●
●
●
●
●
●
●
●
●
●
●
●
●
●
●
●
●
●
●
●
●
●
●
●
●
●
●
●
●
●
●
●
●
●
●
●
●
●
●
●
●
●
●
●
●
●
●
●
●
●
●
●
●
−3 −2 −1 0 1 2 3
−4 −2 0 2 4
(e) QQ plot
−10 −5 0 5 10
1e−08 1e−04 1e+00
●
●
●
●
●
●
●
●
●
●
●
●
●
●
●
●
●
●
●
●
●
●
●
●
●
●
●
●
●
●
●
●
●
●
●
●
●
●
●
●
●
●
●
●
●
●
●
●
●
●
●
●
●
●
●
●
●
●
●
●
●
●
●
●
●
●
●
●
●
●
●
●
●
●
●
●
●
●
●
●
●
●
●
●
●
●
●
●
●
●
●
●
●
●
●
●
●
●
●
●
●
●
●
●
●
●
●
●
●
●
●
●
●
●
●
●
●
●
●
●
●
●
●
●
●
●
●
●
●
●
●
●
●
●
●
●
●
●
●
●
●
●
●
●
●
●
●
●
●
●
●
●
●
●
●
●
●
●
●
●
●
●
●
●
●
●
●
●
●
●
●
●
●
●
●
●
●
●
●
●
●
●
●
●
●
●
●
●
●
●
●
●
●
●
●
●
●
●
●
●
●
●
●
●
●
●
●
●
●
●
●
●
●
●
●
●
●
●
●
●
●
●
●
●
●
●
●
●
●
●
●
●
●
●
●
●
●
●
●
●
●
●
●
●
●
●
●
●
●
●
●
●
●
●
●
●
●
●
●
●
●
●
●
●
●
●
●
●
●
●
●
●
●
●
●
●
●
●
●
●
●
●
●
●
●
●
●
●
●
●
●
●
●
●
●
●
●
●
●
●
●
●
●
●
●
●
●
●
●
●
●
●
●
●
●
●
●
●
●
●
●
●
●
●
●
●
●
●
●
●
●
●
●
●
●
●
●
●
●
●
●
●
●
●
●
●
●
●
●
●
●
●
●
●
●
●
●
●
●
●
●
●
●
●
●
●
●
●
●
●
●
●
●
●
●
●
●
●
●
●
●
●
●
●
●
●
●
●
●
●
●
●
●
●
●
●
●
●
●
●
●
●
●
●
●
●
●
●
●
●
●
●
●
●
●
●
●
●
●
●
●
●
●
●
●
●
●
●
●
●
●
●
●
●
●
●
●
●
●
●
●
●
●
●
●
●
●
●
●
●
●
●
●
●
●
●
●
●
●
●
●
●
●
●
●
●
●
●
●
●
●
●
●
●
●
●
●
●
●
●
●
●
●
●
●
●
●
●
●
●
●
●
●
●
●
●
●
●
●
●
●
●
●
●
●
●
●
●
(f) Normalized returns
0 200 400 600 800 1000
−1.0 −0.5 0.0 0.5 1.0
(g) Autocorrelation of
row returns
0 200 400 600 800 1000
−1.0 −0.5 0.0 0.5 1.0
(h) Autocorrelation of
abs returns
●
●
●
●
●
●
●
●
●
●
●
●
●
●
●
●
●
●
●
●
●
●
●
●
●
●
●
●
●
●
●
●
●
●
●
●
●
●
●
●
●
●
●
●
●
●
●
●
●
●
●
●
●
●
●
●
●
●
●
●
●
●
●
●
●
●
●
●
●
●
●
●
●
●
●
●
●
●
●
●
●
●
●
●
●
●
●
●
●
●
●
●
●
●
●
●
●
●
●
●
●
●
●
●
●
●
●
●
●
●
●
●
●
●
●
●
●
●
●
●
●
●
●
●
●
●
●
●
●
●
●
●
●
●
●
●
●
●
●
●
●
●
●
●
●
●
●
●
●
●
●
●
●
●
●
●
●
●
●
●
●
●
●
●
●
●
●
●
●
●
●
●
●
●
●
●
●
●
●
●
●
●
●
●
●
●
●
●
●
●
●
●
●
●
●
●
●
●
●
●
●
●
●
●
●
●
●
●
●
●
●
●
●
●
●
●
●
●
●
●
●
●
●
●
●
●
●
●
●
●
●
●
●
●
●
●
●
●
●
●
●
●
●
●
●
●
●
●
●
●
●
●
●
●
●
●
●
●
●
●
●
●
●
●
●
●
●
●
●
●
●
●
●
●
●
●
●
●
●
●
●
●
●
●
●
●
●
●
●
●
●
●
●
●
●
●
●
●
●
●
●
●
●
●
●
●
●
●
●
●
●
●
●
●
●
●
●
●
●
●
●
●
●
●
●
●
●
●
●
●
●
●
●
●
●
●
●
●
●
●
●
●
●
●
●
●
●
●
●
●
●
●
●
●
●
●
●
●
●
●
●
●
●
●
●
●
●
●
●
●
●
●
●
●
●
●
●
●
●
●
●
●
●
●
●
●
●
●
●
●
●
●
●
●
●
●
●
●
●
●
●
●
●
●
●
●
●
●
●
●
●
●
●
●
●
●
●
●
●
●
●
●
●
●
●
●
●
●
●
●
●
●
●
●
●
●
●
●
●
●
●
●
●
●
●
●
●
●
●
●
●
●
●
●
●
●
●
●
●
●
●
●
●
●
●
●
●
●
●
●
●
●
●
●
●
●
●
●
●
●
●
●
●
●
●
●
●
●
●
●
●
●
●
●
●
●
●
●
●
●
●
●
●
●
●
●
●
●
●
●
●
●
●
●
●
●
●
●
●
●
●
●
●
●
●
●
●
●
●
●
●
●
●
●
●
●
●
●
●
●
●
●
●
●
●
●
●
●
●
●
●
●
●
●
●
●
●
●
●
●
●
1 2 5 10 50 200
1e−05 1e−03 1e−01
(i) Slow decay in abs re-
turns, log scale
Figure 2: Simulations with 15 zero-intelligence agents.
lations. As one can see from the figure, the coeffi-
cients are significant over long period which supports
the so called mean-reversion behavior of stock market
returns. These results are in agreement with observa-
tions reported in (Cont, 2007). This non trivial behav-
ior of autocorrelation is also reported in the absolute
returns of the real individual stocks during the flash
crash on April 23, 2013. This observation is remark-
ably stable across S&P 500 stocks. This phenomenon
can be explained by the fact that positive effects of
past order flows on current prices are reinforced dur-
ing periods of high stress (Cohen and Shin, 2002).
These results show that the electronic order book and
the market microstructure’s role is determinant in the
post-flash crash recovery.
4 CONCLUSIONS
This paper aims at studying the flash crash caused
by an operational shock with different market par-
ticipants. In particular, by including automated trad-
ing strategies and electronic order-book microstruc-
ture, simulations give some insights about artificial-
intelligence applications role in extreme disruptions.
We reproduce this shock in artificial market frame-
work to study market quality in different scenarios,
with or without strategic traders. Trading interactions
within a group of technical traders make a shock re-
flected in the price dynamic deeper compared to the
similar shock in the market populated only by fun-
damentalists. We find that flash crash is much more
a feedback trading issue than a single population of
trader problem. Additionally, we study the role of
market microstructure on the prices collapse and re-
covery. We show that, despite the absence of market
makers, the order-driven market is resilient. The in-
traday continuous trading and the electronic double-
auction mechanism favor price recovery. Finally,
flash crash anatomy is an outcome of complex interac-
tion between three key-ingredients: agents strategies,
liquidity withdrawal, and pre-existing microstructure
features.
REFERENCES
Aldridge, I. (2013). High-Frequency Trading: A Practical
Guide to Algorithmic Strategies and Trading Systems.
Wiley Trading Series.
Brandouy, O., Corelli, A., Veryzhenko, I., and Waldeck, R.
(2012). Why zero intelligence traders are not smart
enough for quantitative finance. Journal of Economic
Interaction and Coordination, 7:223–248.
Brandouy, O., Mathieu, P., and Veryzhenko, I. (2013).
On the design of agent-based artificial stock markets.
Communications in Computer and Information Sci-
ence, 271:350–364.
Brewer, P., Cvitanic, J., and Plott, C. (2013). Market mi-
crostructure design and flash crashes : A simulation
approach. Journal of Applied Economics, 16(2):223–
250.
ICAART 2016 - 8th International Conference on Agents and Artificial Intelligence
196

Chan, N. T., LeBaron, B., Lo, A. W., Poggio, T., Yy, A.
W. L., and Zz, T. P. (1999). Agent-based models of
financial markets: A comparison with experimental
markets.
Cohen, B. and Shin, H. (2002). Positive feedback trading
under stress : Evidence from the us treasury securi-
ties market. In Risk Measurement and Systemic Risk
issued by Committee on the Global Financial System.
Basel: Bank for International Setlements.
Cont, R. (2007). Volatility clustering in financial markets:
Empirical facts and agentbased modelsy. Long Mem-
ory in Economics, pages 289–309.
Degryse, H., Jong, F. D., Ravenswaaij, M. V., and Wuyts,
G. (2005). Aggressive orders and the resiliency of a
limit order market. Review of Finance, 9:201–242.
Giles, J. (2012). Flash crash forecast. New Scientist, 213:21.
Gode, D. and Sunders, S. (1997). What makes markets al-
locaationally efficient? The Quarterly Journal of Eco-
nomics, 112(2):603–630.
Grouard, M., Levy, S., and Lubochinsky, C. (2003). La
volatilit boursire: des constats empiriques aux diffi-
cults d’interprtation. Revue de la Stabilit Financire,
pages 61–79.
Jacobs, B. I., Levy, K. N., and Markowitz, H. M. (2004).
Financial market simulation. The Journal of Portfolio
Management, 30th Anniversary Issue:142–151.
Lee, W. B., Cheng, S.-F., and Koh, A. (2011). Would price
limits have made any difference to the’flash crash’on
may 6, 2010. The Review of Futures Markets, 19(Spe-
cial ifm issue):55–93.
Murphy, J. (1999). Technical analysis of financial markets.
New York Institute of Finance, New York.
Paddrik, M., Hayes, R., Todd, A., Yand, S., Scherer, W.,
and Beling, P. (2012a). An agent basedmodel of the e-
mini s&p 500 and the flash crash. Proceedings of the
2012 IEEE Computational Intelligence for Financial
Engineering and Finance, 1.
Paddrik, M., Hayes, R., Todd, A., Yang, S., Beling, P., and
Scherer, W. (2012b). An agent based model of the e-
mini s&p 500 applied to flash crash analysis. In Com-
putational Intelligence for Financial Engineering &
Economics (CIFEr), 2012 IEEE Conference on, pages
1–8. IEEE.
Vuorenmaa, T. and Wang, L. (2014). An agent-based model
of the flash crash of may 6, 2010 with policy implica-
tions. Working Paper.
Post Flash Crash Recovery: An Agent-based Analysis
197
