
A Microfluidic-based Tactile Sensor for Palpating Mice Tumor
Tissues
Yichao Yang
1
, Garett Johnson
2
, Dean Krusienski
2
, Siqi Guo
3
, Cheng Lin
4
and Zhili Hao
1
1
Department of Mechanical and Aerospace Engineering, Old Dominion University, Norfolk, VA, U.S.A.
2
Department of Electrical and Computer Engineering, Old Dominion University, Norfolk, VA, U.S.A.
3
Center of BioElectrics, Old Dominion University, Norfolk, VA, U.S.A.
4
Department of Engineering Technology, Old Dominion University, Norfolk, VA, U.S.A.
Keywords: Microfluidics, Tactile Sensor, Transducer Array, Tumor Localization, Minimally Invasive Surgery.
Abstract: In light of the need of tissue palpation for Robotics-assisted Minimally Invasive Surgery (RMIS), this paper
presents a microfluidic-based tactile sensor for palpating mice tissues for tumor localization. The core of the
sensor is a 33 sensing-plate/transducer array built into a single polydimethylsiloxane (PDMS)
microstructure, with a transducer spacing of 3.75mm1.5mm. Mounted on a robot, the sensor is pressed
against a tissue region with a pre-defined indentation depth pattern, and consequently the stiffness
distribution across the tissue region translates to the deflection distribution of the sensing-plate array and is
captured by the transducer array underneath as resistance changes. Thus, the recorded data on a tissue
region is the sensor deflection as a function of the indentation depth. While the continuous manner of the
sensor interacting with a tissue region alleviates the error resulting from non-ideal normal contact between
the sensor and the tissue region, the error related to uncertainty in contact point is removed by interpreting
the palpation results in terms of the slope of the sensor deflection versus the indentation depth. Two mice
tumor tissues are palpated using the sensor. After their noise being removed, the raw data on the two tissues
are processed to obtain their slope distribution, the slope error and the percentage error in the slope. The
slope distribution of each tissue clearly illustrates the location of a tumor. The palpation results also indicate
that this sensor can be integrated into a robotic-assisted system for tumor localization.
1 INTRODUCTION
Offering many advantages over open surgeries,
Robotic-assisted Minimally Invasive Surgery
(RMIS) has gained great popularity over recent
years (Girão et al., 2013; Konstantinova et al., 2014;
Schostek et al., 2009; Tiwana et al., 2012 ). With a
RMIS system such as the da Vinci
TM
Surgical
System, (Guthart et al., 2000) and the ZEUS™
Surgical System (Uranues et al., 2002), a surgeon
gets access to an operation site and performs an
operation via robotic-assisted laparoscopic tools
through a small incision. Thus, direct manual
palpation to a tissue region is lost in RMIS. The lack
of tissue palpation not only increases the chance of
tissue trauma/damage, but also limits the application
of RMIS in many complex procedures (Beccani et
al., 2015; Puangmali et al., 2008). Thus, tactile
sensors are resorted to for adding tissue palpation to
RMIS (Puangmali et al., 2008; Trejos et al. 2009).
Up to date, various tactile sensors have been
developed for tissue palpation (Anastassopoulos et
al., 2001; Beccani et al., 2015; Panteliou et al.,
2000). Since a tumor exhibits a much higher
stiffness than its surrounding healthy tissue
(Krouskop et al., 1998), tissue palpation via tactile
sensors translates to acquiring the stiffness
distribution of a tissue region. A tactile sensor is
typically comprised of a mechanical structure to
convert a force to a deflection and a transducer to
register the deflection as an electrical/optical signal.
A tissue region is often considered to have the same
thickness across it and is much larger than the
mechanical structure of a tactile sensor. Thus, the
measured stiffness distribution of a tissue region is
representative of its elasticity distribution
(Anastassopoulos et al., 2001; Konstantinova et al.,
2014). Acquiring the stiffness distribution of a tissue
region can be achieved either by sliding a tactile
sensor over the region or employing a sensor array
Yang, Y., Johnson, G., Krusienski, D., Guo, S., Lin, C. and Hao, Z.
A Microfluidic-based Tactile Sensor for Palpating Mice Tumor Tissues.
DOI: 10.5220/0005705600830092
In Proceedings of the 9th International Joint Conference on Biomedical Engineering Systems and Technologies (BIOSTEC 2016) - Volume 1: BIODEVICES, pages 83-92
ISBN: 978-989-758-170-0
Copyright
c
2016 by SCITEPRESS – Science and Technology Publications, Lda. All rights reserved
83
to concurrently map out the stiffness distribution of
the region (Girão et al., 2013; Konstantinova et al.,
2014; Schostek et al., 2009; Tiwana et al., 2012).
In recent years, quite a few MEMS/microfluidic-
based tactile sensors and sensor arrays have been
incorporated into surgical instruments to enable
surgeons to measure mechanical properties (Dargahi
and Najarian, 2003; Lanfranco et al., 2004; Ottermo
et al., 2006; Su et al., 2012; Talasaz and Patel,
2013;). These studies have greatly advanced the
tactile sensing technology and led to a better
understanding of its application for tissue palpation.
However, two unavoidable misalignment issues
(Wanninayake et al., 2013; Zhao et al., 2013)
(uncertainty in contact point and non-ideal normal
contact) associated with an indiviudal sensor and a
sensor array for tissue palpation severely distort the
genuine stiffness distribution of a tissue region,
yielding false identification of tumors.
To address the misalignment issues, we have
developed a two-dimensional (2D) microfluidic-
based resistive tactile sensor for tissue palpation
(Yang et al., 2015a). The core of the 2D tactile
sensor is one whole PDMS microstructure
embedded with a 3×3 sensing-plate/transducer array.
The distributed deflection acting on the top of the
sensing-plate array translates to geometrical changes
of the transducer array underneath and further
registers as resistance changes. The 2D sensor
features ease of fabrication and performance
robustness (Yang et al., 2015a). Previously, this
sensor has successfully been demonstrated to
measure tissue phantoms with embeded dummy
tumors. As compared with our previous related work
(Yang et al., 2015a), the unique contributions of this
paper are 1) the motion of the sensor is controlled by
a robot to examine the effect of mounting the sensor
on a robot on the palpation results, and 2) two true
animal tumor tissues are palpated to examine
whether the sensor is suitable for tumor localization
of true tumor tissues, instead of well-prepared tumor
tissue phantoms.
2 A MICROFLUIDIC-BASED
TACTILE SENSOR
2.1 Design and Working Principle
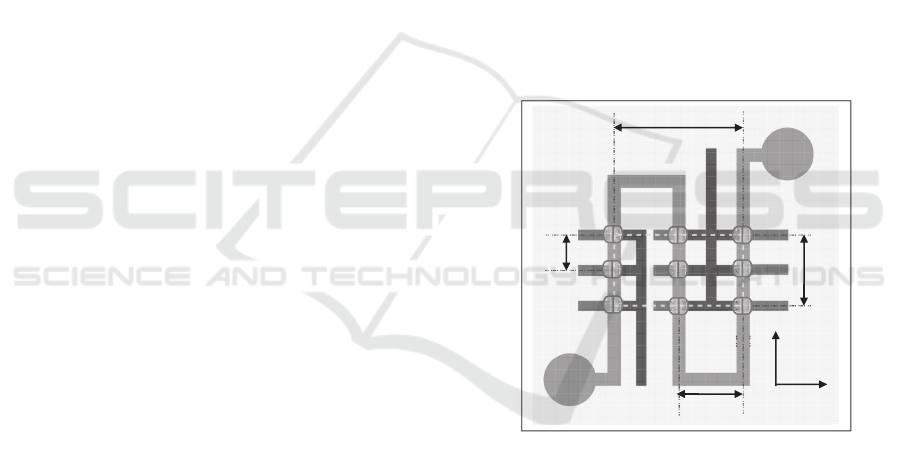
In Figure 1, the configuration of the microfluidic-
based tactile sensor is presented. It consists of a
PDMS microstructure with a 3×3 circular sensing-
plate array at its top and a serpentine-shape
electrolyte-filled microchannel at its bottom. A set
of electrode pairs are distributed along the
microchannel length. The portion of electrolyte
underneath a sensing-plate serves as a resistive
transducer, whose resistance varies with the bottom
deflection of the sensing-plate and is routed out by
the electrode pair. Thus, coincident with the sensing-
plate array, a 3×3 transducer array is realized by one
body of electrolyte in the microchannel and the set
of electrode pairs. Distributed deflection acting on
top of the microstructure translates to the bottom
deflections of the sensing-plates and consequently
causes geometrical changes of the transducer array,
which register as resistance changes. Two reservoirs
at the ends of the microchannel serve as a conduit
for electrolyte to flow in/out during the sensor
operation. The transducer spacing of the sensing-
plate/transducer array is 3.75mm along the x-axis
and 1.5mm along the y-axis, respectively. The
effective sensing region of the sensor is 7.5 mm×3
mm, defined by the distance between the centers of
the sensing-plates at the array sides.
Figure 1: Configuration of a microfluidic-based tactile
sensor: a 3×3 sensing-plate/transducer array built into a
single PDMS microstructure with transducers being
labeled (drawn not to scale for clear illustration).
A standard photolithography fabrication process
for PDMS-based microfluidic devices is employed
to fabricate the sensor. The microstructure is made
of 1:10 PDMS (mixing ratio of cross-linking agent
to base of PDMS Sylgard 184 base). Details about
the sensor fabrication process can be found in the
literature (Gu et al., 2013a). After the sensor is
fabricated, electrolyte, 1-ethyl-3-methylimidazolium
dicyanamide (EMIDCA), is injected into the
microchannel through a hole in the reservoir using a
syringe. The holes are then sealed by 1:10 PDMS to
prevent leakage of electrolyte for flipping the sensor
2d
x
=7.5mm
Input
Reservoir
Microchannel
Sensing
plate
2d
y
=3mm
d
y
A
A
A
B
B
B
C
C
C
O
x
y
d
x
Input
BIODEVICES 2016 - 9th International Conference on Biomedical Electronics and Devices
84
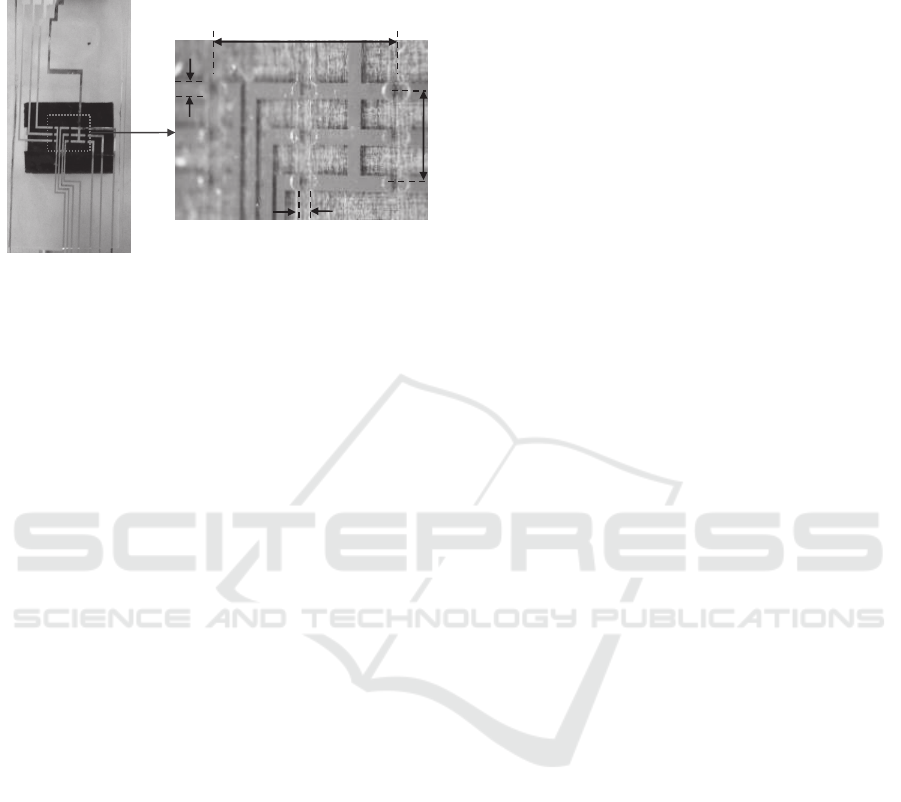
over to palpate a tumor tissue. In Figure 2, the
fabricated sensor and its sensing-plate/transducer
array are shown.
Figure 2: Pictures of (a) the fabricated microfluidic-based
sensor (a black paper is put underneath the sensing-plate
/transducer array for clear illustration) and (b) close-up
view of its sensing-plate/transducer array and electrodes.
2.2 Performance Characterization
The experimental setup (Gu et al., 2013b) used for
characterizing the one-dimensional tactile sensor is
utilized in this work to characterize the performance
of the sensor. The whole experimental setup is
implemented on an optical table. The sensor is first
mounted on a printed circuit board (PCB) for
electrical connections and further fixed on a five-
axis manipulator for better position alignment.
Mounted on a micropositioner, a cylinder probe of
11mm-in-length and 0.8mm-in-diameter is used to
generate distributed deflection on each column of
the transducer array, respectively. Note that the
applied displacement from the cylinder is the same
as the deflection acting on the top of the
microstructure, which translates to the bottom
deflection of the sensing-plate array and is registered
as resistance changes by the transducer array. A six-
axis force/torque sensor (NANO 17, ATI Industrial
Automation) is incorporated into the experimental
setup to monitor the overall force experienced by the
tactile sensor, in response to a deflection input.
To monitor the resistance changes of the
transducer array, a 100 kHz AC voltage with a peak-
to-peak value of 200mv is applied as the common
input to all the transducers. The outputs of the
transducers are connected to their own electronics
with the same design and are converted to DC
voltage outputs, which are recorded by a LabVIEW
program. The resistance changes can be extracted
from the recorded DC voltage outputs (Gu et al.,
2013a). Afterward, the resistance changes can be
used to find out the bottom deflection of the sensing-
plate array (Yang et al., 2015b).
In Figure 3, the average bottom deflection of five
measurements of each sensing-plate column as a
function of the deflection acting at their tops are
presented. A 600µm-indentation depth, z
in
, exerted
on the top of the i
th
sensing-plate translates to a
roughly 12µm-deflection, z
s-i
, at its bottom (As will
be seen in Figure 6). Based on the average slope
relation of the top deflection, z
top-i
, and bottom
deflection, z
s-i
, of the 3×3 sensing-plate array, the
deflection at the top of the sensing-plate, z
top-i
(equal
to z
in
) is approximately related to its bottom
deflection by equation (1).
top i s i
z58z
(1)
The variation in bottom deflection among the
sensing-plates is believed to result from in-plane
misalignment between the sensor and the cylinder
probe, since the fabrication variation in transducer
height and the out-of-plane misalignment between
the sensor and the probe (the probe being tilt toward
one transducer in each column) has been corrected
(Yang et al., 2015b). Consequently, the distributed
deflections, z
top-i
, over the contact surface between
the sensor and the cylinder probe are captured by the
sensor deflection, z
s-i
. Accompanying the applied
distributed deflection, the overall reaction force of
the sensor can be obtained from the readout of the
six-axis force/torque sensor. The relation (F-z
s-i
)
between the overall reaction force, F(N), and the
sensor deflection, z
s-i
(m), is obtained from the
slope value of F and z
s-i
, from a sensing-plate
column and is given by equation (2),
.
s
i
F
0116 z
(2)
the equation can be used to relate the sensor
deflection to the corresponding contact force at a
transducer, which is important for avoiding the
possible damage to a tumor tissue during palpation.
3 MATERIALS AND METHOD
3.1 Tumor Tissue Preparation
Tumor tissues used in this work were stored at -80°C
freezer. The orthotopic mouse breast cancer model
was established by injection of 106 4T1-luc cells in
50µL PBS into the left abdominal mammary gland.
Tumors were measured every 3 to 4 days by a
Caliper and were harvested after one dimension of
tumor reached 15 mm diameter then kept at -80°C
Sensing-plates
2d
x
=7.5mm
C
C
C
B
B
B
A
A
A
0.5mm
(a)
(b)
2d
y
=3mm
0.5mm
A Microfluidic-based Tactile Sensor for Palpating Mice Tumor Tissues
85
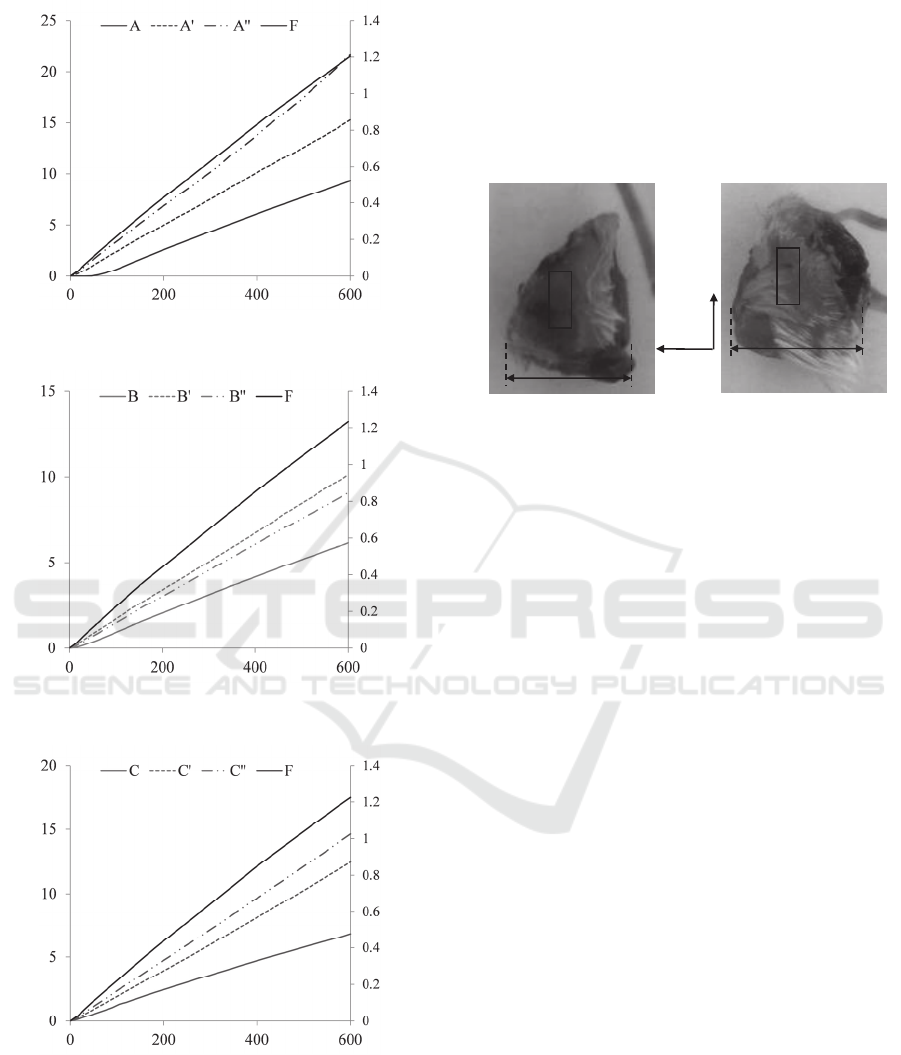
Figure 3: Sensor deflections, z
s-i
, as a function of
indentation depth, z
in
, with a 11mm-long and 0.8mm-in-
diameter cylinder probe above the transducer column (a)
A, A and A (b) B, B and B, (c) C, C and C,
respectively.
freezer. The frozen tumor tissues defrosted at room
temperature for 2 hours to recover tissue flexibility
before the experiment was performed. As shown in
Figure 4, the two prepared mice tumor tissues are
labelled as tumor tissue #1and tumor tissue #2,
respectively. Coincident with the sensing region of
the sensor, the tissue region highlighted in each
tumor tissue is the palpated region.
(a) (b)
Figure 4: Pictures of the prepared mice tumor tissues (a)
tumor tissue #1 and (b) tumor tissue #2.
3.2 Palpation Rationale
The experimental setup for palpating a tumor tissue
using the tactile sensor is shown in Figure 5. With
the sensor mounted on its end effector, a Mitsubishi
RV 3S robot is used to control the motion of the
sensor during palpation. With a displacement
repeatability of 20m, the robot offers the
capability of position control and 6 DOFs of the
sensor. The rest of the setup is the same as the setup
for characterizing the sensor. Additionally, the six-
axis force/torque sensor is incorporated into the
setup for monitoring the accompanying reaction
force of a tumor tissue, in response to an indentation
depth input.
As shown in Figure 6, after being aligned on a
tissue region of a tumor tissue, the tactile sensor is
pressed against the tissue with an indentation depth,
z
in
, and the distributed deflection, z
s-i
, of the sensor
is acquired concurrently. Based on the characterized
relation between the deflection on top of a sensing-
plated and the deflection at its bottom, the top
deflection, z
top-i
, is obtained. Since the sensing-plates
are designed to have the same stiffness, the variation
in bottom deflection among the sensing plates
originates from the stiffness distribution of a tissue
region. Since a tumor is stiffer than its surrounding
healthy tissue, a large deflection at a sensing-plate
indicates the location of the tumor in a tissue.
Additionally, the overall reaction force acting on the
tissue can be used to avoid possible damage to the
tissue during palpation.
Sensing region
(3mm×7.5mm)
16 mm
x
y
O
Sensing region
(3mm×7.5mm)
18 mm
Sensor deflection, z
s
(m) Force, F (N)
Indentation depth, z
in
(m)
(c)
Sensor deflection, z
s
(m)
Force, F (N)
Indentation depth, z
in
(m)
(b)
Sensor deflection, z
s
(m) Force, F (N)
Indentation depth, z
in
(m)
(
a
)
BIODEVICES 2016 - 9th International Conference on Biomedical Electronics and Devices
86
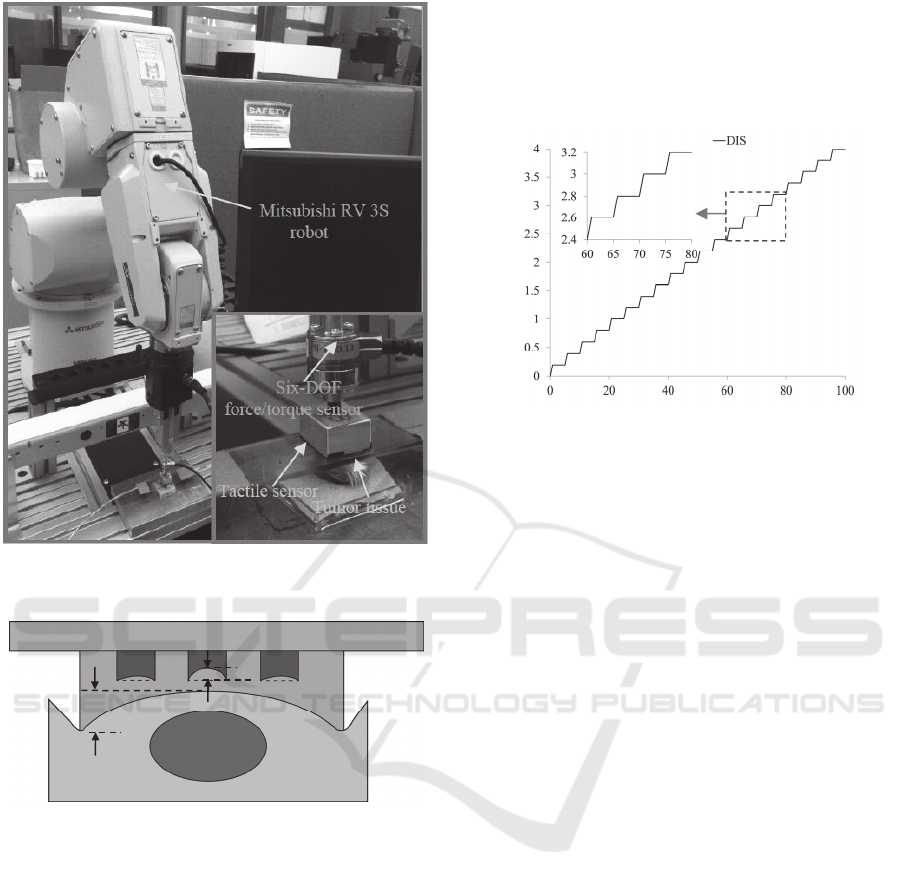
Figure 5: Picture of experimental setup for robotic-assisted
tumor localization.
Figure 6: Schematic of palpation on a tumor tissue via a
2D microfluidic-based tactile sensor (drawn not to scale
for clear illustration).
3.3 Tissue Palpation Protocol
Prior to palpation, the sensor is visually aligned on
the surface of a tissue region with the best
achievable normal contact, via the robotic arm. The
resistances of the sensor after being aligned are
measured and are treated as the initial resistances.
Later on, the resistance change is calculated relative
to the initial resistance for each palpation to
compensate for the performance variations among
the transducers resulting from fabrication variation
and the misalignment. Afterward, the sensor
palpates a tissue region with a pre-defined
indentation pattern. The position of the sensor after
being aligned is treated as its initial position. As
shown in Figure 7, each time the sensor is brought
down to an indentation depth of 0.2mm at a speed of
0.25mm/s and is held at the position for 5s, until
reaching the final indentation depth of 4mm.
Figure 7: Pre-defined indentation pattern, z
in
, for palpating
a tumor tissue via the tactile sensor.
4 MEASURED RESULTS
4.1 Noise Removal
The raw transducer outputs are visibly corrupted
with significant noise. A spectral analysis is
performed on these signals, which reveals broadband
noise that is uncorrelated across the transducers.
Additionally a significant amount of main noise
(60Hz) and its harmonics is also present. To remove
the presence of broadband interference from the
transducer DC voltage outputs, in addition to
removing the mains noise and its harmonics, a 4th
order Chebyschev Type II low pass filter is created
in MATLAB. The Type II filter is chosen as this
minimizes ripples in the passband. A passband
corner frequency of 10Hz is selected because the
robotic arm is not expected to apply a changing
pressure at a rate greater than ten times per second.
A 40dB decrease in the stopband power was
specified. In order to minimize the edge effects
inherent in any digital filtering, the first sample is
used to initially populate the entire filter structure.
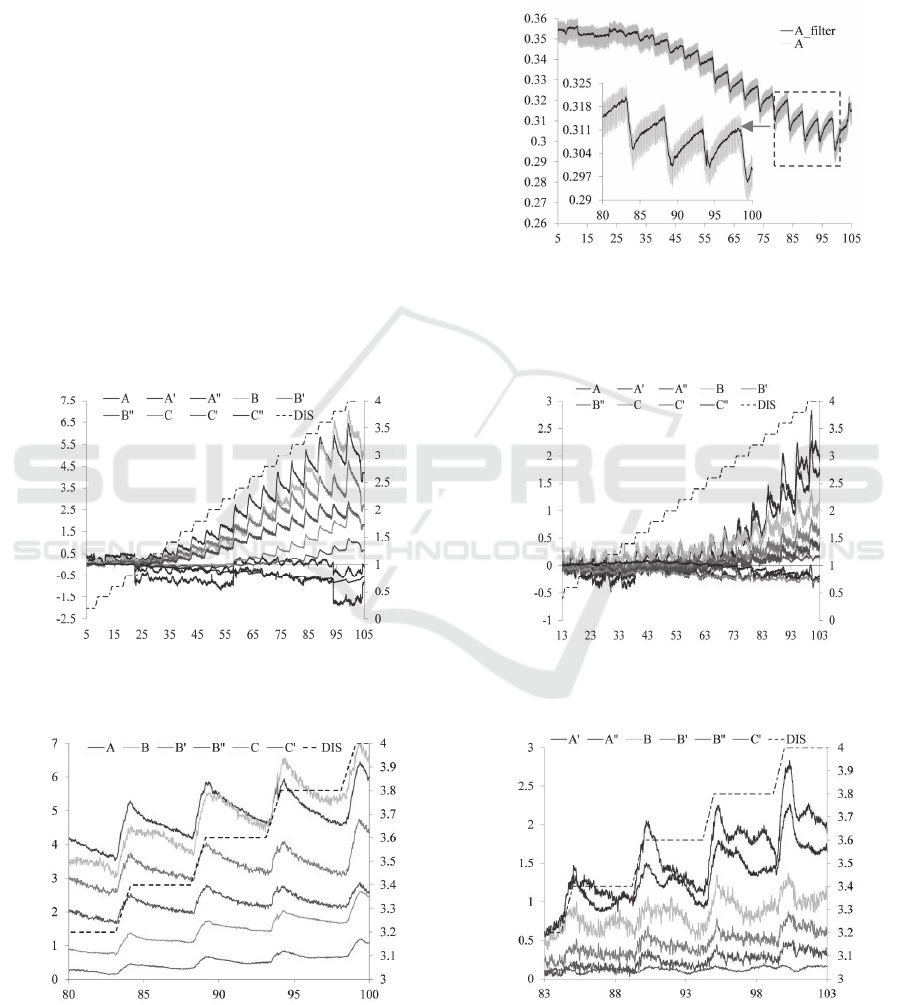
For illustrating the effectiveness of the low pass
filter, comparisons of the raw signal of DC voltage
output of transducer A, denoted as “A”, with the
signal after filtering, denoted as “A_filter”, from the
measured results on tumor tissue #1 are presented in
Figure 8. The signal appears significantly cleaner
after employing the low pass filter. The originally
recorded transducer voltage outputs on the two
Indentation depth, z
in
(mm)
Substrate
Microstructure
Tumor
Tissue
C B A
z
top-i
z
s-i
Time, t (s)
A Microfluidic-based Tactile Sensor for Palpating Mice Tumor Tissues
87
tumor tissues are all processed by the same noise
removal algorithm.
4.2 Measured Deflection/ Depth Slope
Distribution for Tumor
Localization
In Figure 9, the measured distributed deflection of
the sensor on the two tumor tissues as a function of
time, together with the indentation depth, are
described. Since the LabVIEW program for
collecting the data from the sensor starts prior to the
program for controlling the robot, the end time of
the data acquisition is longer than 100 seconds. As
can be seen in Figure 9(a), the transducers, A and B,
display larger deflection than the rest transducers,
while the transducers, A and A exhibit larger
deflection than the rest transducers in Figure 9(b).
Figure 9(c) and 9(d) illustrate the sensor deflection
of selected transducers in a short time span.
Evidently, the relaxation behaviour (viscosity)
during the hold time varies between the two tumor
tissues, with tumor tissue #1 being less viscous.
Although the same sensor and the same setup are
used to palpate the two tumor tissues, the results on
tumor tissue #2 are dramatically noisier than the
Figure 8: Comparison of the DC voltage, V
DC
, output of
transducer A of the 2D tactile sensor as a function of time.
(a) (b)
(c) (d)
Figure 9: Distributed defelction, z
s
, of the tactile sensor as a function of time, t, on the measured results of (a), (c)tumor #1
and (b), (d)tumor #2, respectively.
Time, t (s)
Sensor deflection, z
s
(
m)
Indentation depth, z
in
(mm)
Time, t (s)
Sensor deflection, z
s
(m)
Indentation depth, z
in
(mm)
Time, t (s)
Sensor deflection, z
s
(
m)
Indentation depth, z
in
(mm)
Time, t (s)
Sensor deflection, z
s
(m)
Indentation depth, z
in
(mm)
DC Voltage, V
DC
(V)
Time, t (s)
BIODEVICES 2016 - 9th International Conference on Biomedical Electronics and Devices
88
results on tumor tissue #1, simply because the tumor
tissue #2 is soft and thus the sensor works in its
lower end of deflection range, as will be seen later
on.
To alleviate the error associated with uncertainty
in contact point, the slope of sensor deflection, z
s
,
and indentation depth, z
in
, is used to represent the
stiffness distribution of a tissue region and
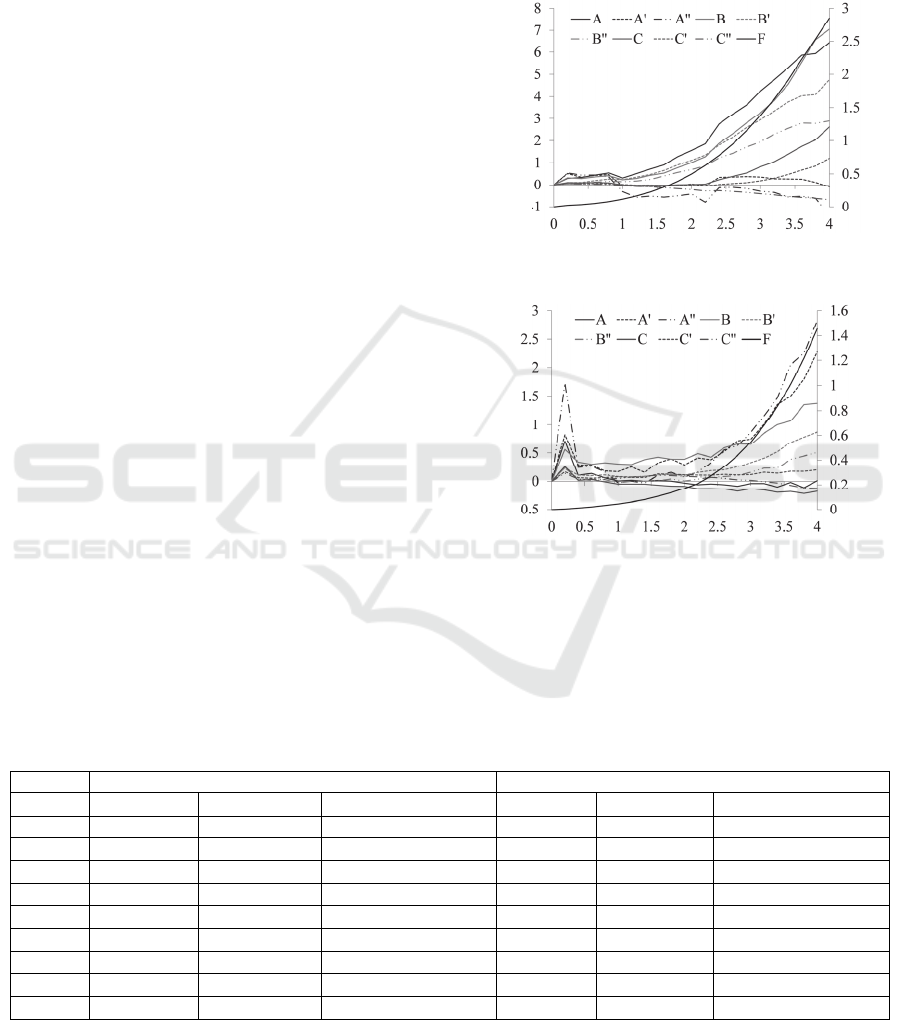
consequently localize a tumor. The measured sensor
deflection and the overall palpation force as a
function of indentation depth are shown in Figures
10(a) and 10(b). Under the same indentation depth,
the palpation force of tumor tissue #2 is much
smaller than that of tumor tissue #2, indicating that
tumor tissue #2 is softer than tumor tissue #1. The
palpation results need to be illustrated in a
convenient and straightforward manner. Toward this
end, the slope, z
s
/z
in
(m/mm), of sensor deflection,
z
s
, and indentation depth, z
in
, the slope error and the
percentage error in the slope, (z
s
/z
in
)/(z
s
/z
in
), with
the one in bold font indicating the highest slope, are
summarized in Table 1. To minimize the
measurement errors at the lower end of the sensor’s
deflection range, the indentation depth ranges of
1.5mm~4mm and 2.5mm~4mm are used to extract
the slopes for the tumor tissues #1 and #2,
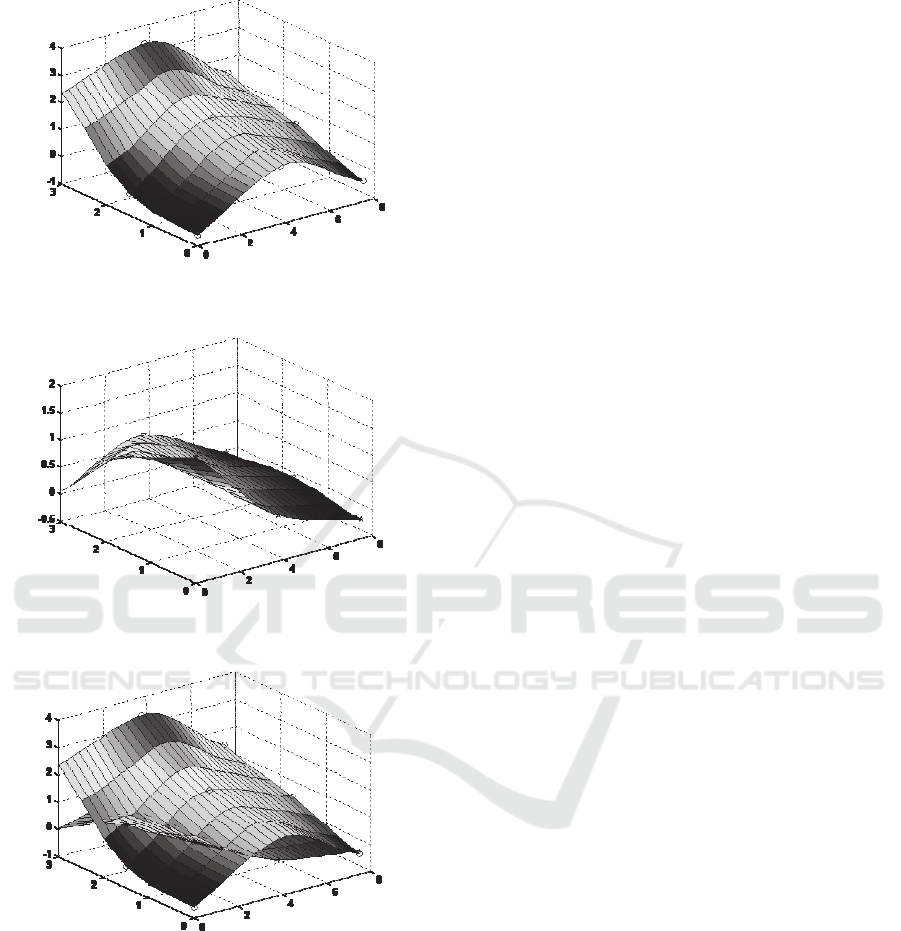
respectively. Based on the slope values of the
transducer array in Table 1, color maps are
generated on the tumor tissues, as shown in Figure
11. These color maps utilize the visual color to
indicate the levels of localized slope experienced by
the sensor, with red indicating the highest slope and
blue indicating the lowest slope. As can be seen in
Figure 11(a), the transducer B displays a much
larger slope than the rest transducers, indicating that
the tumor embedded in tissue #1 is located at the site
of this transducer. In contrast, the transducer A
exhibits a much larger slope than the rest transducers
in Figure 11(b), implying that the tumor is at the site
of this transducer. Since the two tumor tissues have
similar surface profiles with similar small curvatures,
(a)
(b)
Figure 10: Distributed deflection, z
s
, and the overall
palpation force, F, of the tactile sensor as a function of the
indentation depth, z
in
, on the measurements of (a) tumor
#1 and (b) tumor #2, respectively.
Table 1: Measured deflection/depth slope (z
s-i
/z
in
), slope error ((z
s-i
/z
in
)) and percentage error in the slope ((z
s-i
/z
in
)/(z
s-
i
/z
in
)) of two tumor tissues via a 2D microfluidic-based tactile sensor.
Tumor #1 Tumor #2
z
s-i
/z
in
(z
s-i
/z)
(z
s-i
/z)/(z
s-i
/z)
z
s-i
/z
in
(z
s-i
/z) (z
s-i
/z)/(z
s-i
/z)
A 2.375 0.092 3.9% 0.030 0.046 153.8%
A
-0.232 0.057 24.7% 1.295 0.113 8.7%
A
-0.626 0.140 22.3%
1.833 0.111 6.0%
B
3.355 0.194 5.8%
0.673 0.063 9.4%
B
1.777 0.075 4.2% 0.541 0.027 5.0%
B
1.123 0.081 7.2% 0.352 0.030 8.5%
C 1.446 0.098 6.7% -0.035 0.023 63.8%
C
0.709 0.080 11.3% 0.072 0.012 16.1%
C
-0.263 0.007 2.5% -0.142 0.013 9.1%
Indentation depth, z
in
(m)
Force, F (N) Sensor deflection, z
s
(
m)
Force, F (N) Sensor deflection, z
s
(
m)
Indentation depth, z
in
(m)
A Microfluidic-based Tactile Sensor for Palpating Mice Tumor Tissues
89
(a)
(b)
(c)
Figure 11: Color maps based on the slopes, (z
s
/z
in
, m/mm)
of sensor deflection, z
s
, versus indentation depth, z
in
, on
the two tumor tissues (a) tumor tissue #1, (b) tumor tissue
#2 and (c) comparison of the two tumor tissues.
it can be concluded that the slope distribution
represents the stiffness distribution of a tumor tissue,
instead of its surface profile. In Figure 10(a),
transducer A has a larger deflection than transducer
B, but the deflection of transducer A does not
increase with the indentation depth as fast as the
deflection of transducer B. This indicates that
transducer A is located at a tissue site higher than
the rest tissue sites, but this tissue site has a lower
stiffness than that of transducer B. As such, using
the slope distribution is more accurate for tumor
localization. The comparison between the two
tissues in Figure 11(c) evidently illustrates that
tumor tissue #1 is stiffer than tumor tissue #2, which
is consistent with the conclusion drawn from the
overall palpation force difference in Figure 10.
Here, some practical concerns about using this
2D tactile sensor for tissue palpation are discussed.
First, as compared with those tactile sensor arrays or
individual sensors for tissue palpation, this 2D
sensor is much more immune to misalignment errors,
simply because one whole PDMS microstructure
with embedded transducer array palpates a tissue
region in a continuous manner and thus similar small
tilt angles are formed across the transducer array.
Second, the surface profile may introduce some
variation in the slopes across a tissue region. Both
tumor tissues contain a slightly convex surface
profile, which is not expected to yield a high slope at
the center of the tissue region. However, a convex
surface profile with a small radius of curvature may
give rise to false identification of a tumor at the
center. As such, in the future, the effect of the
surface profile of a tissue region needs to be
removed from the measured slopes. Third, to
minimize the percentage error in the slope, the
sensor design needs to be tailored so that the
stiffness of the sensor matches the stiffness of the
tissue region. Then, the difference in the slope
across a tissue region can more accurately capture
the genuine stiffness distribution of the region.
Lastly, since we know beforehand that each of the
two tissues contains a tumor, we attribute the
measured highest slope in a tissue region to the
existence of a tumor. In practice, where a tissue
region under palpation contains a tumor is not
known beforehand, both the surface profile and
experimental errors may cause a higher slope at a
site on a tissue region than the rest sites. As such, a
threshold value on the slope difference in a tissue
region needs to be established for accurate tumor
identification. This threshold value needs to factor in
the elasticity of a tissue itself and the tumor
variables (i.e., elasticity, size and depth).
5 CONCLUSIONS
In this paper, a 2D microfluidic-based tactile sensor
is mounted on a robot and utilized to palpate two
C
C
Slope, z
s
/z
in
(m/mm)
A
C
A
A
y (mm)
B
B
B
x (mm)
A
A
A
B
Slope, z
s
/z
in
(m/mm)
B
C
C
C
x (mm)
Slope , z
s
/z
in
(m/mm)
A
C
y (mm)
x (mm)
B
B
A
B
A
C
C
y (mm)
BIODEVICES 2016 - 9th International Conference on Biomedical Electronics and Devices
90

mice tumor tissues. The sensor entails a 3×3
sensing-plate/transducer array built into a single
PDMS microstructure. The distributed deflection
acting on the top of the sensing-plate array translates
to resistance changes of the transducer array
underneath. The continuity of the sensing-plate array
configuration overcomes the varying tilt angles
across a tissue region encountered by an individual
sensor or a sensor array, thus avoiding distorting the
genuine stiffness distribution of the tissue region. In
palpating a mice tissue, the input is the indentation
depth controlled by the robot and the output is the
sensor deflection at the locations of the transducer
array.
Although the robot introduces a significant
amount of noise to the recorded dada, a noise filter is
able to effectively remove the noise, indicating that
the sensor is feasible to be integrated into a robotic-
assisted system. The palpation results are interpreted
in terms of the slope distribution of the sensor
deflection versus indentation depth, with the highest
slope indicating the location of a tumor. Although
the two mice tissues have similar surface profiles,
the slope distribution varies dramatically between
them and thus is believed to arise from the existence
of tumors in them, validating the feasibility of using
this sensor for palpating true tumor tissues. Future
work will focus on improving the sensor design with
a suitable working deflection range to reduce slope
errors and reducing the sensor size for fitting in
RMIS. In addition, more tissue samples will be
measured using the presented detection method to
verify its repeatability.
ACKNOWLEDGEMENTS
The authors would like to acknowledge the financial
support for this work from the National Science
Foundation, CMMI, under Grant No. 1265785.
REFERENCES
Anastassopoulos, G. T., Lytras, J. G., Sunaric, M. M.,
Moulianitis, V. C., Panteliou, S. D., Bekos, A.,
Kalinderis, N. and Hatzichristou, D., 2001. Optical
device for prostate cancer detection. In 6th National
Congress of Mechanics (p.381).
Beccani, M., Di Natali, C., Benjamin, C. E., Bell, C. S.,
Hall, N. E. and Valdastri, P., 2015. Wireless tissue
palpation: Head characterization to improve tumor
detection in soft tissue. Sensors and Actuators A:
Physical, 223, pp.180-190.
Dargahi, J. and Najarian, S., 2003. An integrated force-
position tactile sensor for improving diagnostic and
therapeutic endoscopic surgery. Bio-medical materials
and engineering, 14(2), pp.151-166.
Girão, P. S., Ramos, P. M. P., Postolache, O. and Pereira,
J. M. D., 2013. Tactile sensors for robotic
applications. Measurement, 46(3), pp.1257-1271.
Gu, W., Cheng, P., Ghosh, A., Liao, Y., Liao, B., Beskok,
A. and Hao, Z., 2013a. Detection of distributed static
and dynamic loads with electrolyte-enabled distributed
transducers in a polymer-based microfluidic device.
Journal of Micromechanics and Microengineering,
23(3), p.035015.
Gu, W., Cheng, P., Palmer, X. L. and Hao, Z., 2013b.
Concurrent spatial mapping of the elasticity of
heterogeneous soft materials via a polymer-based
microfluidic device. Journal of Micromechanics and
Microengineering, 23(10), p.105007.
Guthart, G. and Salisbury Jr, J.K., 2000. The intuitive™
telesurgery system: Overview and application. In
International Conference on Robotics and Automation
(pp. 618-621).
Konstantinova, J., Jiang, A., Althoefer, K., Dasgupta, P.
and Nanayakkara, T., 2014. Implementation of tactile
sensing for palpation in robot-assisted minimally
invasive surgery: A review. Sensors Journal, IEEE,
14(8), pp.2490-2501.
Krouskop, T. A., Wheeler, T. M., Kallel, F., Garra, B. S.
and Hall, T., 1998. Elastic moduli of breast and
prostate tissues under compression. Ultrasonic
imaging, 20(4), pp.260-274.
Lanfranco, A. R., Castellanos, A. E., Desai, J. P. and
Meyers, W. C., 2004. Robotic surgery: a current
perspective. Annals of surgery, 239(1), p.14.
Ottermo, M. V., Øvstedal, M., Langø, T., Stavdahl, Ø.,
Yavuz, Y., Johansen, T. A. and Mårvik, R., 2006. The
role of tactile feedback in laparoscopic surgery.
Surgical Laparoscopy Endoscopy & Percutaneous
Techniques, 16(6), pp.390-400.
Panteliou, S. D., Sunaric, M. M., Sarris, J.,
Anastassopoulos, G., Lytras, J. and Hatzichristou, D.
G., 2000. Design of a device for the objective
assessment of the mechanical properties of the prostate
gland. In International Conference on Role of
Mesomechanics for the Development of Science and
Technology.
Puangmali, P., Althoefer, K., Seneviratne, L. D., Murphy,
D. and Dasgupta, P., 2008. State-of-the-art in force
and tactile sensing for minimally invasive surgery.
Sensors Journal, IEEE, 8(4), pp.371-381.
Schostek, S., Schurr, M. O. and Buess, G. F., 2009.
Review on aspects of artificial tactile feedback in
laparoscopic surgery. Medical Engineering & Physics,
31(8), pp.887-898.
Su, Z., Fishel, J. A., Yamamoto, T. and Loeb, G. E., 2012.
Use of tactile feedback to control exploratory
movements to characterize object compliance.
Frontiers in neurorobotics, 6.
Talasaz, A. and Patel, R. V., 2013. Integration of force
reflection with tactile sensing for minimally invasive
A Microfluidic-based Tactile Sensor for Palpating Mice Tumor Tissues
91

robotics-assisted tumor localization. Haptics, IEEE
Transactions on, 6(2), pp.217-228.
Tiwana, M. I., Redmond, S. J. and Lovell, N. H., 2012. A
review of tactile sensing technologies with
applications in biomedical engineering. Sensors and
Actuators A: physical, 179, pp.17-31.
Trejos, A. L., Jayender, J., Perri, M. P., Naish, M. D.,
Patel, R. V. and Malthaner, R. A., 2009. Robot-
assisted tactile sensing for minimally invasive tumor
localization. The International Journal of Robotics
Research.
Uranues, S., Maechler, H., Bergmann, P., Huber, S.,
Hoebarth, G., Pfeifer, J., Rigler, B., Tscheliessnigg, K.
H. and Mischinger, H. J., 2002. Early experience with
telemanipulative abdominal and cardiac surgery with
the Zeus™ Robotic System. European Surgery, 34(3),
pp.190-193.
Wanninayake, I. B., Dasgupta, P., Seneviratne, L. D. and
Althoefer, K., 2013. Air-float palpation probe for
tissue abnormality identification during minimally
invasive surgery. Biomedical Engineering, IEEE
Transactions on, 60(10), pp.2735-2744.
Yang, Y., Shen, J. and Hao, Z., 2015a. A two-dimensional
microfluidic-based tactile sensor for tissue palpation
application under the influence of misalignment. In
ASME 2015 International Technical Conference and
Exhibition on Packaging and Integration of Electronic
and Photonic Microsystems collocated with the ASME
2015 13th International Conference on Nanochannels,
Microchannels, and Minichannels(pp.V003T05A001-
V003T05A001). American Society of Mechanical
Engineers.
Yang, Y., Shen, J. and Hao, Z., 2015b. A two-dimensional
(2D) distributed-deflection sensor for tissue palpation
with correction mechanism for its performance
variation. under review.
Zhao, S., Parks, D. and Liu, C., 2013. Design and
Modeling of a Wide Dynamic-Range Hardness Sensor
for Biological Tissue Assessment. Sensors Journal,
IEEE, 13(12), pp.4613-4620.
BIODEVICES 2016 - 9th International Conference on Biomedical Electronics and Devices
92
