
Hybrid SSVEP/P300 BCI Keyboard
Controlled by Visual Evoked Potential
Felipe Alberto Capati, Rodrigo Prior Bechelli and Maria Claudia F. Castro
Centro Universit
´
ario da FEI, Av. Humberto de A. C. Branco, 3972, 09850-901, S
˜
ao Bernardo do Campo, S
˜
ao Paulo, Brazil
Keywords:
BCI, SSVEP, P300, Evoked Potential, Visual Stimulus, LDA, SVM, FFT.
Abstract:
This paper presents a two stage Brain Computer Interface (BCI) keyboard system that consumes Electroen-
cephalography (EEG) signals based on two evoked potential detection methods: P300 and Steady-State Visual
Evoked Potential (SSVEP). In order to develop a practical daily use EEG system, signals were captured with
a standard low cost Emotiv-EPOC system and processed using OpenViBE platform. Fast Fourier Transform
(FFT) and sample average were used as feature extraction methods while Linear Discriminant Analysis (LDA)
and Support Vector Machine (SVM) were used as classifiers.
1 INTRODUCTION
A system based on Brain Computer Interface (BCI)
acquire signals from brain functioning in order to use
this information to actuate on computer and it’s pe-
ripherals. This work rely on Electroencephalogram
(EEG).
As a clinical method, EEG is used to mea-
sure electrical potentials from electrode positioned at
scalp. Several waves, originated from excited and
inhibited alternate potentials, produces an extracel-
lular current flow at cortex brain, at certain levels
that it is possible to detect with superficial electrodes
(Costanzo, 2014).
Using an specialized acquisition software it is pos-
sible to store these signals to determine special as-
pects, classify and relate to a mental state. One spe-
cial aspect defined by these signals and detected under
a certain circumstances is the Evoked Potential (EP).
The EP is a physiological brain response determined
by an external visual, electrical or auditive stimulus.
As described by Chaves et al. (2009), different recep-
tors may be excited and the acquired signal is a sum
of different EP.
The P300 is a positive visual EP with a latency
time of approximately 300 ms. However, there is an
experimental variation with respect to time latency of
250 ms to 600 ms depending on cognitive effort in-
vested by the user attention to the visual event, pa-
tients with neurological diseases and possible neu-
rodegeneration (Majaranta, 2011).
The evoked potential signal amplitude depends
on the stimulus frequency, as pointed by Majaranta
(2011): less frequent stimulus presents larger ampli-
tudes; more frequent stimulus produces lower ampli-
tudes.
Steady-State Visual Evoked Potentials are concen-
trated in the visual cortex located in the occipital lobe
and are induced by flash light at a predetermined fre-
quency. The SSVEP’s are formed by a number of
components whose frequencies are harmonics of the
frequency of stimuli (Majaranta, 2011).
The evoked potential communication between the
operator and the computer is binary in the sense of
having just two operating states. For example, a de-
vice is on or off, move left or right providing a discrete
controller (Middendorf et al., 2000).
Figure 1 illustrates system operation in SSVEP or
P300 and the expected response in the brain regions
activated by each stimulus.
SSVEP
P300
Parietal Lobe
Occipital Lobe
Figure 1: System Illustration.
The classical model for a virtual keyboard adopt-
ing P300 was introduced by Farwell and Donchin
(1988), known as ”Row, Column” (RC), consists in a
6 by 6 matrix that contains the alphabet and the Arabic
numerals. The rows and columns of this matrix flash
214
Capati, F., Bechelli, R. and Castro, M.
Hybrid SSVEP/P300 BCI Keyboard - Controlled by Visual Evoked Potential.
DOI: 10.5220/0005705202140218
In Proceedings of the 9th International Joint Conference on Biomedical Engineering Systems and Technologies (BIOSTEC 2016) - Volume 4: BIOSIGNALS, pages 214-218
ISBN: 978-989-758-170-0
Copyright
c
2016 by SCITEPRESS – Science and Technology Publications, Lda. All rights reserved
randomly in order to provide an evoked potential, in
that way, you can know which row and column the
user is looking, corresponding to their choice (Amiri
et al., 2013).
The RC model has a serious problem due to prox-
imity of the keys. Theoretically, one light pulse near
the chosen region should not generate an EP that can
be classified as the target letter. But this is not true
when analyzing the event in practice. The ”Region
Based” model (RB) proposed in Fazel and Abhari
(2009) significantly reduces this problem due the way
it is structured.
The RB model is composed of two steps, the first
step identifies one of keyboard seven regions by light
pulses delimited by a circumference that groups the
chosen region. After identifying the region, the sec-
ond step identifies the target letter by independent
light pulses generated by each letter in the chosen re-
gion.
In order to compare a pure BCI (P300 only) with
hybrid BCI (P300 and SSVEP) virtual keyboard in
a RC configuration, Townsend et al. (2010) demon-
strate that a pure BCI setup had a RC bit rate of 19.85
bits/min with RC accuracy of 77,34% and Yin et al.
(2014) presented for a hybrid BCI a RC bit rate of
53.06 bits/min with RC accuracy superior of 95%.
Result rates are considerably higher in a hybrid BCI
setup.
It is possible to create a hybrid system that in-
tegrates multiple BCI techniques working sequen-
tially or simultaneously but not limited to only
two techniques as discussed here. For example,
Slow Cortical Potentials (SCP), Event Related De-
synchronization (ERD) or Event Related Synchro-
nization (ERS) (Amiri et al., 2013) can be used for the
development of hybrid systems that will try, as possi-
ble, maximize positive point and minimize negative
point of each technique.
The proposed interface model and design resem-
bles the hybrid system described by Yin et al. (2014)
that defines an analysis combining hybrid systems
using the ”Row, Column” (RC) model and ”Region
Based” (RB) processing techniques.
This paper propose a keyboard layout with a fo-
cus on usability employing a standard QWERTY key-
board that can be used by people who already used a
keyboard, those who never used and those that can
not use such device. As a probabilistic model, this
interface is well suited for all users.
2 MATERIAL AND METHODS
The development of this BCI system is based on a se-
quential hybrid system. The first protocol of acquisi-
tion is defined by SSVEP method and second by P300
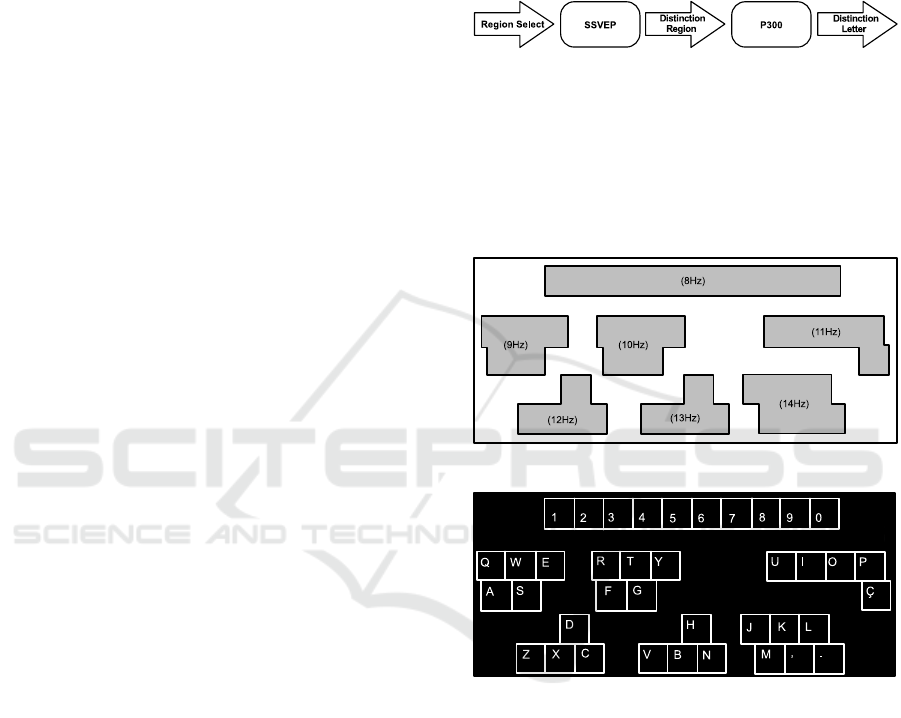
as presented in Figure 2.
Figure 2: Hybrid System Sequence Application.
The first step is defined by the use of SSVEP to
identify a single target among seven distinct regions
in the keyboard detailed in Figure 3. Once the region
is identified, the second step is specified via P300; a
single key within the defined region as presented in
Figure 4.
Figure 3: Frequency Map Region for SSVEP.
Figure 4: Virtual Keyboard Layout.
The purpose is to optimize and to reduce the issues
experienced with the exclusive use of P300, due to
the proximity of the virtual keys on the keyboard that
generate undesirable EP signals, SSVEP was used to
build the system interface based on regions proposed
in Fazel and Abhari (2009).
The SSVEP is commonly designed for applica-
tions that require a high number of input variables.
Difference between the minimum frequency which
can be detected is 0.2 Hz, the field of application is
usually in the range between 5 Hz to 50 Hz. (Amiri
et al., 2013).
There is a dependency between the frequency of
stimulation and amplitude of SSVEP. In Amiri et al.
(2013), the authors demonstrate the relationship of
frequencies and amplitudes. This relation is not linear
Hybrid SSVEP/P300 BCI Keyboard - Controlled by Visual Evoked Potential
215
and the greatest amplitudes occur between 12 and 15
Hz. Amiri et al. (2013) also describe that it is possi-
ble to choose the frequency band based on the signal
amplitude: the greater the amplitude, easier to capture
and interpret the signal.
Apart from signal amplitude aspect, there are two
other variables to be considered. The first, describe
the frequency range between 15 Hz and 25 Hz with
good signal reading, but there is a higher risk for pa-
tients having photo- induced seizures. The second
is directly related to the Visual Flickering Limit Fre-
quency with regard to the image luminance modula-
tion frequency noticed by the user. The frequency
ranges from 15 Hz to 100 Hz and depends on the
lighting conditions, the vision (peripheral or central)
field, the apparent angle of the object and the individ-
ual characteristics (Stolfi, 2008).
Stolfi (2008) also described that for the lumines-
cence levels found in computer monitors, the Visual
Flickering Limit Frequency is near 70 Hz and that
there is a greater chance to occur visual fatigue to
the user as higher as the difference between maxi-
mum and operation flickering frequency (Amiri et al.,
2013).
Amiri et al. (2013), cite that the best frequencies to
work are the lowest. These frequencies provide larger
amplitudes that may offer better performance during
the classification step. However, lower frequencies
also can cause some discomfort to the user. In Figure
3 is indicated the operating frequencies for each of the
regions.
The Emotiv EPOC (Emotiv, 2011) is used to cap-
ture EEG signals. The entire interface was built us-
ing OpenViBE (Renard et al., 2010) platform and
customized with Python (Oliphant, 2007; P
´
erez and
Granger, 2007) program language. The process flow
is:
1. User choose a letter and it should look closely at
it;
2. acquisition of EP signals;
3. preprocessing (FFT is used for SSVEP and aver-
age for P300);
4. classification and recognition of EP (SVM is used
for SSVEP and LDA for P300);
5. feedback process at the touch of previously cho-
sen key;
6. EEG signal is filtered from 1 Hz to 20 Hz in order
to prepare data for classification.
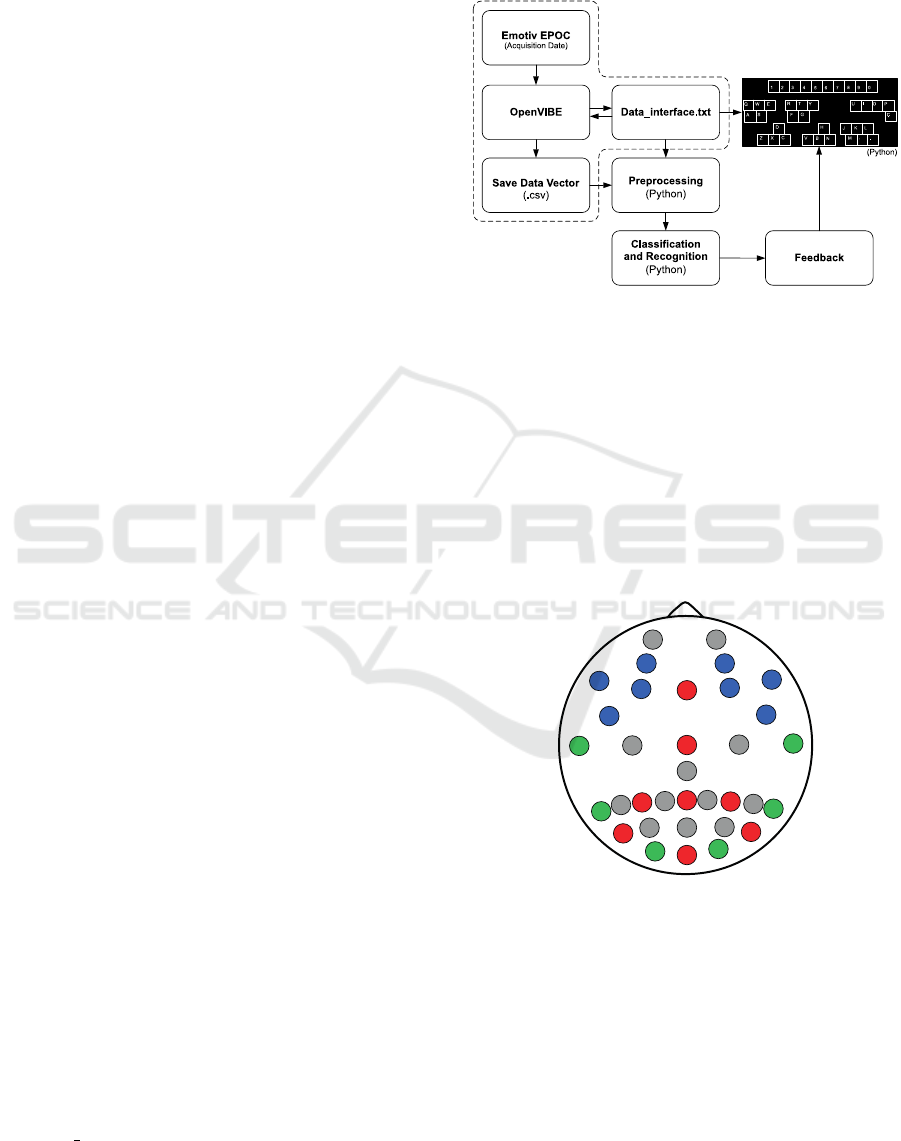
The keyboard was developed in Python and con-
nected to an OpenViBE box that send control data
to ”Data interface” file. The preprocessing, classi-
fication and recognition of EP was developed using
Python as well. All sequence processing is detailed in
figure 5 (the dotted region was made with OpenViBE
and the other was made in Python).
Figure 5: Project Model.
As a more accessible equipment, with respect to
cost, Emotiv EPOC has only 14 electrodes located at
specific regions. For the analysis of P300 there is the
recommendation to use an occipital electrode in the
mid-line, 5 cm above the inion, and occipital elec-
trodes right and left, each 5 cm lateral to the mid- line
electrode (Duffy et al., 1999). Figure 6 is a map that
contains electrodes that are usually used to capture
the P300 in red, and in green the Emotiv EPOC elec-
trodes closer to this positions, and in blue other EPOC
electrodes.
Oz
Pz
P2
Cz
P3
P1
P5
P7
O1
O2
P4
P6
P8
C4
C3
T7
T8
Fz
F3
F7
F4
F8
PO8
Cpz
Fp1 Fp2
PO7
PO3
POz
PO4
FC5
FC6
AF3 AF4
Figure 6: EEG Electrode Map Position.
The Emotiv EPOC was previously used for P300
acquisition as described in Ekanayake (2010), where
the author concludes that the Emotiv EPOC can in-
deed capture signals from the P300 for scientific pur-
poses and also certify the ability of this device to cap-
ture signals from the SSVEP.
All tests were developed with Matlab, Python
and OpenViBE. Experimental data for the analysis of
P300 were:
• Flash duration: 0.1 s
BIOSIGNALS 2016 - 9th International Conference on Bio-inspired Systems and Signal Processing
216

• Standby time without flash: 0.5 s
• Number of samples: 10
• Number of repetitions: 1
• Filter 1 to 20Hz
After specify this settings, it was used the average
calculus described in Equation 1 for the first analysis.
In Equation 1: “X” is the data matrix; “a” is the
number of samples “b” is the window analysis; “M” is
the average matrix; “y” is the average vector position
to y ≤ b:
M
1,y
(X
a,b
) =
n
∑
i=0
X
i,y
n
(1)
For SSVEP analysis it was used a frequency of 10
Hz and a filter with a 1 Hz to 20 Hz and 1 second time
window for the FFT.
A normal volunteer participate in 10 experimental
sessions to train and validate acquired data in separate
P300 and SSEVP acquisition.
3 RESULTS AND DISCUSSION
Making a comprehensive analysis of Figure 7, the
electrodes that better detect a P300 signal are O1, O2
and P7 positions with a window time ranging from
250 ms to 450 ms showing responses very close to
the expected P300 curve.
Also the electrodes P7 and O2 (mainly P7) contain
a signal range that is similar to the P300, but contain a
lot of noise. Figure 7 confirms the fact of being able to
capture good signals from the P300 (low noise) using
the O1 electrode Emotiv EPOC.
T7
T8
P7
P8
O1
O2
P300 Analysis
Time (t) [s]
Voltage (V) [uV]
0.1 0.2 0.3 0.4 0.5 0.6
-20
-15
-10
-5
0
5
10
15
20
25
30
Figure 7: P300 Analysis.
The noise retrieved from the electrode P7 and O2
are residual background activities that can be atten-
uated using averaging technique (Equation 1) which
enhances EP and reduces the noise from the number
of repetitions of the stimulus.
Brain residual activity can be considered random
compared to the EP; the averaging enhances P300 sig-
nal compared to the residual activity, that have a vari-
able pattern.
Table 1: Evoked Activity Enhancement (adapted of (Duffy
et al., 1999)).
Stimulus Signal/Noise
Repetition Intensification
10 3.16:1
25 5:1
49 7:1
81 9:1
100 10:1
200 14.14:1
Figure 8: SSVEP Analysis Target.
Figure 9: SSVEP Analysis No Target.
The experimental analysis for 10 Hz SSVEP is
presented in Figures 8 and 9. Figure 8 shows the elec-
trodes O1, O2 and P8 peaked at 10 Hz proving the
capacity of the Emotiv EPOC to capture signals from
the SSVEP. However, Figure 9 shows other electrodes
(P7, T7, T8) that display noise.
The P300 is usually captured by electrodes in the
parietal lobe CPZ and PO7 (Majaranta, 2011) or Fz,
Cz, Pz, Oz, PO7, P3, P4 and PO8 (Amiri et al., 2013)
not available in Emotiv EPOC device. It was exper-
imentally proven that the electrodes O1, O2 and P7
(for P300) and O1, O2 and P8 (for SSVEP) have use-
ful EP with Matlab post processing.
Hybrid SSVEP/P300 BCI Keyboard - Controlled by Visual Evoked Potential
217

4 CONCLUSION
The P300 is used when there are many different vari-
ables in the system. However, the influence of a pulse
near the point of choice creates an undesirable EP and
affect the proper functioning of the classifier. The
proposed interface reduced processing time and in-
creased hit rates as previously reported in Yin et al.
(2014).
The combination of the two EP techniques re-
duces processing time when the user has picked the
letter as discussed in Yin et al. (2014). With the lay-
out shown in Figure 4 the letter select time is reduced
with the usability of a standard QWERTY keyboard
and the time to write of a word with the system is also
reduced.
A future experiment is in development to include
healthy and disabled subjects in a single P300 and
SSEVP sessions.
ACKNOWLEDGEMENTS
This study was produced with FEI, CAPES and
FAPESP funding.
REFERENCES
Amiri, S., Rabbi, A., Azinfar, L., Fazel-Rezai, R., and
Asadpour, V. (2013). A Review of P300, SSVEP,
and Hybrid P300 / SSVEP Brain- Computer Interface
Systems. Brain-Computer Interface Systems - Recent
Progress and Future Prospects, 2013:1–8.
Chaves, M. L. F., Finkelsztejn, A., and Stefani, M. A.
(2009). Rotinas em neurologia e neurocirurgia.
Artmed Editora.
Costanzo, L. (2014). Fisiologia. Elsevier Brazil, 5 edition.
Duffy, F. H., Iyer, V. G., and Surwillo, W. W. (1999).
Eletroencefalografia Cl
´
ınica e Mapeamento Cerebral
Topogr
´
afico: Tecnologia e Pr
´
atica. Revinter Ltda, 1
edition.
Ekanayake, H. (2010). P300 and Emotiv EPOC: Does
Emotiv EPOC capture real EEG? Web publication
http://neurofeedback. visaduma. info/ . . . , page 16.
Emotiv, S. (2011). EMOTIV EPOC: Brain Computer Inter-
face & Scientific Contextual EEG.
Farwell, L. a. and Donchin, E. (1988). Talking Off the Top
of Your Head. electroencephalography and clinical
Neurophysiology, 70(6):510–523.
Fazel, R. and Abhari, K. (2009). A region-based
P300 speller for brain-computer interface. Cana-
dian Journal of Electrical and Computer Engineering,
34(3):81–85.
Majaranta, P. (2011). Gaze Interaction and Applications
of Eye Tracking: Advances in Assistive Technologies:
Advances in Assistive Technologies. Premier reference
source. Medical Information Science Reference.
Middendorf, M., McMillan, G., Calhoun, G., and Jones,
K. S. (2000). Brain-computer interfaces based on the
steady-state visual-evoked response. IEEE Transac-
tions on Rehabilitation Engineering, 8(2):211–214.
Oliphant, T. E. (2007). SciPy: Open source scientific tools
for Python. Computing in Science and Engineering,
9:10–20.
P
´
erez, F. and Granger, B. E. (2007). IPython: A system for
interactive scientific computing. Computing in Sci-
ence and Engineering, 9(3):21–29.
Renard, Y., Lotte, F., Gibert, G., Congedo, M., Maby, E.,
Delannoy, V., Bertrand, O., and L
´
ecuyer, A. (2010).
OpenViBE: An Open-Source Software Platform to
Design, Test, and Use Brain–Computer Interfaces in
Real and Virtual Environments.
Stolfi, G. (2008). Percepc¸
˜
ao Visual Humana. Apostila 2 –
Televis
˜
ao Digital. pages 1–13.
Townsend, G., LaPallo, B., Boulay, C., Krusienski, D.,
Frye, G., Hauser, C., Schwartz, N., Vaughan, T.,
Wolpaw, J., and Sellers, E. (2010). A novel P300-
based brain–computer interface stimulus presentation
paradigm: Moving beyond rows and columns. Clini-
cal Neurophysiology, 121(7):1109–1120.
Yin, E., Zhou, Z., Jiang, J., Chen, F., Liu, Y., and Hu,
D. (2014). A speedy hybrid BCI spelling approach
combining P300 and SSVEP. IEEE Transactions on
Biomedical Engineering, 61(2):473–483.
BIOSIGNALS 2016 - 9th International Conference on Bio-inspired Systems and Signal Processing
218
