
Sensory Glove and Surface EMG with Suitable Conditioning
Electronics for Extended Monitoring and Functional Hand
Assessment
Giovanni Saggio, Giancarlo Orengo and Alberto Leggieri
Department of Electronics Engineering, Tor Vergata University, via Politecnico 1, 00133, Rome, Italy
Keywords: Sensory Glove, Surface EMG, Finger Movements.
Abstract: We propose and evaluate a new method for measuring and discriminating among flexion, extension,
abduction and adduction movements of hand fingers. In particular, flex sensors allowed registering flexion-
extension movements, whereas data from multi-channel surface electromyography (sEMG) electrodes
allowed discriminating adduction-abduction movements of thumb, index and middle fingers. An electronic
interface was designed to acquire and pre-process signals feeding a Personal Computer (PC), running
indigenously made routines for data recording, visualization and storing. A novel test for repeatability and
reproducibility was also proposed and successfully adopted.
1 INTRODUCTION
Sensory glove is defined as a supporting glove
equipped with sensors aimed to measure hand
assessment. But the hand is a masterpiece of
dexterity with 27 degrees of freedom (DOFs), as
determined by a widely adopted kinematic hand
model (Lin et al., 2000). Therefore, usually, only a
subset of DOFs is considered, and a complete 27
DOFs sensory glove is rarely realized. Those 27
DOFs include flexion/extension of the fingers’ joints
(i.e. the phalanges come closer/away together),
abduction/adduction between fingers (i.e. the
movements that bring one finger away and close
from the adjacent), and rotational/translational
capabilities of the wrist.
Among all, the abduction/adduction movements
have been found to be the most difficult to measure.
This is because flexion/extension and
rotational/translational capabilities can be measured
directly with a flex sensor lying on-top of the finger
or of the wrist skin surfaces, but the same approach
is not possible to reveal abduction/adduction
capabilities.
To overcome the problem, the commonly
adopted solution is to arrange a strip rectangular flex
sensor upright the dorsal aspect of two adjacent
fingers (Figure 1), and not between the fingers, as it
would be preferable, but impracticable to avoid
grasping limitations. This upright arrangement of the
flex sensor can suffer from mechanical instability
(since possible misplacements of the sensor during
usage) and a subsequent too poor measurement
accuracy, therefore here we propose to adopt surface
electromyography (sEMG) sensors rather than flex
ones.
Figure 1: Strip rectangular flex sensor upright the dorsal
aspect of two adjacent fingers to measure
abduction/adduction angles.
In practice, we propose a combination of flex
sensors and sEMG sensors for overall functional
hand assessment, In fact, sEMG reveals all
movements, so that, subtracting flexion-extension
measures (obtained from flex sensors), we can
obtain the measure of the abduction/adduction
capabilities.
206
Saggio, G., Orengo, G. and Leggieri, A.
Sensory Glove and Surface EMG with Suitable Conditioning Electronics for Extended Monitoring and Functional Hand Assessment.
DOI: 10.5220/0005704702060213
In Proceedings of the 9th International Joint Conference on Biomedical Engineering Systems and Technologies (BIOSTEC 2016) - Volume 4: BIOSIGNALS, pages 206-213
ISBN: 978-989-758-170-0
Copyright
c
2016 by SCITEPRESS – Science and Technology Publications, Lda. All rights reserved
For simplification purpose, our attention was
limited to the first three finger movements, which
are necessary to accomplish the most important tasks
of human hand. The sEMG signals were collected by
four couples of differential electrodes positioned on
the right hand.
Data coming from both flex and sEMG sensors
fed an Arduino microcontroller board connected to a
PC. Ad-hoc PC running software was developed to
represent the finger posture.
The sensory system is described in the second
section of the paper, the electronic interface in the
third section, the procedures used during the
measurement sessions with their results in the fourth
section, discussion and conclusions in the last
section.
2 MEASUREMENT SYSTEM
2.1 Sensory Glove
Sensory gloves have been gaining more and more
relevance in literature, even if the cost, the
calibration procedure and the need of different size
(to fit different hands) have limited their diffusion in
clinical protocols (Gentner and Classen, 2009).
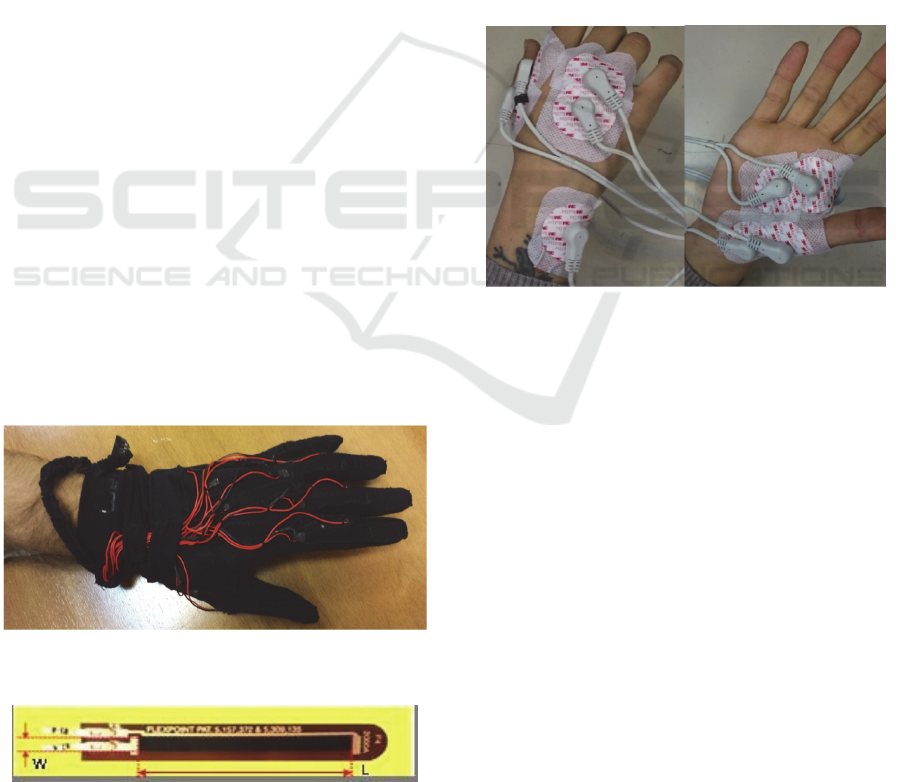
The sensory glove (Figure 2) used in this work
has characteristics already reported (Saggio et al.,
2012). It is equipped with 14 flex sensors (Figure 3,
by Flexpoint Sensor Systems Inc. South Draper UT,
USA), already reviewed in (Saggio et al., 2015), for
flex-extension of all the fingers’ joints, but we
limited our attention to only the three sensors on the
metacarpo-phalangeal joints of thumb, index and
middle finger.
Figure 2: Lycra-based glove. Signals from only three flex
sensor were used in this work.
Figure 3: Flex sensor from Flexpoint.
2.2 Surface EMG
Signal acquisition from sEMG sensors is rather
simple, but decoding data can be challenging,
because signal parameters (e.g. amplitude,
frequency) are not easily linkable to subcutaneous
effects. For example, the mean frequency is
generally related to the muscle fatigue, even if it is
not yet clear if the shift toward low frequencies is
related to the speed decrease of muscular fibers
(Merletti et al., 1990) rather than to the employment
of slower motor units (Rau et al., 2004). The
measure of muscular strength is often associated
with the signal amplitude, even if it also depends on
the electrode position and size with respect to the
muscle, as well as the distance between electrodes.
Moreover, cross-talk between different muscles adds
noise to signal parameters measurement (Rau et al.,
2004).
Figure 4: Location of 4 the couples of differential sEMG
electrodes. The two couples of electrodes to register the
index FDI, the middle TDI and the reference electrode on
the wrist are shown on the leftmost photo, whereas the two
couples for the thumb TA and STA on the rightmost. The
cuff increases the sensor adherence to skin.
The use of sEMG to measure finger movements
is mostly applied to prosthesis control by amputated
people (Gentner and Classen, 2009; Riillo et al.,
2014), positioning electrodes on the forearm and
getting sEMG signals from extrinsic hand muscles.
On the other hand, discrimination of finger
movements by mean of sEMG signals associated
with intrinsic muscle fatigue is still an unexplored
research field, so much that even international
recommendations have not yet provided instructions
about electrode positioning for this kind of muscles.
As a novelty, sEMG electrodes were positioned on
the hand, in this case, to allow the measurement of
abduction/adduction fingers’ movements.
The sEMG electrodes used in this application are
the “3M Red Dot” with circular shape and 60mm
Sensory Glove and Surface EMG with Suitable Conditioning Electronics for Extended Monitoring and Functional Hand Assessment
207
diameter, their position as in Figure 4. sEMG sensor
couples, for differential measures, were attached to
skin surface, each along the center of the relative
muscular fiber: the first dorsal interosseus (FDI,
which controls the index adduction) and the third
dorsal interosseus (TDI, which controls the middle
adduction), on the hand span, and the short thumb
abductor (STA) and the thumb adductor (TA), on the
hand back.
The reference electrode on the wrist provides a
common reference to the patient and to an adopted
differential amplifier, to drive the isolated patient to
a positive voltage respect to ground, and to reduce
the 50 Hz interference from the power line. This
electrode needs to be located on a neutral region as a
bond, not affected by the voltages created by
metabolic activity. According to SENIAM
recommendations (Stegeman and Hermens, 2007), it
was located on the carp pisiform bond.
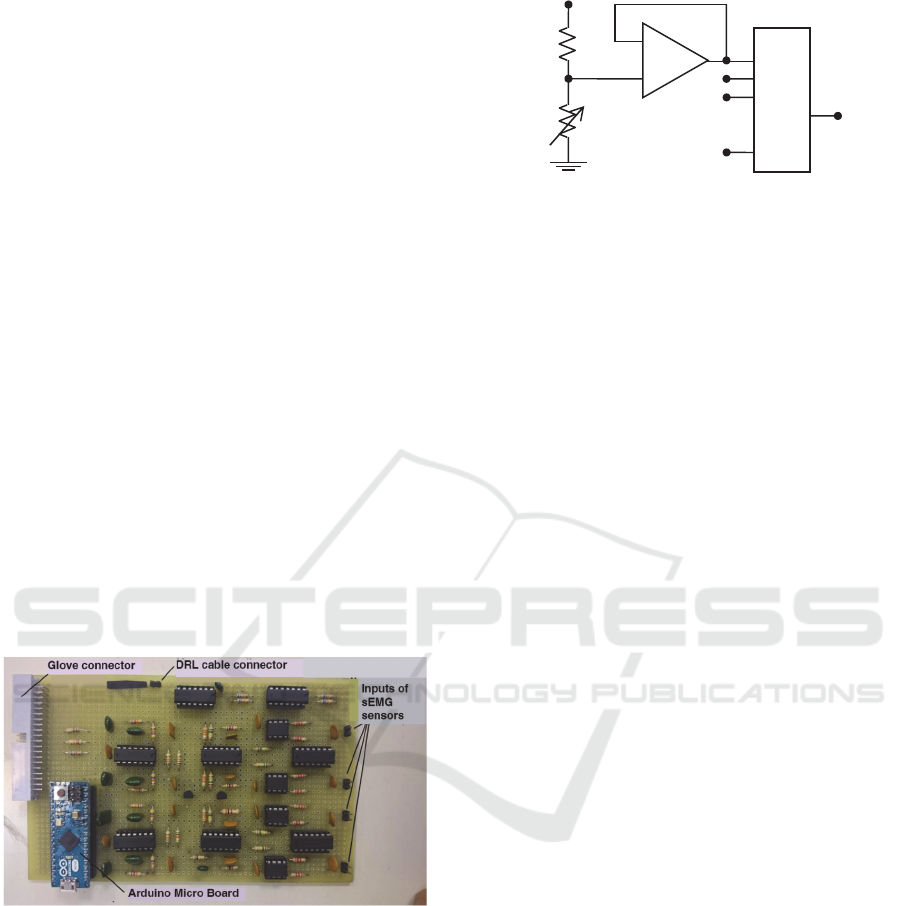
3 ELECTRONIC INTERFACE
The electronics interfaced sensors with PC. It based
on analog amplifiers connected to the analog inputs
of an Arduino-based microcontroller device (by
Smart Projects, Strambino, Torino, Italy) (Figure 5),
5V supplied via PC USB.
Figure 5: Stripboard of the electronic interface.
3.1 Flex Sensor Interface
Flex sensors are capable to change their resistance
when bent. The output resistance of each sensor was
converted into voltage values by means of voltage
dividers (Figure 6), whose fixed resistances were
calculated in (Saggio et al., 2012). After a buffering
stage with an operational amplifier (OA), the voltage
values are connected to the analog input A4, A5 and
A6 of Arduino for the three fingers, respectively.
Figure 6: Schematic of the glove sensors electronic
interface.
3.2 SEMG Interface
The first stage of a biopotential amplifier is an
instrument differential amplifier (INA) with high
CMRR. Electrical interference induced from the
power line, or originating from other sources of
biopotentials in more remote parts of the body, are
detected simultaneously by both electrodes and were
rejected by the first stage of the INA as common-
mode signals. The chosen INA was the INA114 (by
Burr Brown, Tucson, Arizona, USA), which features
single supply mode and very high input impedance.
It is dc-coupled to the electrodes via current-limiting
resistors and fault current limiters.The ground path
for the input bias current is therefore the body itself.
Although the INA114 has 115dB of CMRR, it
decreases at a rate of 20dB/dec, becoming too low to
reject strong common-mode RF signals beyond
100kHz. These random interference signals can also
generate dc offset through RF rectification, which,
amplified by the following gain stages, causes
response errors and even saturation of solid-state
devices.Therefore, the voltage gain of the INA was
adjusted to 12 only, planning to yield the required
gain with the following stage.
The body induced voltage from 50Hz main
causes a displacement current through the patient,
resulting in a common-mode voltage between the
two recording electrodes and theamplifier common.
This can be reduced twisting and shielding the
electrode leads. Figure 7 shows a model of all the
coupling capacitances and their calculated values
(Neuman, 1978). Moreover, asymmetry in the two
electrode impedances, due to random contact
variations, transform a common-mode voltage into a
differential one. Since the electrode impedance
cannot be enough low, the noise signal is normally
higher than the sEMG signal, which is in the range
0.1-1mV (Neuman, 1978). The common practice is
to add a further electrode on the patient. But instead
to connect this electrode to the amplifier reference
voltage, causing a dispersion current to arise and a
voltage to drop on the electrode resistance (useful to
+
V
BIAS
Arduino
R
sen
R
ref
out
in1
in2
in3
inN
BIOSIGNALS 2016 - 9th International Conference on Bio-inspired Systems and Signal Processing
208

difference the two reference voltages) (Neuman,
1978), it was connected to the driven-right-leg
circuit (DRL) in a feedback loop. This is because in
ECG systems it is effectively connected to the
patient right leg through another electrode, whereas
in sEMG systems is connected to the wrist,
according to SENIAM recommendations (Stegeman
and Hermens, 2007). In this way, the common-
voltage is attenuated by the amplifier gain with
respect to a direct connection.
Figure 7: Circuit schematic of the parasitic coupling
capacitances and the driven-right-leg circuit connecting
the patient to the amplifier reference voltage to eliminate
the 50 Hz noise.
In order to eliminate the so called “baseline
noise” (a slow oscillation of the average signal
value) which, together with movement artefacts, is
considered a main noise source from electrodes,
added to RF rectification and 1/f noise originated by
the INA, a dc suppression circuit (Figure 8) were
inserted after the INA amplifier.
Figure 8: Output dc suppression circuit.
The integrator in the feedback loop provides ac-
coupling with the following amplifier, thus changing
the signal baseline with its reference voltage
(Spinelli et al., 2003). The cutoff frequency was
chosen, according to suggestions of International
bodies (Stegeman and Hermens, 2007), equal to
10Hz.
The INA114 is followed by the second
amplifying stage, a non-inverting low-pass
amplifier, configured to obtain 460Hz bandwidth
and a voltage gain of 180. It employs a
TLC25L4ACN operational amplifier (by Texas
Instrument, Texas, USA), which operated in single
5V supply mode.
Finally, a dc restoration circuit, composed of a
buffered RC high-pass filter, with a cutoff frequency
of 10Hz, is used to guarantee a dc level equal to
2.5V, as required by the Arduino analog-to-digital
converter (ADC).
The power spectral density (PSD) of EMG
signals is within 5-500Hz, but for sEMG is allowed
even less bandwidth. The overall performance of the
band-pass analog interface is then a 2160 voltage
gain with 12Hz and 460Hz cutoff frequencies, given
a 1kHz sampling frequency of the ADC.
The frequency response of the second stage
amplifier, however, features only 20dB/dec of
selectivity, which is too low for an anti-aliasing
filter. For this reason, a Butterworth filter was
realized, based on a second order Sallen-Key cell
with 40dB/dec attenuation (Figure 9). The cutoff
frequency of 150Hz was to provide 20dB attenuation
@ 470Hz (a higher degree filter would provide more
attenuation but less smooth time response and
unacceptable transients). The full schematic of the
sEMG interface is shown in Figure 10.
Figure 9: Second order anti-aliasing Butterworth filter.
Figure 10: Schematic of the 4-channel electronic interface
for sEMG sensors.
Sensory Glove and Surface EMG with Suitable Conditioning Electronics for Extended Monitoring and Functional Hand Assessment
209

3.3 Digital Interface
For signal conditioning, signal dc offset was set to
2.5V, which was also chosen as the patient reference
voltage, given through the reference electrode.
Therefore, this voltage represents the signal ground
for the circuit.
Data were conditioned by an Arduino Micro
board, based on an ATmega32u4 (by Atmel
Corporation, San Josè, California, USA)
microcontroller device.
In order to maximize the communication speed,
data were stored in a 14 byte register (2 byte each
10-bit value), and send as binary data (Serial.write()
command) without ASCII conversion (Serial.print()
command) every one millisecond. Arduino Micro
sends its data to the computer at a speed of 400kbps.
A Matlab application was developed to record
and save the data in text files, setting the baud rate to
460800 bps, the buffer length, and specifying the
data length (two bytes always positive) according to
the script uint16. The code reads 100 records at the
same time, each corresponding to a 10-bit digitalized
voltage printed by Arduino on the serial port, and
plots them in real time. The effective voltage is
obtained from its digital value from the equation
V=5N/1023.
Further noise was detected on the resulting
signal, which was filtered through a digital band-
pass Butterworth filter, with a low cutoff frequency
of 20Hz, and a high cutoff frequency of 495Hz, to
attenuate the high frequency harmonics generated by
the sampling process. The root mean square (RMS)
value is then calculated on a window of 300
samples, shifting it by 75 samples each time.
4 sEMG MEASUREMENTS
In this section data registration and modeling of
sEMG static measurements of abduction/adduction
posture of the thumb, index and middle fingers are
presented. Data were acquired from six able-bodied
subjects, 3 male (M1,M2,M3) and 3 female
(F1,F2,F3), five right-hand and one left-hand, each
one using his/her dominant hand.
Measurement results from different subjects
show a remarkable spread. Then assessment of
sEMG activity needs to be each time calibrated on
the subject. A personal characterization session was
defined to this purpose, where the number of
measurements were reduced as much as a provided
tolerance is still guaranteed by the extracted model.
At this point, the measurement session related to a
particular task can be start.
4.1 Wise Test
Since the novelty of our approach, a new test to
evaluate the repeatability and reproducibility of
finger abduction/adduction movement assessment
was created. It was based on the Wise test provided
for flexion/extension measurement, used to evaluate
the performance of the electronic gloves (Gentner
and Classen, 2009; Dipietro et al., 2003).
It consisted in placing and re-placing the hand in
known postures always with the glove and sEMG
sensors donned, to evaluate measurement
repeatability, and placing and re-placing the hand in
known postures after donning and doffing the
sensors, to evaluate the measurement
reproducibility. In particular, the postures were a)
flat hand with closed fingers (starting posture), b)
flat hand with 20° thumb abduction, c) flat hand
with 10° index abduction, d) flat hand with 10°
middle abduction.
A further posture with the maximal voluntary
contraction (MVC) is also drawn for each finger.
The three abduction angles to be measured are far
from the MVC reported in Table 1, then easily
performed and repeated by each subject (Merletti et
al., 1990), which had to open the fingers up to the
chosen abduction angle and hold it for 2s, during
which the sEMG signals are registered, then back to
the starting posture, where the resting sEMG signals
are recorded. This task was repeated 10 times with a
rest interval of 10s between them. After this
sequence, the subject was asked to perform
abduction to the MVC for each finger, in order to
identify a regression of the sEMG signal intensity
against the abduction angle with three points, that is
0°, 10° and MVC. Finally a data block is created.
This procedure is repeated 10 times with a resting
period of 3min each time. In order to evaluate the
repeatability, the same sEMG sensors were used to
measure the two positions (0°-10°), performing task
A-C, whereas the sEMG sensor were changed after
each sequence to evaluate the reproducibility (task
B-D).
Table 1: MCV values for index and middle abduction.
subject M1 M2 M3 F1 F2 F3
index 25 25 30 30 15 20
middle 25 25 30 30 25 20
Each block is composed of 2000 elements, obtained
from the RMS value of the signal samples registered
BIOSIGNALS 2016 - 9th International Conference on Bio-inspired Systems and Signal Processing
210
during the resting intervals. The first 25 samples
were eliminated, because affected by movement
artefacts, and the RMS value is calculated on the
next 150 samples.
From the total mean ̅
of the 10 blocks of the
test, and the standard deviation of all the blocks of
measurements, the uncertainty of measurements can
be expressed as ̅
2
⁄
, from which the test
results were measured through the normalized
standard deviation (percentage) , that is the ratio
between standard deviation and the total mean value.
It ranges from 8.28%, corresponding to 10°
0.414° (FDI-testA-F2), to 21.1% (FDI-testB-F1),
corresponding 10° 1.06°. The results for the
middle finger are 0.6° (TDI-testA) and 1.15°
(TDI-testB). Results for test B (0° abduction)
without sEMG signals are generally worst, because
the baseline measurement is more affected by noise.
4.2 Regression Models
To characterize the abduction/adduction angles
against the RMS value of the sEMG signal, more
data points are needed than two used for the Wise
test. For this purpose, a hinge with a fixed and a
mobile arm was inserted between the couple of
fingers under measurement, in order to provide a
finger posture with the right abduction angles,
ranging from 0° to the MVC, with a 5° step. The
mobile arm of the hinge was moved by a Trinamic
step motor driven by a Labview interface. Although
the hinge could be seen as a constrain, the subject
was asked to provide the same strength as if the
hinge would not be used.
Although regression models should allow
obtaining the abduction/adduction angle from the
measured voltage, as independent variable, it would
be hard to yield models from not always univocal
relations. On the other hand, if the independent
variable is the angle step, as in this case, good fitting
results can be yield. The inverse function can be
obtained through a numerical algorithm, because the
regression functions are hardly ever invertible.
Different regression models were tried to
interpolate the available data, either polynomial
models from the linear one to fifth degree, and the
monomial/binomial exponential models, which are
described in Equations (1) and (2). Each model was
statistically evaluated by mean of the
coefficient,
which computes the correlation degree between data
and model points.
(1)
(2)
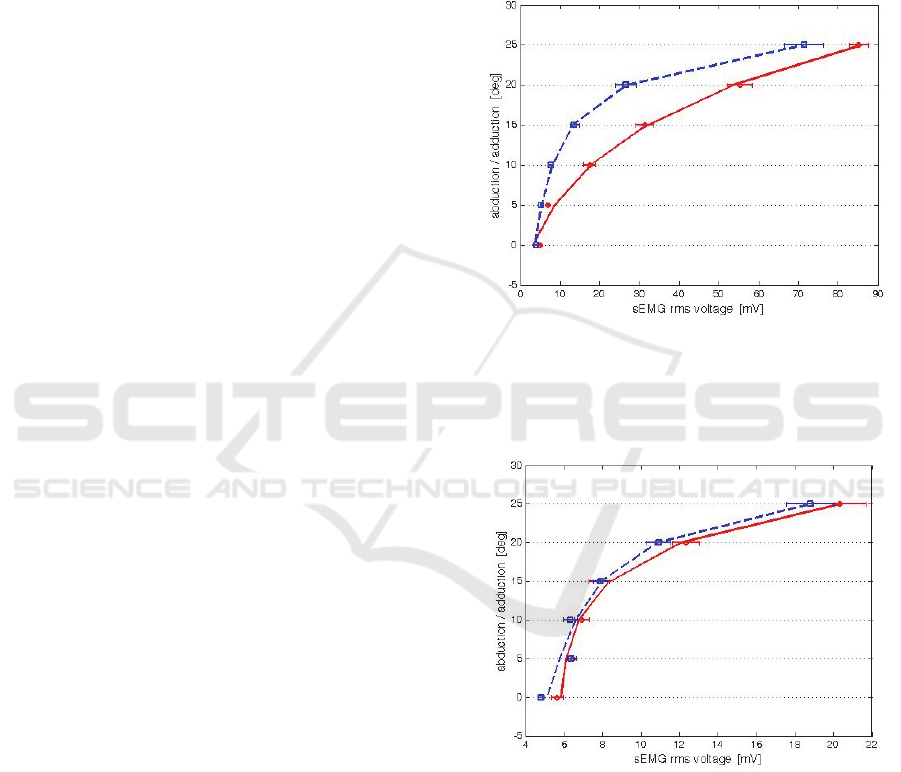
4.2.1 Index/Middle Abduction/Adduction
The measurement of the sEMG voltage, representing
the muscle fatigue, against the imposed angle is
reported in Figures 11 and 12 for the FDI (index)
and the TDI (middle), respectively, here limited to
subject M1 for sake of brevity.
Figure 11: FDI sEMG assessment for subject M1 of
middle abduction (red circle) and adduction (blu square)
with standard deviation segments, superimposed to the
corresponding binomial exponential regression models
(continuous for abduction and dashed for adduction).
Figure 12: TDI sEMG assessment for subject M1 of
middle abduction (red circle) and adduction (blu square)
with standard deviation segments, superimposed to the
corresponding binomial exponential regression models
(continuous for abduction and dashed for adduction).
The measurement of the abduction and the
adduction movements are represented with different
symbols. The difference between the muscle fatigues
in the two phases is marked more for the FDI than
TDI in all subjects. Figures also report the measure
Sensory Glove and Surface EMG with Suitable Conditioning Electronics for Extended Monitoring and Functional Hand Assessment
211
of the standard deviation, whose results are
summarized in Table 2, as mean value between the
six subjects, and compared with the corresponding
ones from the test.
Taking into account the regression R
2
parameter
reported in Table 3, the linear model demonstrated
to be not suitable to represent the voltage/angle
relation. The performance of the binomial
exponential regression model is also plotted in each
figure.
Table 2: Comparison of the mean normalized standard
deviation between subjects.
FDI TDI
Wise test 10.88% 11.17%
Hinge meas 10.87% 10.56%
Table 3: Comparison of
correlation coefficient for five
polynomial and two exponential regression models of
index FDI and middle TDI measurements.
FDI TDI
model abduct adduct abduct adduct
1
s
t
0.91 0.71 0.76 0.79
2
nd
1 0.95 0.96 0.95
3
rd
1 0.99 1 1
4
th
1 1 1 1
5
th
1 1 1 1
mon. 0.99 0.99 0.90 0.92
bin. 0.99 0.99 0.99 0.99
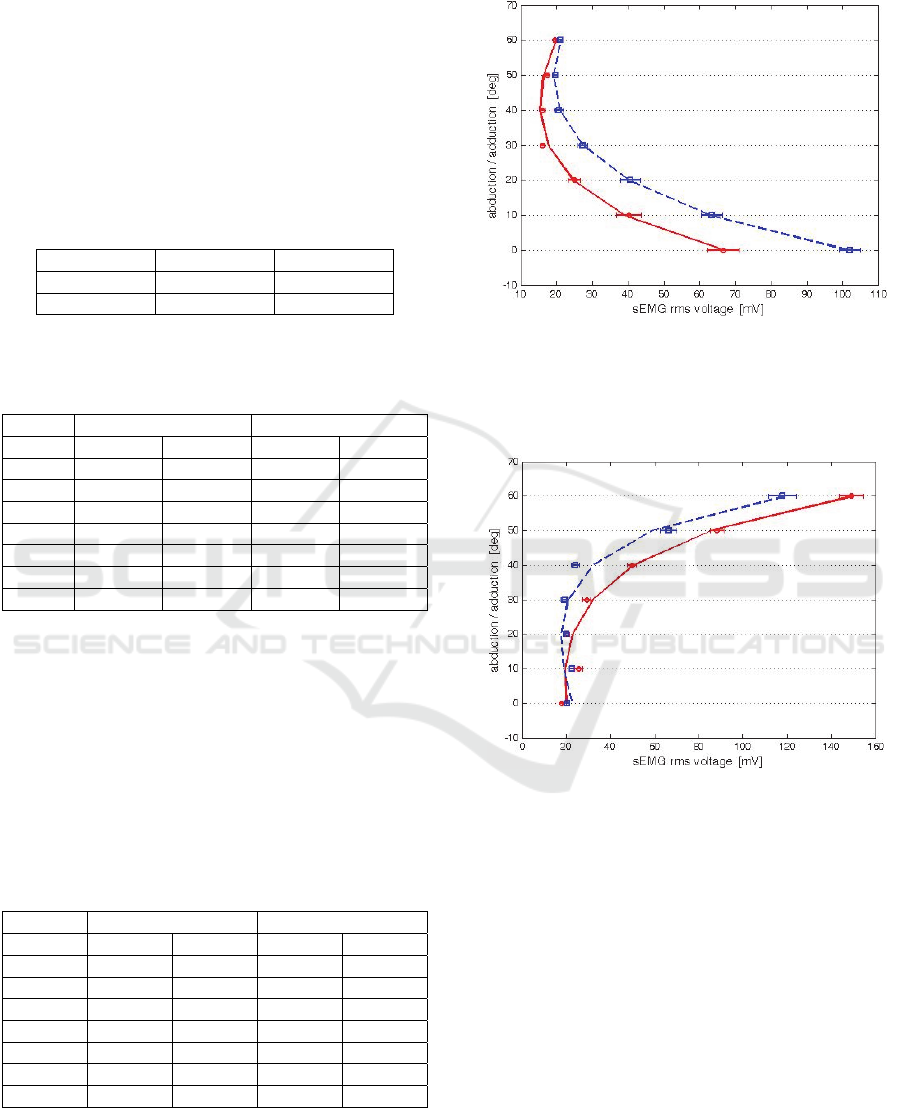
4.2.2 Thumb Abductor/Adductor
The same procedure was used to measure the radial
abduction/adduction of the thumb, except for, this
time, both the thumb abductor (TA) and the short
thumb adductor (STA) operate an abduction
movement when their intensity is growing, and an
adduction movement when is decreasing.
Table 4: Comparison of
correlation coefficient for five
polynomial and two exponential regression models of TA
and STA adduction/abduction measurements.
TA STA
model abduct adduct abduct adduct
1
s
t
0.76 0.62 0.65 0.77
2
nd
0.98 0.94 0.98 0.99
3
rd
1 0.99 1 1
4
th
1 0.99 1 1
5
th
1 1 1 1
mon. 0.98 0.91 0.87 0.96
bin. 1 0.98 1 1
Measurement results and the binomial
exponential regression models are reported in
Figures 13 and 14, whereas the
results of each
model are reported in Table 4.
Figure 13: TA sEMG assessment for subject M1 of
abduction (red circle) and adduction (blu square) with
standard deviation segments, superimposed to the
corresponding binomial exponential regression models
(continuous for abduction and dashed for adduction).
Figure 14: STA sEMG assessment for subject M1 of
abduction (red circle) and adduction (blu square) with
standard deviation segments, superimposed to the
corresponding binomial exponential regression models
(continuous for abduction and dashed for adduction).
In this case, it is worth noting that there is
ambiguity for high abduction/adduction angles for
TA and low angles for STA, suggesting that the two
measurements can be complementary within the
same algorithm, provided to discriminate the thumb
position.
4.3 Finger Position Recognition
SEMG measurements of abduction/adduction were
integrated with those of flexion/extension from flex
sensors, to provide a complete identification of the
BIOSIGNALS 2016 - 9th International Conference on Bio-inspired Systems and Signal Processing
212

finger position. Bend angles were obtained through a
linear relation with the sensor response.
The intrinsic muscles involved in the abduction
movements, however, are activated also during
flexion/extension movements. In order to
discriminate the sEMG signal corresponding to the
abduction movement, the flex sensor response was
used.
Taking into account that for the index and middle
abduction the maximum amplitude is obtained
without any finger flexion, on one hand, and the
abduction angle is constrained to zero at the
maximum finger flexion, on the other, it was defined
a bend coefficient to modulate the sMEG
response, according to equations (3) and (4)
90°
90°
⁄
(3)
_
∙
_
(4)
On the contrary, the flexion and abduction
movements of the thumb are independent, and can
be actuated simultaneously.
5 CONCLUSIONS
In this paper the combination of flex and sEMG
sensors was considered to measure
abduction/adduction capabilities of the first three
fingers. The sEMG signals were integrated with
information taken by flex sensor, to discriminate the
muscle fatigue devoted to abduction/adduction
movements from that devoted to flexions/extensions.
As a novelty, sEMG electrodes positioned on the
hand allowed a measurement of abduction/adduction
fingers’ movements.
Data from both sensors’ type fed an ad-hoc
realized circuitry based on an Arduino
microcontroller. PC running software was developed
to represent the finger posture with bar plots.
A problem which is still to overcome is the
personal characterization of the system, which has to
be accomplished by each subject before to start the
measurement session. Moreover, in the case of
thumb position recognition, both TA and STA
measurements need to be simultaneously available
to extract the actual abduction/adduction angle.
Future developments can be the reduction of
cross-talk between sEMG sensors, the integration of
the thumb opposition measurement, and the dynamic
posture recognition other than the static ones.
ACKNOWLEDGEMENTS
This paper was partially based on a work supported
by the Italian Space Agency (ASI), contract #2013-
081-R0, for which we would like to thank Prof.
Mariano Bizzarri, Dr. Simona Zoffoli and Dr.
Francesca Ferranti.
REFERENCES
Dipietro L., Sabatini A., Dario P., 2003. Evaluation of an
instrumented glove for hand-movement acquisition.
Journal of Rehabilitation Research and Development,
N. 2, 181-191.
Gentner R., Classen J., 2009. Development and evaluation
of a low-cost sensor glove for assessment of human
finger movements in neurophysiological settings. J.
Neurosci. Methods, 178, 138-147.
Lin J., Wu Y. and Huang T. S., 2000. Modeling the
constraints of human hand motion. IEEE Workshop on
Human Motion, 121-126.
Merletti R., Knaflitz M., & De Luca C. J., 1990.
Myoelectric manifestations of fatigue in voluntary and
electrically elicited contractions. J. Appl. Physiol.,
69(5), 1810-1820.
Neuman M. R., 1978. Biopotential amplifiers”, Medical
Instrumentation: Application and Design. Webster J.
G., Ed. Boston, MA: Houghton Mifflin.
Rau G., Schulte E., & Disselhorst-Klug C., 2004. From
cell to movement: to what answers does EMG really
contribute?. Journal of Electromyography and
Kinesiology, 14(5), 611-617.
Riillo F., Quitadamo L. R., Cavrini F., Gruppioni E.,
Pinto C.A., Pastò N.C., Sbernini L., Albero L., Saggio
G. 2014. Optimization of EMG-based hand gesture
recognition: supervised vs. unsupervised data
preprocessing on healthy subjects and transradial
amputees. Biomedical Signal Processing and Control,
Vol. 14, 117-125.
Saggio G., Lagati A., Orengo G., 2012. Wireless Sensory
Glove System developed for advanced Human
Computer Interface. International Journal of
Information Science, 2(5), 54-59.
Saggio G., Riillo F., Sbernini L., Quitadamo LR, 2015.
Resistive flex sensors: a survey. Smart Materials and
Structures, Volume 25, Number 1, pp. 1-30.
Spinelli E. M., Pallàs-Areny R., & Mayosky M. A., 2003.
AC-coupled front-end for biopotential measurements.
IEEE Trans. on Biomedical Engineering, 50(3), 391-
395.
Stegeman D., & Hermens H., 2007. Standards for surface
electromyography: The European project Surface
EMG for non-invasive assessment of muscles
(SENIAM).
Sensory Glove and Surface EMG with Suitable Conditioning Electronics for Extended Monitoring and Functional Hand Assessment
213
