
Body Location Independent Activity Monitoring
Carina Figueira
1,3
, Ricardo Matias
2
and Hugo Gamboa
1,3
1
Faculdade de Ci
ˆ
encias e Tecnologias, Universidade Nova de Lisboa, Lisboa, Portugal
2
Escola Superior de Sa
´
ude, Instituto Polit
´
ecnico de Set
´
ubal, Set
´
ubal, Portugal
3
Associac¸
˜
ao Fraunhofer Portugal Research, Porto, Portugal
Keywords:
Human Activity Recognition, Signal Processing, Feature Extraction, Feature Selection, Machine Learning.
Abstract:
Human Activity Recognition (HAR) is increasingly common in people’s daily lives, being applied in health
areas, sports and safety. Because of their high computational power, small size and low cost, smartphones and
wearable sensors are suitable to monitor user’s daily living activities. However, almost all existing systems
require devices to be worn in certain positions, making them impractical for long-term activity monitoring,
where a change in position can lead to less accurate results. This work describes a novel algorithm to detect
human activity independent of the sensor placement. Taking into account the battery consumption, only two
sensors were considered: the accelerometer (ACC) and the barometer (BAR), with a sample frequency of 30
and 5 Hz, respectively. The signals obtained were then divided into 5 seconds windows. The dataset used
is composed of 25 subjects, with more than 7 hours of recording. Daily living activities were performed
with the smartphone worn in 12 different positions. From each window a set of statistical, temporal and
spectral features were extracted and selected. During the classification process, a decision tree was trained
and evaluated using a leave one user out cross validation. The developed framework achieved an accuracy of
94.5±6.8 %, regardless the subject and device’s position. This solution may be applied to elderly monitoring,
as a rehabilitation tool in physiotherapy fields and also to be used by ordinary users, who just want to check
their daily level of physical activity.
1 INTRODUCTION
The interest in HAR has been growing in different ar-
eas, becoming an important issue of healthcare, fit-
ness and safety. HAR can be used as a motivation
tool to practice physical exercise, allowing to control
the activities of daily living, as a way to monitor the
elderly and detect possible falls, and also as a rehabili-
tation tool, performing movements analysis and help-
ing doctors and their patients to execute the exercises
needed in a more controlled and better way (Karanto-
nis et al., 2006; Silva, 2013).
As almost all the existing HAR systems require
firm attachment of the device to a specific body part, it
would be desirable to become the activity monitoring
independent of sensors position, not only in a matter
of comfort, but also to avoid misplacement and, con-
sequently, false results.
In this paper, a location independent algorithm for
HAR using smartphones sensors is developed, using
signals acquired with smartphones present in several
positions (like right pocket or back pocket), tools to
process and extract information from them and also
classification algorithms to recognize the respective
activity. We detained our attention in signals pro-
duced by the ACC and the BAR, extracting infor-
mation on statistical, temporal and spectral domains
and interpreting them in the context of human move-
ment and activities recognition. Finally, using ma-
chine learning techniques, the identification of dif-
ferent activities was made. The developed system is
based on an architecture of signal sensor processing,
feature extraction and selection, classification algo-
rithms and validation process.
2 BACKGROUND
Over the last years, several HAR systems have been
proposed and studied. Nowadays, most of these stud-
ies based on wearable and smartphone’s built-in sen-
sors are made, placing them in different parts of the
body.
From all the existing sensors, ACC is the most
common choice to HAR. Despite its usefulness, there
190
Figueira, C., Matias, R. and Gamboa, H.
Body Location Independent Activity Monitoring.
DOI: 10.5220/0005699601900197
In Proceedings of the 9th International Joint Conference on Biomedical Engineering Systems and Technologies (BIOSTEC 2016) - Volume 4: BIOSIGNALS, pages 190-197
ISBN: 978-989-758-170-0
Copyright
c
2016 by SCITEPRESS – Science and Technology Publications, Lda. All rights reserved

are still difficulties in the detection of vertical move-
ments, like climbing stairs. Through the BAR sensor,
the atmospheric pressure can be measured enabling to
detect considerable variations in height. So, combin-
ing it with the ACC can lead to better accuracy results.
(Bianchi et al., 2010) investigated the improvement of
fall detection when using BAR and ACC sensors. Us-
ing a Decision Tree classifier, the proposed system
obtained an accuracy of 96.9%, compared to 85.3%
for the same measures when using ACC alone. On
the other hand, (Muralidharan et al., 2014) used these
sensors to successfully detect considerable variations
in height, such as the ones that occur when a per-
son moves from one building floor to another. Also
(Moncada-Torres et al., 2014) shown that the use of
a BAR increases the HAR performance for walking
upstairs and downstairs by up to 20%.
In order to achieve a position-independent activ-
ity monitoring, a few studies were made, but a com-
pletely position-independent was not found, yet. Even
though, in these studies the effects of changing posi-
tion are minimized. One of the explored ways was
to train a generalized classifier with data from several
appropriate positions (Reddy et al., 2010). Similarly,
(Anjum and Ilyas, 2013) create a smartphone applica-
tion with a non-specific position and orientation clas-
sification system.
3 PROPOSED FRAMEWORK
The developed framework for HAR is based on the
acquisition of 2 different sensors: the ACC, the most
useful for this analysis, beyond its optimized battery
usage, and the BAR, which helps in the discrimination
of climbing stairs and walking.
3.1 Data Acquisition
The acquisition protocol followed was not overly spe-
cific, being the main concern to ensure that subjects
keep doing the same activity during the entire sam-
ple without any interruption. Besides this, it was also
important to save the subject’s name, age, weight,
height, gender, leg height and shoe size before any ac-
quisition. The activities included and used in the con-
sidered dataset were walking, running, standing, sit-
ting, upstairs and downstairs, while using the smart-
phones in several positions (like left or right pocket,
for example).
3.2 Signal Processing
In the last years, an evolution in smartphones has been
seen. Nowadays, many of its capabilities are possible
due to the embedded sensors. In smartphones, most
of the sensors are Micro-Electro-Mechanical-Systems
(MEMS) based. These systems are very small chips
composed by one or more sensors (Grankin et al.,
2012). In this work ACC and BAR signals were pro-
cessed and used.
3.2.1 Accelerometer
The use of ACC to characterize and recognize human
movements has been increasing in the last years. This
sensor provides qualitative and quantitative data that
can be used to recognize users activities (Kavanagh
and Menz, 2008).
ACC measures the acceleration force applied to
the smartphone caused due to gravity or tilting action
on tree physical axes (x, y and z).
While subjects move, the body acceleration com-
ponents change, causing variations in the measured
accelerations, regardless of its location. On the
other hand, the acceleration is proportional to exter-
nal forces and can also reflect the intensity and fre-
quency of human movement (Gomes, 2014; Mathie
et al., 2004; Xiao et al., 2014).
The triaxial ACC is composed by 3 data times se-
ries, one for each axis: ACC
x
, ACC
y
and ACC
z
. Be-
sides these 3 axes data, the magnitude of the acceler-
ation was also computed, which is independent of the
ACC orientation and measures the instantaneous in-
tensity of the subject movement at time (t) (Machado,
2013; Li et al., 2013). This time series is calculated
as represented in the following equation:
ACC
mag
(t) =
q
ACC
2
x,t
+ ACC
2
y,t
+ ACC
2
z,t
(1)
The ACC signal is composed by the combina-
tion of the gravitational acceleration with the subject’s
body acceleration. So, the measured acceleration is
always influenced by the gravitational acceleration of
the earth (g = 9.8m/s
2
). Therefore, to measure the
real acceleration of the subject, the gravitational com-
ponent must be isolated and removed. In order to do
so a high-pass filter was used. In Figure 1 the magni-
tude of total acceleration, after the filtering process, is
presented, i.e, the subject’s acceleration for 6 different
activities.
As can be seen in Figure 1, the upstairs, down-
stairs and walking ACC signals are very similar,
which can lead to a confusion in the classification pro-
cess.
Body Location Independent Activity Monitoring
191
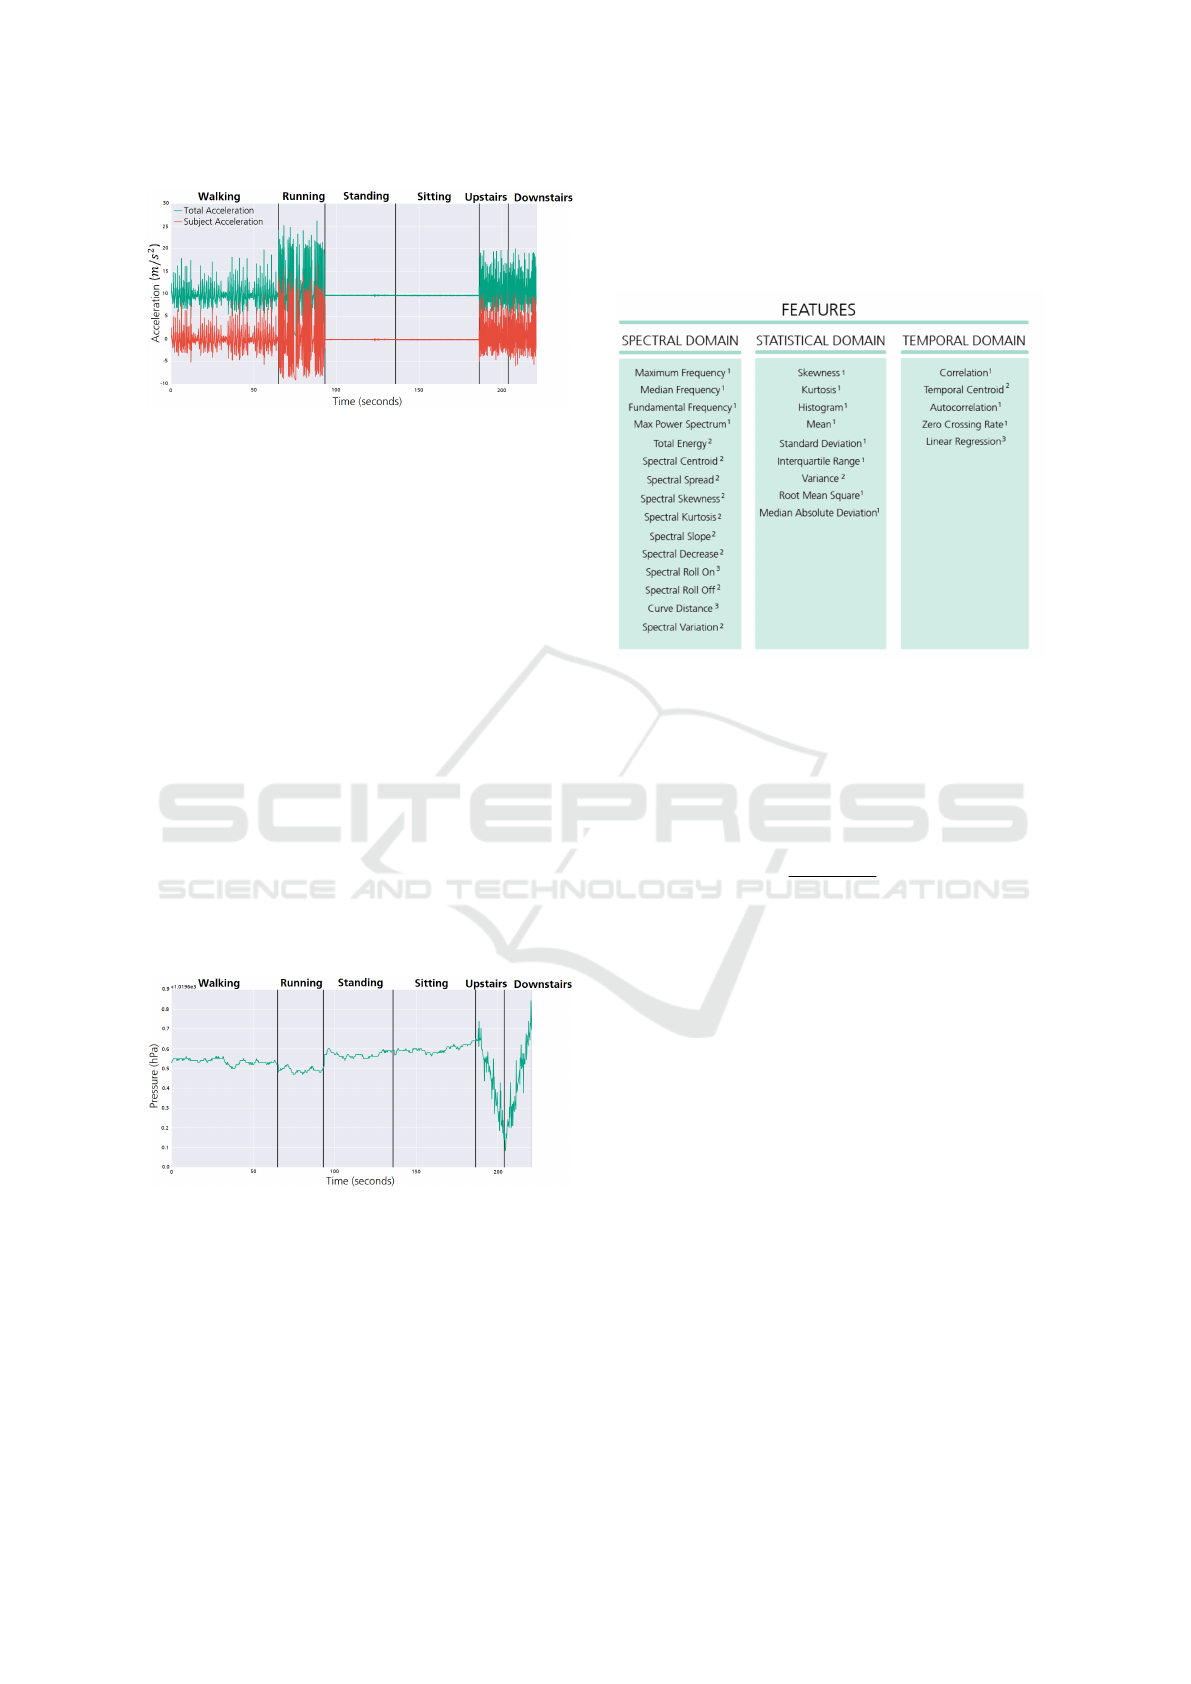
Figure 1: Magnitude of total acceleration and subject’s ac-
celeration for 6 different activities.
3.2.2 Barometer
Smartphones built-in MEMS BAR calculate pressure
considering the piezo-resistive effect. The piezo-
resistive pressure sensor is composed by a plurality
of piezo-resistance elements arranged on a diaphragm
on a silicon substrate, which bends with applied pres-
sure. Because of that bending, a deformation in the
crystal lattice of the diaphragm occurs. Then, this de-
formation causes a change in the band structure of the
piezo-resistors that are placed on the diaphragm, lead-
ing to a variation of the resistance of piezo-resistance
elements (Rodrigues, 2015; Cabuz et al., 2009)
The atmospheric pressure decreases as the altitude
increases, so through the BAR signal it is possible to
detect altitude changes and, consequently, infer if the
subject was climb up or down the stairs. Figure 2
shows the barometer signal obtained from the same
acquisition as Figure 1. As can be seen, the differ-
ences between walking, upstairs and downstairs are
quite evident.
Figure 2: Pressure signal for 6 different activities.
3.3 Feature Extraction
In machine learning techniques, the choice of the
features that will be extracted is essential to make
the learning task more efficient and accurate. In the
present work, the sensor signals extracted were di-
vided into fixed length windows where all the in-
formation of each activity were extracted. Based
on the new method of feature extraction developed
in (Machado, 2013), this process was made using a
JavaScript Object Notation (JSON) file, where a dic-
tionary of features was created. The three sets of fea-
tures that were considered are present in Figure 3.
Figure 3: Spectral, Statistical and Temporal Domain Fea-
tures used in the present work.
1
Features already used
in accelerometer signals;
2
Features used in audio recog-
nition (Peeters, 2004);
3
New features created and applied
in the current work.
Afterwards, the extracted features are normalized
and bounded within [−1,1], according to the equa-
tion:
f
norm
=
f − f
min
f
max
− f
min
× 2 − 1 (2)
Where f
norm
is the feature normalized, f is the
original feature and f
max
and f
min
are the maximum
and minimum values of the feature f , respectively.
This step is important to avoid a “preference” in fea-
tures with higher magnitude by the classification al-
gorithm.
3.4 Feature Selection
After features extraction, it is possible that many of
them are either redundant or irrelevant, and can be re-
moved without incurring much loss of information.
Furthermore, features computation is time consum-
ing and computationally heavy task. So, it is very
important to keep the dimensionality of the feature
data as small as possible, which can be obtained with
a feature selection process. In feature selection is
very important to take into account the type of data
that is been used and the aim of the classification.
A perfect feature type has a wide variation between
different classes and a small one between the same
class data (Gomes, 2014; Machado, 2013; Trier et al.,
1996).
BIOSIGNALS 2016 - 9th International Conference on Bio-inspired Systems and Signal Processing
192

In this work was implemented a feature selection
based on a wrapper approach and on the “Forward
Feature Selection” algorithm, in which features are
sequentially added to an candidate set until the addi-
tion of more features does not decrease the classifica-
tion performance.
In order to visualize the behaviour of the best fea-
tures throughout the performance of different activ-
ities, the Horizon Plot was considered, as shown in
Figure 4. In this method the blue and red colors cor-
respond to positive and negative values, respectively,
and the color intensity increases with the respective
absolute value. It was possible to observe that the
features types Root Mean Square, Median Absolute
Deviation and Standard Deviation (all from ACC sig-
nals) allowed the discrimination between running,
walking, static and stairs activities. To distinguish
between standing and sitting activities was important
the extraction of the features Spectral Roll On, Mean
and Max Power Spectrum, also from ACC signals.
BAR signals can help to discriminate between up-
stairs, downstairs and walking activities, which was
possible to confirm. Besides the ACC Spectral Cen-
troid helped in upstairs and downstairs discrimina-
tion, the best results were obtained with features ex-
tracted from BAR signals. Firstly, BAR Spectral Roll
Off differentiates walking and running from upstairs
and downstairs. Then, BAR Centroid and Linear Re-
gression, discriminate between upstairs and down-
stairs.
3.5 Supervised Learning
In this work, supervised learning techniques to dis-
criminate between 6 different activities (walk, run,
stand, sit, upstairs and downstairs) were used. Con-
sidering the gathered dataset and the respective fea-
tures extracted and selected, a classification algorithm
based on decision trees was trained. Then, in order to
evaluate this classification algorithm, a leave one user
out cross validation strategy was used.
3.5.1 Decision Tree and Rejection Class
A Decision Tree creates a model that predicts the
value of a target variable by learning simple decision
rules inferred from the data features. Each node is a
choice between a limited number of alternatives and
each branch a classification. There are several metrics
for the choice of the feature that best splits the set of
samples (Kotsiantis et al., 2007; Ture et al., 2009). In
this work, the Gini impurity metric was considered.
At node d, the Gini impurity index, g(d), is defined
as (Ture et al., 2009):
g(d) =
∑
j6=i
p( j|d)p(i|d) (3)
Where i and j are the classes of the target variable.
Setting k as the number of classes for a target variable
(in this case the number of possible activities), when
the cases in a node are evenly distributed across the
classes, the Gini index takes its maximum value of
1−
1
k
. On the other hand, when all cases in the node
belong to the same class, the Gini index is 0 (Ture
et al., 2009).
Beyond the Decision Tree based classifier, a Re-
jection Class was also considered. The main goal
was to consider just the classification results that were
made based in a high probability. With this, in case of
the probability was less than a specific value, the re-
sult was rejected and was not considered in the over-
all classification performance. In the context of this
work, it was considered that if the rejected data repre-
sents less than 5% of the total data, a very significant
amount of data was not lost.
3.5.2 Leave One User Out Cross Validation
To validate the proposed model, a leave one user out
cross validation algorithm was developed. As input it
receives the data (the set of features extracted) and the
correspondent labels and also the subjects names for
each time window. After it divides the data into train
and test sets and performs the feature selection, which
gives the n best features and correspondent accuracy.
In each iteration the resulting accuracy is saved into a
list, which in the end has all the accuracies obtained.
The final step consists in the calculation of the average
value of this list.
For s subjects s − 1 subjects are used to train the
Decision Tree and 1 to validate it. This process is
repeated s times, where each subject is used exactly
once as the validation set. So, for the s subjects, there
are s different training sets and s different test sets.
With this cross validation technique we can ensure an
independence of the subject.
4 PERFORMANCE EVALUATION
The performance of the proposed HAR system
was validated in four approaches: Position Depen-
dent (Pdep), Position Followed by Activity Recog-
nition (Pact), Position Independent (Pindep), and
Position Dependent and Independent Combination
(Pdep+indep). This evaluation was also performed
in a subject-independent condition. In order to reach
a balanced result between the classification accuracy
and battery consumption, a sampling frequency and
Body Location Independent Activity Monitoring
193

Figure 4: Horizon Plot with some of the most notable features extracted from the ACC and BAR sensors according to the
activity performed. The x , y , mag and pressure indexes refer to the component where was extracted the respective feature:
x and y axis of the ACC, ACC magnitude and BAR single axis, respectively.
time complexity analysis were performed. The com-
bination of different features were also explored to
improve the classification accuracy.
4.1 Activity Dataset
Daily life activities require many complex movements
and their complexity diverge according to each sub-
ject. In this study, the analysed data is part of Fraun-
hofer AICOS dataset and is composed by 25 subjects,
7 males and 18 females, with an average age of 23 ± 4
years, average height of 169 ± 8 cm and an average
weight of 61 ± 11 kg. Overall, more than 7 hours
(5281 windows of 5 seconds duration) of data were
recorded for 6 different activities (Walking, Running,
Standing, Sitting, Upstairs and Downstairs) with the
smartphone placed into 12 different positions (Ta-
ble 1).
Table 1: Set of smartphone positions and the respective ac-
tivities performed considered in this work.
1
Walking;
2
Running;
3
Standing;
4
Sitting;
5
Upstairs;
6
Downstairs.
Positions Activities Performed
Calling 1, 2, 3, 4, 5, 6
Texting 1, 2, 3, 4, 5, 6
Left/Right/Back Pocket 1, 2, 3, 4, 5, 6
Front Pocket 2, 3, 4
Center/Left/Right Vest 1, 2
Belt 1, 2
Chest Attached 1, 2
Left Arm 2
Although there are positions that have been only
used in just one activity, like Left Arm, they were also
important to increase the variety of positions used in
the Pindep approach, leading to a more comprehen-
sive result.
4.2 Resampling and Time Windows
Due to the variability in sampling frequency of differ-
ent smartphones, sensors signals were resampled to
30 Hz and 5 Hz for ACC and BAR, respectively. Af-
ter this sampling frequency conversion, the next step
was to split the signals into segments of 5 seconds
(time windows), from which the features were ex-
tracted. Afterwards, the extracted features were nor-
malized and bounded within [−1, 1], according to the
equation:
f
norm
=
f − f
min
f
max
− f
min
× 2 − 1 (4)
Where f
norm
is the feature normalized, f is the orig-
inal feature and f
max
and f
min
are the maximum and
minimum values of the feature f , respectively. This
step was important to avoid a “preference” in features
with higher magnitude.
4.3 Results
As the features were extracted from ACC and BAR
signals with a time window of 5 seconds and with a
sampling frequency of 30 and 5 Hz, there were 150
and 25 samples for each window, respectively.
After feature extraction and selection, signal pro-
cessing and classification, the performance results
were obtained with leave one user out cross valida-
tion, where the accuracy value was calculated through
the Equation:
A =
T P + T N
T P + T N + FP + FN
(5)
Where T P are the True Positives, T N the True
Negatives, FP the False Positives and FN the False
BIOSIGNALS 2016 - 9th International Conference on Bio-inspired Systems and Signal Processing
194

Negatives. All the results are also shown in a nor-
malized confusion matrix format, where the percent-
age of classified samples are present in a table layout
with size 6 × 6, for the 6 different classes available.
Thereby, it is possible to easily compare the diago-
nal and the off-diagonal values obtained, where the
higher the diagonal values the better, indicating many
correct predictions.
Regarding to the rejection class, the lower prob-
ability considered was 40%, which represented about
3% of the total data, whereby it can be considered that
was not lost a very significant amount of data.
In order to ascertain how much the classification
accuracy improves with the usage of the BAR, the re-
sults obtained with a single sensor (the ACC) and with
the two sensors are also present.
4.3.1 Position Dependent Approach
Despite the main objective of this work was to find
a location independent algorithm for HAR, in a first
stage we have tested the developed algorithm in a po-
sition dependent approach. Table 2 summarizes the
results obtained. As can be observed, considering the
positions which were used in all the possible activi-
ties (see Table 1), and using just the ACC, the results
obtained range from 84.2 ± 8.3% to 95.0 ± 3.6%. On
the other hand, combining the ACC with the BAR,
the results improved, ranging from 93.0 ± 5.9% to
98.4 ± 2.5%, mainly due to the reduction of the exist-
ing confusion between upstairs, downstairs and walk-
ing.
Table 2: Accuracy obtained considering Pdep approach
with just ACC signals (Single Sensing) and with ACC and
BAR (Dual Sensing).
Position
Single Sensing
Accuracy (%)
Dual Sensing
Accuracy (%)
Back Pocket 95.0 ± 3.6 98.1 ± 3.1
Left Pocket 94.5 ± 6.0 98.4 ± 2.5
Right Pocket 92.3 ± 9.7 94.1 ± 8.1
Calling 92.1 ± 6.6 94.4 ± 5.4
Texting 84.2 ± 8.3 93.0 ± 5.9
4.3.2 Position Followed by Activity Recognition
Approach
As shown in the previous approach, with the knowl-
edge of the smartphone position a fairly accurate
classification was obtained. So, in order to achieve
an activity recognition independent of position, one
possible approach consists in two fundamental steps:
first the position recognition, followed by the activ-
ity recognition. Using the same methods than activ-
ity classification, the position classification was per-
formed, obtaining an average accuracy of 70 ± 21%,
where Texting, Calling and Belt are the more accu-
rately classified positions. Furthermore, the Center
and Right Vest positions are mostly classified as Left
Vest. With this, we decided to test the algorithm con-
sidering just 4 classes for the possible positions: Tex-
ting, Calling and Belt (the more accurately classified
positions) and also Vest (which includes Center, Right
and Left Vest). This way, we improved the position
classification for 99.1 ± 1.9%.
4.3.3 Position Independent Approach
To achieve the desirable position independent recog-
nition, another approach can be followed, where it is
not taken into account the smartphone position. For
that, was given to the developed algorithm as data in-
puts the features extracted and selected from the 6 dif-
ferent activities performed with the smartphone into
the 12 different positions, and as the desirable out-
puts, only the correspondent activity.
Using just the ACC, a classification with an ac-
curacy of 82 ± 11% was performed. Similarly to
what was shown in Pdep approach, and, once again,
in agreement with the expected, by combining the 2
sensors the results are highly improved. In this case,
the classification was performed with an accuracy of
92.3 ± 5.8%, which corresponds to an increase of
10%. Although there is still some confusion between
upstairs, downstairs and walking, it was quite de-
creased, where the worst classified activity was down-
stairs with 81.2% of data correctly identified (about 2
times better than the previous result). The correspon-
dent normalized confusion matrix is present in Fig-
ure 5.
In order to simulate the arising of new positions
and evaluate how the developed algorithm will re-
sponds, another evaluation test was made. For this
purpose, the leave one position out cross validation
was developed, which consists in a very similar ver-
sion of the leave one user out, where instead of using
the subjects is used the positions. In this conditions,
an accuracy of 92.8 ± 9.3% was obtained.
4.3.4 Position Dependent and Independent
Combination Approach
The last approach considered in this work was based
in the combination of the Pdep and Pindep ap-
proaches, consisting in, at a first stage, classify the
device position and then, considering the position ob-
tained, classify the activity performed. If the position
was classified based on a high accuracy, the Pdep ap-
proach was considered. Otherwise, was employed the
Body Location Independent Activity Monitoring
195
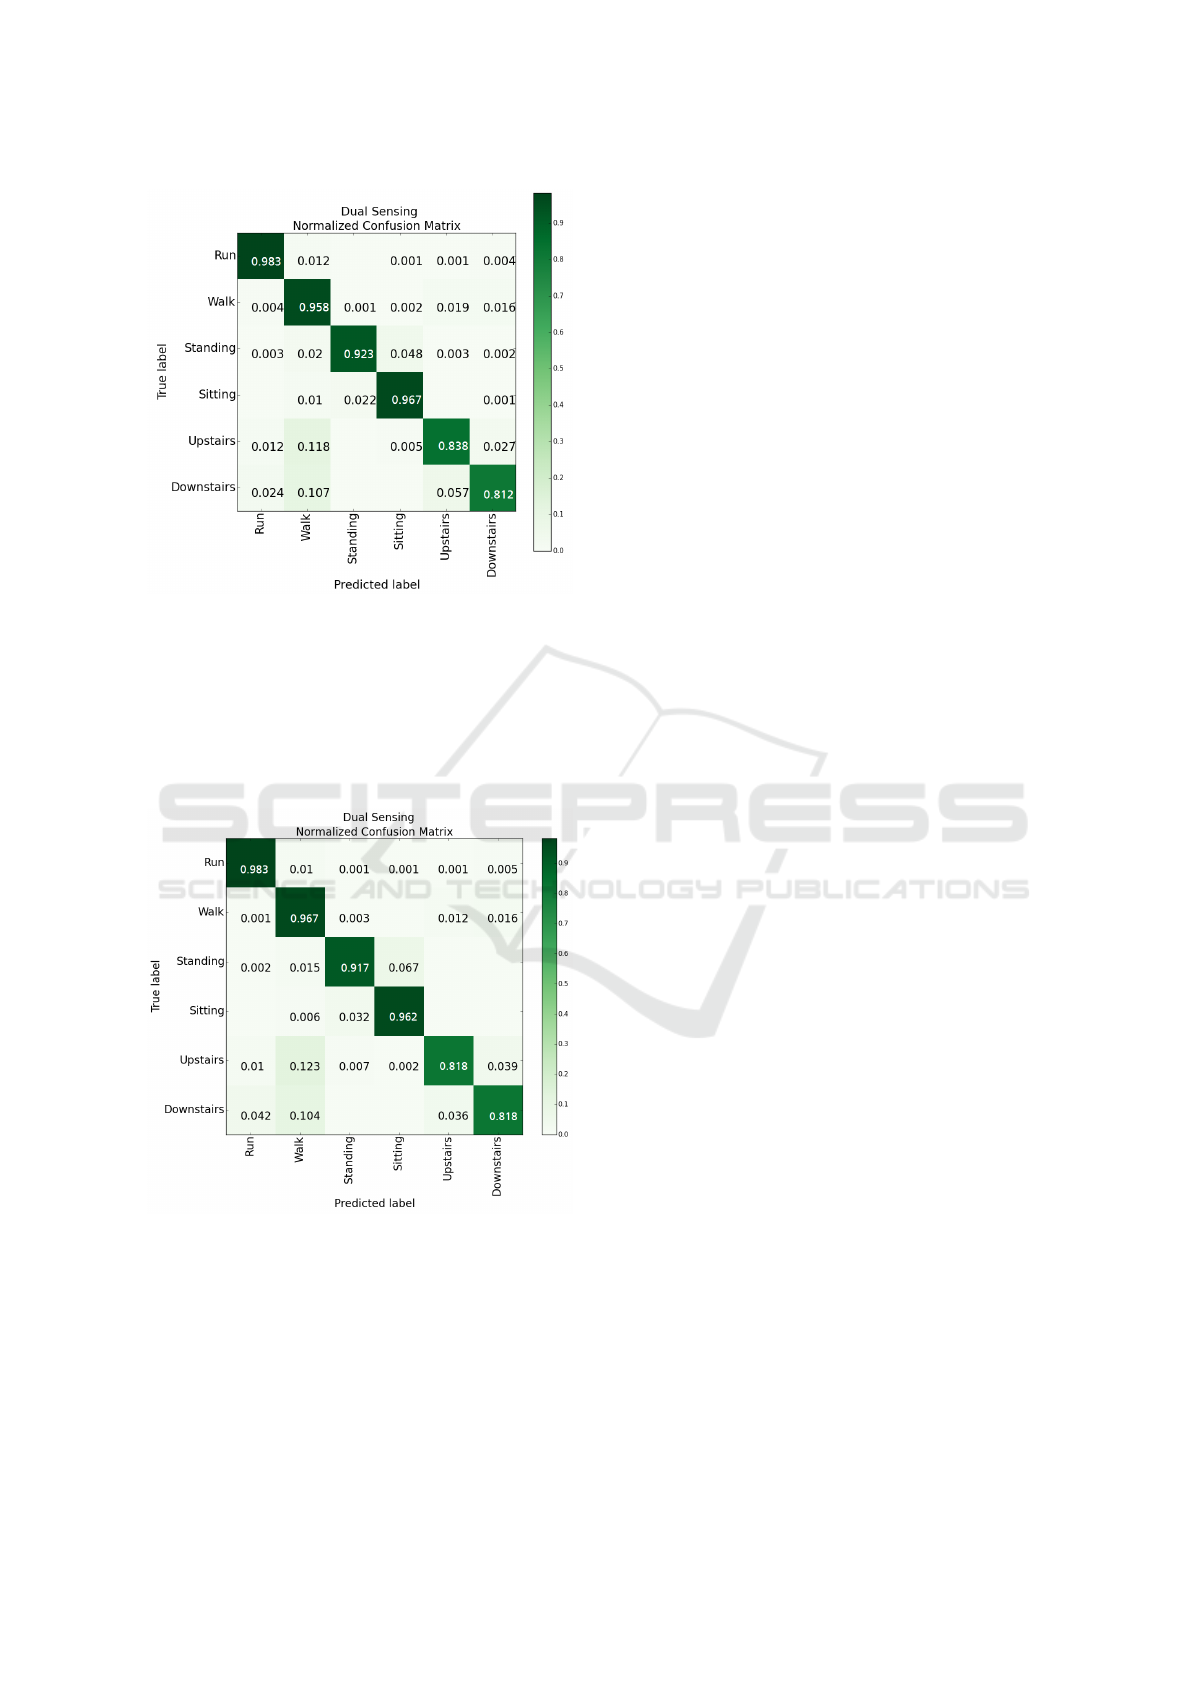
Figure 5: Normalized Confusion Matrix obtained for Pin-
dep approach, using features extracted from ACC and BAR.
Pindep.
Overall, an accuracy value of 94.5 ± 6.8% was
achieved, increasing about 2% than considering just
the Pindep approach. The correspondent normalized
confusion matrix is present in Figure 6.
Figure 6: Normalized Confusion Matrix obtained for
Pdep+indep approach, using features extracted from ACC
and BAR.
4.4 Discussion
The system developed in this work aims to identify
human activities, independently of the device’s po-
sition. After sampling frequency reduction, features
were extracted from signals. Using just the suitable
number and combination of them, four approaches
were studied. In every case a Decision Tree was used
as classifier, evaluated with the developed leave one
user out cross validation.
Firstly, we studied the system performance when
was known the smartphone position, achieving an ac-
curacy between 93.0 ± 5.9% to 98.4 ± 2.5%, where
the best result was obtained with Back Pocket and
the worst with Texting position. Based on it, the
first approach followed to reach the independence of
position was Pact, where, considering all the pos-
sible positions, a low accuracy result was obtained
(70 ± 21%). Taking into account just the best clas-
sified positions was possible to improve the previous
results, but in everyday life the users do not use their
smartphone only in those positions. With Pindep ap-
proach this problem was solved. Without knowing
the smartphone position, an accuracy of 92.3 ± 5.8%
was achieved. Finally, the best result was obtained
through the Pdep+indep approach, where an accu-
racy value of 94.5 ± 6.8% was achieved, since Pdep
was only used if the position classification result was
based on a high accuracy (higher than 98%). Other-
wise, was employed the Pindep.
5 CONCLUSIONS
The results obtained suggest that through ACC and
BAR users’ activities can be adequately identified in-
dependently of the smartphone position.
Comparing to the state of the art, despite (Anjum
and Ilyas, 2013) achieved better accuracy results, we
may consider that the developed work is broader, al-
lowing to discriminate more activities independently
of device’s position. In (Anjum and Ilyas, 2013) were
only tested 4 different positions, against the 12 that we
had considered. Regarding to (Reddy et al., 2010),
was not considered upstairs and downstairs, one of
the most difficult activities to recognize. Even so,
the accuracy obtained was about 0.9% lower than the
achieved in this work.
The major achievement was to get a system which
allows a smartphone to monitor users activities in a
simple way, not requiring a specific position. There
are many scenarios where the contributions of the
present work may be applicable, such as to monitor
the elderly, as a rehabilitation tool in physiotherapy
fields and also to be used by ordinary users, who just
want to check their daily level of physical activity. In
all cases, the independence of position is a big con-
cern, not only to provide more comfort and usabil-
ity, but also to avoid misplacement and, consequently,
false results.
BIOSIGNALS 2016 - 9th International Conference on Bio-inspired Systems and Signal Processing
196

REFERENCES
Anjum, A. and Ilyas, M. U. (2013). Activity recognition us-
ing smartphone sensors. Consumer Communications
and Networking Conference (CCNC), 2013 IEEE.
Bianchi, F., Redmond, S. J., Narayanan, M. R., Cerutti,
S., and Lovell, N. H. (2010). Barometric pressure
and triaxial accelerometry-based falls event detection.
Neural Systems and Rehabilitation Engineering, IEEE
Transactions on, 18(6):619–627.
Cabuz, E. I., Cabuz, C., and Wang, T.-Y. (2009). Piezore-
sistive pressure sensor. US Patent 7,546,772.
Gomes, A. L. (2014). Human activity recognition with ac-
celerometry: Novel time and frequency features. Mas-
ter’s thesis, Faculdade de Ci
ˆ
encias e Tecnologia da
Universidade Nova de Lisboa.
Grankin, M., Khavkina, E., and Ometov, A. (2012). Re-
search of mems accelerometers features in mobile
phones. In Proceedings of the 12th conference of
Open Innovations Association FRUCT; Oulu, Fin-
land, pages 31–36.
Karantonis, D., Narayanan, M., Mathie, M., Lovell, N., and
Celler, B. (2006). Implementation of a real-time hu-
man movement classifier using a triaxial accelerome-
ter for ambulatory monitoring. IEEE Transactions on
Information Technology in Biomedicine, 10.
Kavanagh, J. and Menz, H. (2008). Accelerometry: A tech-
nique for quantifying movement patterns during walk-
ing. ScienceDirect, Gait & Posture 28, 28.
Kotsiantis, S. B., Zaharakis, I., and Pintelas, P. (2007). Su-
pervised machine learning: A review of classification
techniques.
Li, N., Hou, Y., and Huang, Z. (2013). Implementation of
a real-time human activity classifier using a triaxial
accelerometer and smartphone. International Journal
of Advancements in Computing Technology, 5(4).
Machado, I. (2013). Human activity data discovery based
on accelerometry. Master’s thesis, Faculdade de
Ci
ˆ
encias e Tecnologias da Universidade de Lisboa and
PLUX Wireless Biosignals.
Mathie, M. J., Coster, A. C., Lovell, N. H., and Celler,
B. G. (2004). Accelerometry: providing an integrated,
practical method for long-term, ambulatory monitor-
ing of human movement. Physiological measurement,
25(2):R1.
Moncada-Torres, A., Leuenberger, K., Gonzenbach, R.,
Luft, A., and Gassert, R. (2014). Activity classifica-
tion based on inertial and barometric pressure sensors
at different anatomical locations. Physiological mea-
surement, 35(7):1245.
Muralidharan, K., Khan, A. J., Misra, A., Balan, R. K., and
Agarwal, S. (2014). Barometric phone sensors: more
hype than hope! In Proceedings of the 15th Work-
shop on Mobile Computing Systems and Applications,
page 12. ACM.
Peeters, G. (2004). A large set of audio features for
sound description (similarity and classification) in the
cuidado project.
Reddy, S., Mun, M., Burke, J., Estrin, D., Hansen, M., and
Srivastava, M. (2010). Using mobile phones to deter-
mine transportation modes. ACM Trans. Sen. Netw.,
6(2):13:1–13:27.
Rodrigues, C. (2015). Smartphone-based inertial naviga-
tion system for bicycles. Master’s thesis, Faculdade
de Engenharia da Universidade do Porto.
Silva, J. R. C. (2013). Smartphone based human activity
prediction. Master’s thesis, Faculdade de Engenharia
da Universidade do Porto.
Trier, Ø. D., Jain, A. K., and Taxt, T. (1996). Feature extrac-
tion methods for character recognition-a survey. Pat-
tern recognition, 29(4):641–662.
Ture, M., Tokatli, F., and Kurt, I. (2009). Using kaplan–
meier analysis together with decision tree methods
(c&rt, chaid, quest, c4. 5 and id3) in determining
recurrence-free survival of breast cancer patients. Ex-
pert Systems with Applications, 36(2):2017–2026.
Xiao, L., He, B., Koster, A., Caserotti, P., Lange-Maia,
B., Glynn, N. W., Harris, T., and Crainiceanu, C. M.
(2014). Movement prediction using accelerometers in
a human population.
Body Location Independent Activity Monitoring
197
