
Classifier Ensembles with Trajectory Under-Sampling
for Face Re-Identification
Roghayeh Soleymani
1
, Eric Granger
1
and Giorgio Fumera
2
1
Laboratoire D’Imagerie, de Vision et D’Intelligence Artificielle,
´
Ecole de Technologie Sup
´
erieure,
Universit
´
e du Qu
´
ebec, Montreal, Canada
2
Pattern Recognition and Applications Group, Dept. of Electrical and Electronic Engineering,
University of Cagliari, Cagliari, Italy
Keywords:
Person Re-Identification, Class Imbalance, Ensemble Methods.
Abstract:
In person re-identification applications, an individual of interest may be covertly tracked and recognized based
on trajectories of faces or other distinguishing information captured with video surveillance camera. However,
a varying level of imbalance often exists between target and non-target facial captures, and this imbalance
level may differ from what was considered during design. The performance of face classification systems
typically declines in such cases because, to avoid bias towards the majority class (non-target), they tend to
optimize the overall accuracy under a balance class assumption. Specialized classifier ensembles trained
on balanced data, where non-target samples are selected through random under-sampling or cluster-based
sampling, have been proposed in literature, but they suffer from loss of information and low diversity and
accuracy. In this paper, a new ensemble method is proposed for generating a diverse pool of classifiers,
each one trained on different levels of class imbalance and complexity for a greater diversity of opinion.
Ensembles with Trajectory Under Sampling (EoC-TUS) allows to select subsets of non-target training data
based on trajectories information. Variants of these ensembles can give more importance to the most efficient
classifiers in identifying target samples, or define efficient and diverse decision boundaries by starting selection
of trajectories from the farthest ones to the target class. For validation, experiments are conducted using videos
captured in the Faces In Action dataset, and compared to several baseline techniques. The proposed EoC-TUS
outperforms state-of-the-art techniques in terms of accuracy and diversity over a range of imbalance levels in
the input video.
1 INTRODUCTION
Person re-identification is a video surveillance (VS)
application where individuals are tracked and rec-
ognized at different time instants and/or locations
over a network of cameras using information like
faces, gaite and soft biometrics captured in video
streams (Bedagkar-Gala and Shah, 2014). In face re-
identification, faces from video streams are captured
unobtrusively under uncontrolled conditions and rec-
ognized using a video-to-video face recognition (FR)
system. Performance of these FR systems is severely
affected by variations in pose and expression, as well
as environmental conditions such as illumination, oc-
clusion and blur. One important challenge in this ap-
plication is that the number of reference face captures
from target individuals is limited and greatly outnum-
bered by non-target ones. What’s more, the level of
imbalance observed during operations varies unpre-
dictably over time. Therefore, the proportion of target
to non-target captures is not balanced and differs from
what is considered during enrolment.
Modular classification architectures are promising
for FR in VS, where one or two-class classifiers are
designed per target individual enrolled to the system
(Pagano et al., 2014). In addition, ensembles of these
binary classifiers per individual of interest have been
successfully applied to face re-identification (Radtke
et al., 2014; De-la Torre et al., 2015a; De-la Torre
et al., 2015b). In order to define an accurate deci-
sion boundary, a one-class classifier requires a large
number of representative target samples which is not
often feasible in practice. In contrast, designing
individual-specific ensembles with two-class classi-
fiers require representative samples from both target
and non-target classes. However, due to the high level
of imbalance in data distribution, the performance of
classifiers decline because they are often designed to
Soleymani, R., Granger, E. and Fumera, G.
Classifier Ensembles with Trajectory Under-Sampling for Face Re-Identification.
DOI: 10.5220/0005698300970108
In Proceedings of the 5th International Conference on Pattern Recognition Applications and Methods (ICPRAM 2016), pages 97-108
ISBN: 978-989-758-173-1
Copyright
c
2016 by SCITEPRESS – Science and Technology Publications, Lda. All rights reserved
97

optimize overall accuracy without taking into account
the relative distribution of each class. Therefore, they
become biased to correctly classifying the non-target
class. In fact, designing with imbalanced data results
in decision boundaries that move towards the minor-
ity class. To avoid this effect, most specialized ap-
proaches assume that the data is balanced for design-
ing the classification system, and then prior knowl-
edge of imbalance is used to bias decisions. However
in practical VS applications, this imbalance is not usu-
ally known and varies over time.
It is well-known that classifier ensembles can in-
crease accuracy and robustness over a single classi-
fier by combining uncorrelated classifiers (Rokach,
2010). A diverse pool of classifiers can be generated
to learn from subsets of imbalanced data (Galar et al.,
2012) selected using random under-sampling in RUS-
Boost(Seiffert et al., 2010), synthetic minority over-
sampling in SMOTEBoost (Chawla et al., 2003), and
cluster-based sampling (Yen and Lee, 2009; Li et al.,
2013). These ensembles re-balance training data to
avoid bias of performance towards the majority class.
However, information loss is an issue in the case of
under-sampling and high complexity is an issue for
up-sampling approaches. What’s more, the imbalance
itself, as an inherent property of data distribution, is
neglected, while using different skew levels is an ad-
ditional source of diversity between classifiers in an
ensemble.
Ensembles with random under-sampling (RUS)
are designed by training several base classifiers with
target samples and subsets of non-target samples se-
lected randomly. These classifiers may be accu-
rate because random subsets are representative of
the whole data. However, accurate classifiers often
fail to generate effective ensembles due to their lack
of diversity. Ensembles with cluster under-sampling
(CUS), in contrast, are designed using target samples
and non-target samples assigned to clusters based on
their proximity. These ensembles may be more effec-
tive than the RUS-based ensembles because they are
combined from diverse classifiers designed on differ-
ent parts of the feature space.
An application-based under-sampling method
could be more effective than the general-purposed
under-sampling methods described in literature in
terms of diversity and accuracy of opinions.
In fact, grouping samples based on contextual in-
formation, rather than solely based on their proxim-
ity in the feature space, may have greater diversity.
In addition, such non-target sampling technique may
allow the majority samples to be ordered to produce
efficient and diverse decision boundaries.
In many VS applications a tracker is used to fol-
low and regroup objects in a camera’s field of view
according to trajectories for spatio-temporal recogni-
tion. For example, the tracker could follow the posi-
tion of each person observed in the scene over consec-
utive frames, and the facial regions of interest (ROIs)
of the same person are collected into a trajectory. Fa-
cial samples in a trajectory are captured under differ-
ent operating conditions and consequently, they are
dispersed in the feature space compared to the sam-
ples from a cluster of data. Therefore, a pool of clas-
sifiers trained on samples from trajectories may pro-
vide ensemble of classifiers with greater diversity and
generalization.
In this paper, a new method is proposed to design
individual-specific ensembles, where the pool of two-
class classifiers is generated on data subsets that have
different data imbalances and complexities. Training
subsets contain a limited number of samples from tar-
get trajectory and a growing selection of samples from
non-target trajectories to minimize the risk of infor-
mation loss. Starting from one non-target trajectory
for the first subset, the level of imbalance (and deci-
sion bound complexity) is increased for the next sub-
sets by adding a number of non-target trajectories to
the previous ones. Two variants are proposed to se-
lect among the non-target trajectories. In the first one,
the trajectories are selected randomly and the contri-
bution of each classifier is weighted based on its ac-
curacy measured on a validation set. In the second
variant, non-target trajectories are selected based on
their proximity to the target trajectory. Since samples
in a trajectory do not follow a mono-modal distribu-
tion, the Hausdorff distance (Edgar, 2007) is used to
measure the distance between two trajectories. The
accuracy and diversity of ensembles of classifiers de-
signed with the proposed technique is compared to
reference methods from literature using videos in the
FIA dataset.
The rest of the paper is organized as follows. Sec-
tion 2 presents a review of ensemble techniques for
class imbalance in literature. Ensembles with trajec-
tory under-sampling are described in Section 3. Ex-
perimental methodology is given in Section 4. This is
followed by results and discussion in Section 5.
2 ENSEMBLES FOR CLASS
IMBALANCE
Data class distributions are imbalanced in many real-
world monitoring and surveillance applications such
as face re-identification, watch-list screening, fraud
detection and intrusion prevention. In these applica-
tions, the class with fewer samples is usually the tar-
ICPRAM 2016 - International Conference on Pattern Recognition Applications and Methods
98

get class and of more interest than the others.
Several approaches have been proposed in liter-
ature to handle imbalance as data-level, algorithm-
level, and cost-sensitive methods. Data-level ap-
proaches use an additional process to re-balance the
data distribution prior to or along with learning proce-
dure. This group includes variations of up-sampling
the minority class, under-sampling the majority class
or the combination of both of them. Some of the
baseline techniques in this category are SMOTE (syn-
thetic minority over-sampling technique) (Chawla
et al., 2002), cluster-based sampling (Yen and Lee,
2009), random under-sampling and One-sided Selec-
tion (OSS)(Kubat et al., 1997).
Algorithm-level methods are internal approaches
that create or modify algorithms to bias the system
accuracy towards the minority class (Wu and Chang,
2006). These methods require special knowledge of
both the corresponding classifier and the application
domain, comprehending why the classifier fails when
the class distribution is uneven (Rokach, 2010).
Cost-sensitive approaches introduce uneven mis-
classification cost factors for the samples from dif-
ferent classes such that minimizing the total cost will
provide a more robust algorithm for imbalance prob-
lem (Sun et al., 2007).
Ensembles of classifiers rely on the aforemen-
tioned methods to tune and combine several classi-
fiers’ performance under different conditions. The
optimal accuracy-diversity trade-off is a key factor
in the design of an accurate and effective ensemble
of classifiers(Rokach, 2009). Even though there is
no straightforward definition of diversity in literature,
base classifiers are usually deemed diverse when their
misclassification events are not correlated (Rokach,
2009). Therefore, neither of most accurate or least
accurate classifiers create efficient ensembles. Diver-
sity in generating ensembles to handle imbalance can
be obtained by training base classifiers on target sam-
ples and different overlapping and balanced subsets
of non-target data under-sampled randomly (Seiffert
et al., 2010), or non-overlapping partitions created ei-
ther randomly (Yan et al., 2003) or by clustering (Yen
and Lee, 2009; Li et al., 2013). In sample-based
approaches like random under-sampling (RUS) the
samples are treated independently, while in cluster-
based sampling techniques (Yen and Lee, 2009; Li
et al., 2013) the samples are under-sampled based on
their data distributions. For example, Li et al. (Li
et al., 2013) propose an ensemble with cluster under-
sampling (CUS), where each base classifier in the en-
semble is trained on target samples and a cluster of
the non-target class. The contribution of classifiers
trained on the samples that are closer to the decision
boundary is magnified by giving a higher weight to
their vote in the final decision based on the distance
between the mass centers of the non-target cluster
used to train that classifier and target class.
In several VS applications like person re-
identification, using contextual information to group
samples could provide a better modelling of data from
different people. For instance, the facial regions cap-
tured within trajectories are defined by different ge-
ometric and environmental conditions, so the facial
region of interest (ROI) patterns in a trajectory may
exhibit multi-modal distribution that are overlapping
or dispersed in the feature space. Accordingly, a pool
of 2-class classifiers that are trained on trajectories
may provide more variability and diversity and pro-
vide better decision bounds.
In the case of cluster-based under-sampling, data
samples are assumed to be defined by compact mono-
modal distributions. The classifiers trained on data
clusters may be diverse but they are not necessar-
ily accurate enough to create robust ensembles be-
cause data clusters may contain samples from differ-
ent individuals and they are not representative of real
data distribution. In RUS, the samples are selected
from all over the space and even though the classi-
fiers trained on them may be accurate, they are not
necessarily diverse enough to create robust ensem-
bles because these data subsets have similar distribu-
tions. Hence, an ensemble of classifiers designed with
trajectories can generalize better than ensembles of
classifiers trained on the clusters or randomly under-
sampled data. In addition, using different data imbal-
ances in designing classifiers increases the diversity
and complexity of decision bounds among them. The
diversity and accuracy of classifiers that are trained on
growing skew levels and complexity of data is higher
than the classifiers that are trained on the same skew
level and complexity of samples at a time.
To validate these hypotheses, the ROI patterns of 6
facial trajectories belonging to 6 individuals (assume
one target and 5 non-targets) from FIA
1
dataset (Goh
et al., 2005) are mapped to 2D space using Sammon
mapping (Sammon, 1969) (see Figure 1(a)).
Three ensembles of SVM classifiers with data
subsets selected by random under-sampling (RUS),
cluster-based under-sampling (CUS), and trajectory-
based under-sampling (TUS) are created with grow-
ing skew
2
level between base classifiers (called EoC-
GRUS, EoC-GCUS, EoC-GTUS). The first classifiers
1
The experimental methodology and FIA data set used
for validation is presented in Section 4.
2
Skew λ = π
p
: π
n
is defined as the proportion of positive
(minority target) samples π
p
to the negative (majority non-
target) ones π
n
.
Classifier Ensembles with Trajectory Under-Sampling for Face Re-Identification
99

in these ensembles are trained on balanced data and
the imbalance levels of the subsets used to train the
following classifiers are increased step by step. The
clusters and trajectories are selected in random order.
For CUS, the samples are regrouped into k = 6 (the
same number of trajectories for fair comparison) clus-
ters using k-means algorithm. In addition, the classi-
fiers are combined with unweighted majority voting
in all ensembles.
The decision boundary of three ensembles, EoC-
GRUS, EoC-GCUS, EoC-GTUS, in Figure 1(b) show
that EoC-GRUS has a decision boundary fitted to the
target class and the decision boundary of EoC-GCUS
invades the area of non-targets, while EoC-GTUS re-
sults in a decision boundary that covers target samples
without invading the non-target class area.
The diversity and performance of all three en-
sembles are compared in Figure 2, where they are
tested with several skew levels in test data. The re-
sults in Figure 2 support the hypotheses that EoC-
GTUS maintains higher level of diversity, and pro-
vides higher accuracy over skew values. The classi-
fiers in EoC-GRUS show the least diversity.
3 ENSEMBLES WITH
TRAJECTORY
UNDER-SAMPLING
The main objective of this paper is to design
individual-specific ensemble of 2-class classifiers that
allow to sustain a high level of accuracy and robust-
ness over variations in levels of data imbalance. A
novel ensemble generation technique is proposed in
which base 2-class classifiers are trained on growing
number of non-target trajectories. Varying this num-
ber maintains different levels of imbalance and com-
plexity between data subsets.
This approach is specialized for VS applications
like person re-identification, where faces or soft bio-
metrics are captured and regrouped in terms of tra-
jectories. A tracker assigns a track ID to each differ-
ent person appearing in the scene. During consecu-
tive frames, the tracker follows the positions of per-
sons and regroups the face captures along each track
into trajectories. Consider the faces captured in train-
ing video streams as S
tr
= {(x
i
,y
i
,ID
i
);i = 1, ...,M
tr
}
where y
i
∈ {+1,−1} indicates the class label, i.e. tar-
get (+1) or non-target (-1) classes, and ID
i
is the track
ID number assigned by the tracker to the face. Let
ID
+
be the track ID number assigned by tracker to
the target face. All target samples are grouped into
a trajectory t
+
= {(x
p
,y
p
) ∈ S
tr
|ID
p
= ID
+
}. In the
same way, the abundant non-target samples that are
assigned the same track ID are grouped into a non-
target trajectory as t
−
j
. By collecting all non-target
trajectories into a set T
−
= {t
−
j
; j = 1,..,N
−
}, the
non-targets are under-sampled by eliminating a num-
ber of t
−
j
s from this set.
To generate design data with several skew lev-
els, non-target samples in each subset are selected by
accumulating trajectories incrementally without re-
placement. However, two important concerns arise
with this ensemble generation technique. One is that
the performance of base classifiers in the ensemble
can be affected by the order of trajectories. Second is
that, how the ensemble size and the number of trajec-
tories for each classifier should be selected?
The order of trajectory selection can be random,
or from the closest to the farthest or from the farthest
to the closest. In random selection of trajectories, ef-
fectiveness of the classifiers in the ensemble cannot
be guaranteed and very poor classifiers can exist in
the final ensemble. This issue can be alleviated by
reducing the impact of less accurate classifiers in the
final decision of the ensemble.
Increasing the number of non-target samples and
consequently imbalance level in data subsets that
are used for training a classifier, moves its deci-
sion boundary towards target class (Liu et al., 2011).
Therefore, starting from the closest non-target trajec-
tory means starting from the fittest decision bound-
ary to the target class. Therefore, adding trajectories
to the existing ones aggravates the decision boundary
of the following classifiers in the ensemble and re-
duces diversity among them. However, starting from
the farthest decision boundary does not suffer from
these problems.
Two versions of ensembles with TUS are pro-
posed in this paper that differ with respect to two
factors: the way in which the non-target trajectories
are selected, and the contribution of each classifier in
the final prediction. These ensembles are described in
Sub-sections 3.1 and 3.2.
TUS-ensemble can be designed by training a pool
of classifiers equal to the number of non-target tra-
jectories. In other words, the skew level of design
data for each base classifier is approximately one level
higher than the previous one. However, the ensemble
size should be limited by using larger skew steps be-
tween base classifiers. In addition, bigger difference
between skew levels of classifiers in the ensemble re-
sult in higher diversity among them.
To select the ensemble size, we determine the
steps between skew levels based on the overall im-
balance level of design data. The level of imbalance
in a data distribution is typically calculated as the pro-
ICPRAM 2016 - International Conference on Pattern Recognition Applications and Methods
100
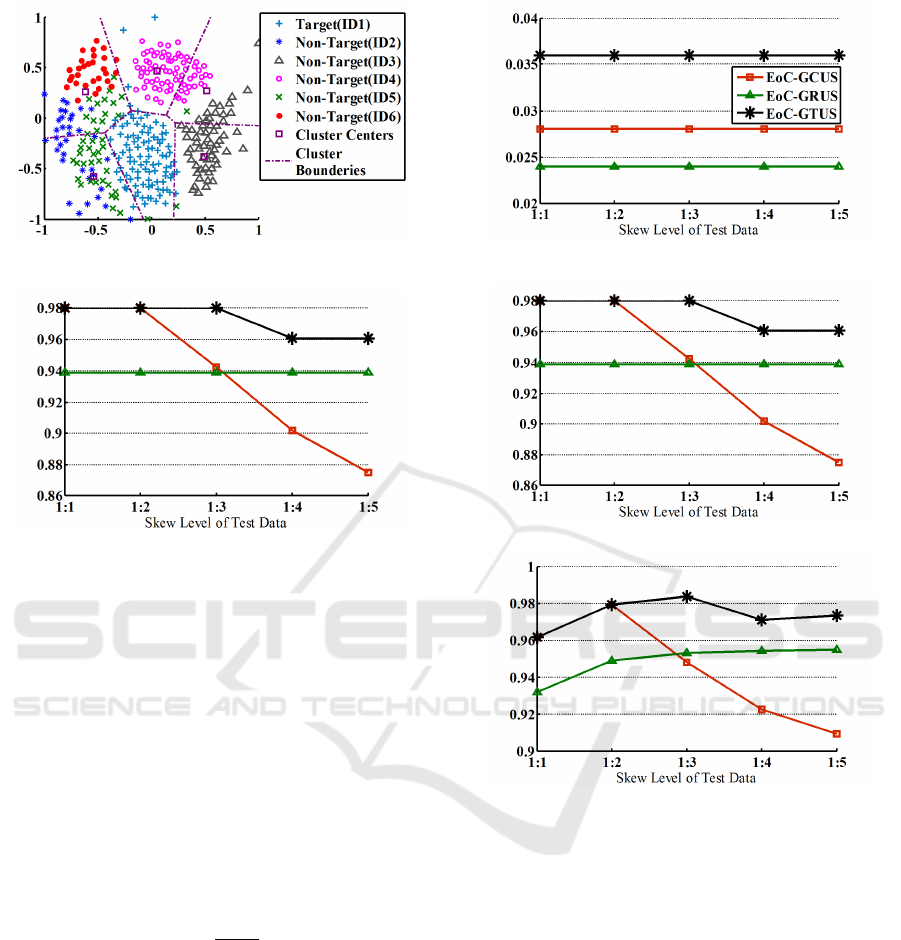
(a) Sammon mapping of a target trajectory and 5 non-
target trajectories clustered using k-means with k = 5.
(b) Decision boundaries of 3 ensembles with GRUS,
GCUS and GTUS.
Figure 1: Example of 2D data distribution and decision
boundaries of an individual-specific ensembles on FIA data
set.
portion of overall number of non-target samples to the
overall number of target ones (
M
−
/M
+
). In this paper,
the skew level is indicated in a different way based on
the number of trajectories. Letting N
−
be the num-
ber of non-target trajectories, N
+
be the number of
target trajectories (typically N
+
= 1 in a single video
sequence), and n
s
as the desired skew level difference
between two consecutive classifiers in the ensemble,
the number of imbalanced sets to design classifiers in
the ensemble n
e
, is determined as:
n
e
=
N
−
n
s
N
+
(1)
Considering the balanced case in addition to imbal-
anced ones, there are n
e
+ 1 classifiers in the ensem-
ble. Defining the skew level of e
th
classifier in the
ensemble as λ
e
, skew levels of data subsets in the en-
semble are determined from the set: Λ = {λ
e
|λ
0
=
1,λ
e
= n
s
× e,e = 1,2,...,n
e
}. As an example, if n
s
=
5 and
N
−
/5N
+
= 5.2 for a dataset, the number of clas-
sifiers in the ensemble will be n
e
+ 1 = 6, with skew
levels Λ = {1 : 1,1 : 5,1 : 10,1 : 15,1 : 20,1 : 25}.
(a) Disagreement measure diversity level for growing
skew levels.
(b) F
2
accuracy of GRUS, GCUS and GTUS.
(c) G-mean accuracy of GRUS, GCUS and GTUS.
Figure 2: Diversity and accuracy of ensembles produced
with GRUS, GCUS and GTUS on FIA dataset mapped to
the 2D space with Sammon mapping. The classifiers are
tested by sets of data with varying skew levels from 1:1 to
1:5.
3.1 Random Trajectory
Under-Sampling (RTUS)
In this version of EoC-TUS, in each design step, the
non-target trajectories are selected randomly to train
a new classifier for the ensemble. However, more im-
portance is given to the component classifiers with
better performance in classifying imbalanced data.
In AdaBoost, RUSBoost and similar ensembles, a
weight is assigned to each classifier based on its er-
ror rate e, as log((1 − e)/e)). In the case of classi-
fying imbalanced data distributions, accuracy is not
an appropriate measure to evaluate the performance
Classifier Ensembles with Trajectory Under-Sampling for Face Re-Identification
101

of a classifier. Therefore, in the proposed ensemble,
the weight of each base classifier is set based on its
performance measured using the F
2
-measure, because
this metric indicates classifier accuracy in correctly
identifying the target samples.
The pseudo code of EoC-RTUS is presented in Al-
gorithm 1. When a classifier is trained for the ensem-
ble it is tested with a validation subset to determine
its fusion weight. This validation subset should have
the same level of imbalance (λ
e
) as the training sub-
set. Based on λ
e
and the number of target samples
in validation set (M
+
val
), a number of non-target sam-
ples (M
−
val
= λ
e
×M
+
val
) is sampled randomly. The per-
formance F
e
of the e−th classifier in the ensemble is
measured in terms of F
2
-measure and its weight is as-
signed using:
w
e
= log
F
e
1 − F
e
(2)
This weight is then used to implement a for weighted
combination of the ensemble and the fusion function
could be decision-based or score-based.
3.2 Sorted Trajectory Under-Sampling
(STUS)
Some non-target trajectories are more relevant than
others, and can play a critical role in defining accurate
class boundary. Samples of non-target trajectories
that are closer to the target class are more relevant to
define good classifier decision bounds (Stefanowski
and Wilk, 2008). However, adding additional samples
to them to design new classifiers does not maintain
diversity and accuracy. Therefore, to generate EoC-
STUS (Algorithm 2), first the non-target trajectories
are sorted based on their proximity to the target class
using Hausdorff distance (Edgar, 2007). It measures
the distance between two sets of samples as the max-
imum of the minimum distances between pairs of el-
ements from the two sets (Satta et al., 2011). The
Hausdroff distance between all non-target trajectories
and target trajectory is calculated as:
d
j
= max{min k x
+
− x
−
k | x
+
∈ t
+
,x
−
∈ t
−
j
} (3)
Given D = {d
j
; j = 1, ...,N
−
|d
j
≥ d
j+1
}, the non-
target trajectories are sorted into T
−
s
= {t
−
j
; j =
1,..,N
−
} in the same order as D. Then, for training
the first classifier in the ensemble t
−
1
is selected from
T
−
s
and for the next e-th classifiers (e = 2,...,n
e
), {t
−
k
;
k = 1,...,λ
e
}) are used. Finally, the class of input data
is voted among the predictions of component classi-
fiers in the ensemble.
4 EXPERIMENTAL
METHODOLOGY
The Face In Action (FIA) video database (Goh et al.,
2005) has been used in our experiments to com-
pare proposed EoC-RTUS and EoC-STUS for face
re-identification with state of the art techniques, RUS-
Boost (Seiffert et al., 2010) and SeEn-SVM (Li et al.,
2013) as well as two single SVM classifiers with
RUS and without any preprocessing (SVM-RUS and
SVM, respectively). The performance is also com-
pared with EoC-RUS (ensemble of classifiers trained
on balanced randomly selected subset of samples),
EoC-CUS (ensemble of classifiers, each trained on
one cluster), EoC-TUS (ensemble of classifiers, each
trained on one trajectory), EoC-GRUS (ensemble of
classifiers trained on growing number of random sam-
ples), and EoC-GCUS (ensemble of classifiers trained
on growing number of clusters).
FIA dataset contains video sequences that emulate
a passport checking scenario with 221 participants.
The video streams are collected in different capture
conditions such as pose, illumination and expression,
in both indoor and outdoor environments in three ses-
sions each of which three months later than the pre-
vious one. The participants are present before 3 cam-
eras about 5 seconds, resulting in total of 18 video
sequences. Only the video sequences captured with
the frontal cameras in indoor environment have been
used for experiments. We selected one video for de-
sign (training+validation), and two videos are merged
for testing. Some individuals in the dataset appear in
both design and test video streams (176 of them) and
some (43) appear only in one of them. Target individ-
uals for experiments are selected from those that ap-
pear in both videos and for each target individual, 100
non-target trajectories are selected from both groups.
Regions of interest (ROIs) have been extracted
and rescaled using Viola Jones algorithm (Viola and
Jones, 2001) from all selected video sequences in tra-
jectories. Then, Multiresolution Gray-Scale and Ro-
tation Invariant Local Binary Patterns (LBP) (Ojala
et al., 2002) histograms have been extracted as fea-
tures. The local image texture for LBP has been char-
acterized with 8 neighbors on a 1 radius circle centred
on each pixel. Finally, a feature vector with the length
of 59 has been obtained for each ROI. Some examples
of ROIs in a trajectory from this data set are presented
in Figure 3.
A SVM with RBF kernel, K(x
0
,x
00
) =
exp(
− kx
0
− x
00
k
/2σ
2
), is used as the base classifier
in ensemble methods. The kernel parameter σ is
set as the average of the mean minimum distance
between any two training samples and the scatter
ICPRAM 2016 - International Conference on Pattern Recognition Applications and Methods
102

Algorithm 1: EoC-RTUS Algorithm.
Input:
• S
tr
= {(x
i
,y
i
);i = 1,...,M
tr
}: Training set
• S
val
= {(x
i
,y
i
);i = 1,...,M
val
}: Validation set
• y
i
∈ {+1,−1}: Class label of samples
• t
+
: Target trajectory
• T
−
= {t
−
j
; j = 1,..,N
−
}: Non-target trajectories
• X: Input probe sample
Output: Y ∈ {+1,−1}: Predicted label of X
// Design Phase //
1 Non-target trajectories are randomly shuffled into
T
−
r
= {t
−
j
; j = 1,..,N
−
}
2 The number of base classifiers N
e
and their skew
levels λ
e
for e = 1,2,..., n
e
:
n
e
= bN
−
/n
s
N
+
c, N
e
= n
e
+ 1,
Λ = {λ
e
|λ
0
= 1,λ
e
= n
s
e}
3 for e = 0,.., n
e
do
i Collect a subset of T
−
r
into
T
−
r,e
= {t
−
k
;k = 1,...,λ
e
}
ii Train a classifier C
e
on T
−
r,e
and t
+
iii under-sample the validation set S
val
randomly
to λ
e
level
iv F
e
← F
2
-measure attained by C
e
on the
validation subset
v Set the weight of C
e
as: w
e
= log(
F
e
1−F
e
)
// Test Phase //
4 for e = 0,.., n
e
do
h
e
(X) ← Output of C
e
(classification score or
decision) on X.
5 Combine the predictions of classifiers:
Y = sign
∑
n
e
e=0
(w
e
h
e
(X))
radius of the training samples in the input space (Li
et al., 2008). The scatter radius is calculated by select-
ing the maximum distance between the training sam-
ples and a point corresponding to the mean of train-
ing samples. We used the LibSVM implementation of
(Chang and Lin, 2011).
Six versions of EoC-STUS and EoC-RTUS have
been implemented. In three versions (EoC-RTUS-
1, EoC-STUS-1A and EoC-STUS-1D) n
s
is selected
as 1 so that the number of SVMs will be the same
as the maximum number of non-target trajectories
(100) and the skew levels of data subsets used to train
classifiers are determined from Λ
tr
= {1 : 1, 1 : 2, 1 :
3,...,1 : 100}. In EoC-STUS-1A and EoC-STUS-1D,
non-target trajectories are sorted based on their dis-
tance form target trajectory from the closest to the
farthest and from the farthest to the closest ones, re-
spectively. In the other three versions (EoC-RTUS-5,
EoC-STUS-5A and EoC-STUS-5D) n
s
is selected as
Algorithm 2: EoC-STUS Algorithm.
Input:
• S
tr
= {(x
i
,y
i
;i = 1,..., M
tr
}: Training set
• y
i
∈ {+1,−1}: Class label of samples
• t
+
: Target trajectory
• T
−
= {t
−
j
; j = 1,..,N
−
}: Non-target trajectories
• X: Input probe sample
Output: Y ∈ {+1,−1}: Predicted label of X
// Design Phase //
1 The Hausdorff distance ( Eq. 3 ) between all t
−
j
s and
t
+
are sorted into D = {d
j
; j = 1, ...,N
−
|d
j
≥ d
j+1
}
2 Non-target trajectories are sorted based on D into
T
−
s
= {t
−
j
; j = 1,..,N
−
}
3 The number of base classifiers N
e
and their skew
levels λ
e
for e = 1,2,..., n
e
:
n
e
= bN
−
/n
s
N
+
c, N
e
= n
e
+ 1,
Λ = {λ
e
|λ
0
= 1,λ
e
= n
s
e}
4 for e = 0,.., n
e
do
i Collect a subset of T
−
s
into
T
−
s,e
= {t
−
k
, k = 1, ...,λ
e
}
ii Train a classifier C
e
on T
−
s,e
and t
+
// Test Phase //
5 for e = 0,.., n
e
do
h
e
(X) ← Output of C
e
(classification score or
decision) on X.
6 Combine the predictions of classifiers:
Y = sign
∑
n
e
e=0
(h
e
(X))
5 and the number of SVMs is selected as 21 obtained
based on Eq. 1. The skew levels of data subsets used
to train classifiers in these three versions are deter-
mined from Λ
tr
= {1 : 1, 1 : 5,1 : 10,1 : 15,1 : 20,...,1 :
100}. The number of SVMs in the RUSBoost has
been also set to 21 for the sake of fair comparison.
The number of classifiers in the SeEn-SVM is
given by 2
n
0
, where n
0
= min
n
{|q − 2
n
|,n = 1,2,...},
q =
M
−
/5M
+
. The number of classifiers in EoC-RUS,
EoC-GRUS, EoC-CUS, EoC-GCUS and EoC-TUS
are set to 100 to be comparable to EoC-RTUS-1, EoC-
STUS-1A and EoC-RTUS-1D. In our experimental
protocol, the results have been averaged by alternat-
ing the target individual among overall 10 target indi-
viduals in each round of the evaluation process, and
for each target individual, the algorithms have been
replicated 10 times using 5-fold cross-validation to
generate design data; 2-folds for training and 3 folds
for validation. In addition, in each replication, the
test data has been under-sampled randomly to create
subsets with different skew levels Λ
test
= {1 : 1,1 :
20,1 : 50,1 : 100} to evaluate the robustness of each
approach over varying skew levels during operation.
Classifier Ensembles with Trajectory Under-Sampling for Face Re-Identification
103
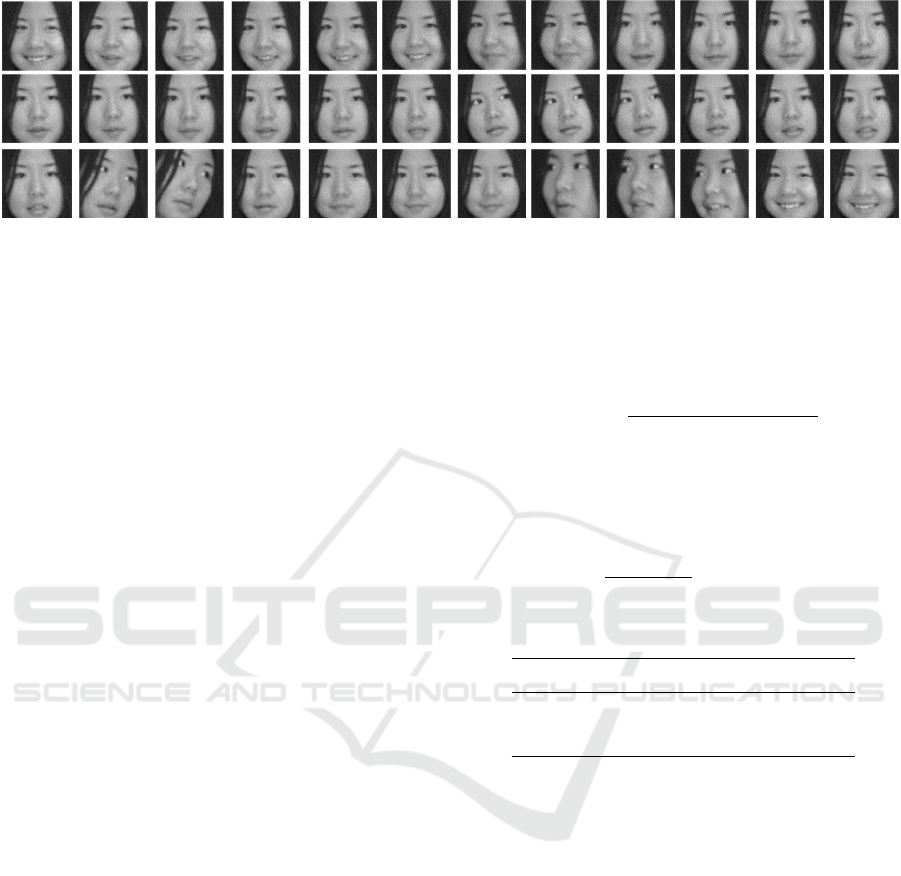
Figure 3: Examples of 70× 70 pixels ROIs in a trajectory captures with camera 3, during section one for ID004.
The performance of the new and reference sys-
tems is assessed in the Receiver Operating Curve
(ROC) and Precision-Recall spaces. Performance
metrics that rely on the simple accuracy are ill-suited
for evaluating 2-class classification problems with im-
balanced distributions. In fact, ROC space does not
reflect the impact of imbalance (Fawcett, 2006). False
positive rate (FPR) is defined as the proportion of mis-
classified non-targets to the number of non-targets.
With highly imbalanced data, FPR stays small and
therefore ROC curve tends to locate at the left part
of ROC space. In contrast, precision measures the
proportion of correctly classified target class samples
to the number of samples that are predicted as target
class. Recall or true positive rate (TPR) measures the
proportion of target samples that are predicted cor-
rectly to overall number of target samples. To avoid
calibration of decision threshold systems are com-
pared using two global scalar metrics: area under re-
ceiver operating (AUC) and area under the precision-
recall curve (AUPR).
Several measures of ensemble diversity have been
introduced in literature (Kuncheva and Whitaker,
2003) that are mostly calculated based on the rela-
tion between the predictions of pairs of classifiers on
a given validation set of data. Disagreement measure
indicates the ratio of correct predictions of classifiers
by taking into account only those correct predictions
that are not from the same classifiers. However, due
to abundance of samples in one class in imbalanced
distribution of classes, the diversity measures mostly
present the level of disagreement between classifiers
on identifying majority class (or non-targets). This
problem can be alleviated by measuring the diversity
level on balanced distribution of classes or by giving
higher significance to the minority (target) samples.
In order to reduce significance of non-target sam-
ples in measuring diversity, the disagreement metric
is measured here only on target samples to indicate
the level of disagreement between classifiers on cor-
rectly classifying the target samples. Therefore, the
value of this metric contains information on both ac-
curacy and diversity of base classifiers in the ensem-
ble on target samples. Considering D
m
and D
n
as de-
cisions of a pair of classifiers on a validation data, the
pairwise disagreement measure Dis
m,n
between them
is calculated based on diversity matrix in Table 1 as:
Dis
m,n
=
D
cw
+ D
wc
D
cw
+ D
wc
+ D
cc
+ D
ww
(4)
Disagreement measure varies between 0 and 1, value
of 1 representing the most desirable diversity level.
For N
e
classifiers in the ensemble, Dis
av
is obtained
from:
Dis
av
=
2
N
e
(N
e
− 1)
N
e
−1
∑
m=1
N
e
∑
n=m+1
Dis
m,n
(5)
Table 1: Diversity measure matrix.
D
n
correct D
n
wrong
D
m
correct D
cc
D
cw
D
m
wrong D
wc
D
ww
5 RESULTS AND DISCUSSION
Tables 2 and 3 present the average AUPR and AUC
performance of the proposed EoC-RTUS and EoC-
STUS techniques compared to several baseline tech-
niques. The average AUPR values are significantly
higher for EoC-TUS and EoC-CUS than other sys-
tems over all test-set skew levels. However, their
AUC value is low because they are successful in cor-
rectly classifying target class in expense of misclas-
sifying higher number of non-target samples. EoC-
RTUS-1, EoC-STUS-1D, EoC-STUS-5 and RUS-
Boost result in a comparable AUC, while EoC-STUS-
5D is more efficient in recognizing target samples
in terms of AUPR. EoC-TUS outperforms EoC-CUS
and EoC-RUS in terms of both AURP and AUC.
These results support the hypothesis given in Section
3 that using an application-based contextual informa-
tion like tracking information to under-sample data
ICPRAM 2016 - International Conference on Pattern Recognition Applications and Methods
104

result in a more efficient ensemble of classifiers com-
pared to CUS and RUS.
Most of the ensembles in this experiment are ro-
bust to different skew levels in test data in terms of
AUC and AUPR. This suggest that these ensembles
can be optimized by proper selection of their decision
threshold in different skew levels of test data. In con-
trast, the performance of SVM, SVM-RUS and RUS-
Boost in terms of AUPR declines considerably as the
imbalance level of test data increases.
For all three under-sampling methods (RUS, CUS
and TUS), growing imbalance levels between clas-
sifiers in GRUS, GCUS and GTUS result in a more
desirable AUC and AUPR performance. Among dif-
ferent versions of EoC-GTUS, it is observed that en-
sembles that are designed with non-target trajectories
gradually learned in a descending order w.r.t. their
distance from target trajectory outperform ensembles
designed with non-target trajectories learned in an as-
cending order.
In Figure 4, RUSBoost and EoC-STUS-5D main-
tain the highest level of diversity. Classifiers in
EoC-STUS-5D and EoC-RTUS-5 are more diverse
than other ensembles including SeEn-SVM and EoC-
GRUS, proving that training classifiers on growing
imbalance levels of trajectories starting from the far-
thest ones is more effective than RUS, GRUS, CUS
and GCUS.
It is worth mentioning that, eventhough EoC-
RTUS-1 and EoC-STUS-1 are implemented with
larger ensemble sizes, they are not as effective as
EoC-RTUS-5 and EoC-STUS-5 from both accuracy
and diversity view points because bigger steps in skew
level and complexity of decision boundaries generate
more pair-wise diversity among classifiers and conse-
quently more effective ensembles.
In terms of computation complexity, training run-
time of ensembles in this experiment is shown in Fig-
ure 5. Figure 5(a) compares the runtime of ensembles
with the same size as N
−
= 100 and Figure 5(b) com-
pares the runtime of ensembles with the same size as
N
e
= 21. In Figure 5(a), GRUS, GCUS and GTUS
take more time for training compared to RUS, CUS
and TUS. This was expected because all classifiers in
RUS, CUS and TUS are trained on a balanced set of
samples, while the size of training subsets in GRUS,
GCUS and GTUS is growing from the first classifier
to the last one.
For both ensemble sizes, since EoC-RTUS re-
quires a validation step for each classifier in the en-
semble, the runtime of EoC-RTUS is longer than
EoC-STUS. EoC-STUS with sorting trajectories in
ascending order of their distances to the target trajec-
tory take more training time compared to EoC-STUS
with sorting trajectories in descending order. RUS-
Boost and SeEn-SVM train the classifiers on a bal-
anced number of samples. However, in each iteration
of RUSBoost, a validation process is carried out that
tests the classifier on all samples and this makes RUS-
Boost time consuming.
6 CONCLUSION
In this paper, a novel technique is proposed for the de-
sign of individual-specific ensembles to address the
class imbalance problem in person re-identification
applications. In ensembles with trajectory under-
sampling (EoC-TUS), training subsets contain sam-
ples from target trajectory and a growing selection
of samples from non-target trajectories to minimize
the risk of information loss. Instead of using general-
purpose under-sampling techniques such as random
or cluster-based under-sampling, contextual informa-
tion (i.e., trajectory structure) is exploited to under-
sample from an abundance of non-target data to de-
sign diverse ensembles of 2-class classifiers. Start-
ing from one target and non-target trajectory for the
first subset, the level of imbalance and decision bound
complexity is increased for the next subsets by adding
non-target trajectories to the previous ones. Variants
of these ensembles can give more importance to the
most efficient classifiers in recognizing target sam-
ples, or define efficient and diverse decision bound-
aries by starting selection of trajectories from the far-
thest ones to the target class. Experimental results ob-
tained using videos of the FIA data set indicate that
the proposed EoC-TUS outperforms several baseline
techniques over a range of test-set imbalance levels.
Although using all non-target trajectories eliminate
the risk of information loss, not all samples are infor-
mative and yield better generalization generalization.
In future work, a more sophisticated selection scheme
that account for the multi-modal distribution of trajec-
tories will be investigated to select trajectories such
that ensembles maintain higher diversity while reduc-
ing amount of redundant data and training time.
ACKNOWLEDGEMENTS
This work was partially supported by the Natural Sci-
ences and Engineering Research Council of Canada.
Classifier Ensembles with Trajectory Under-Sampling for Face Re-Identification
105
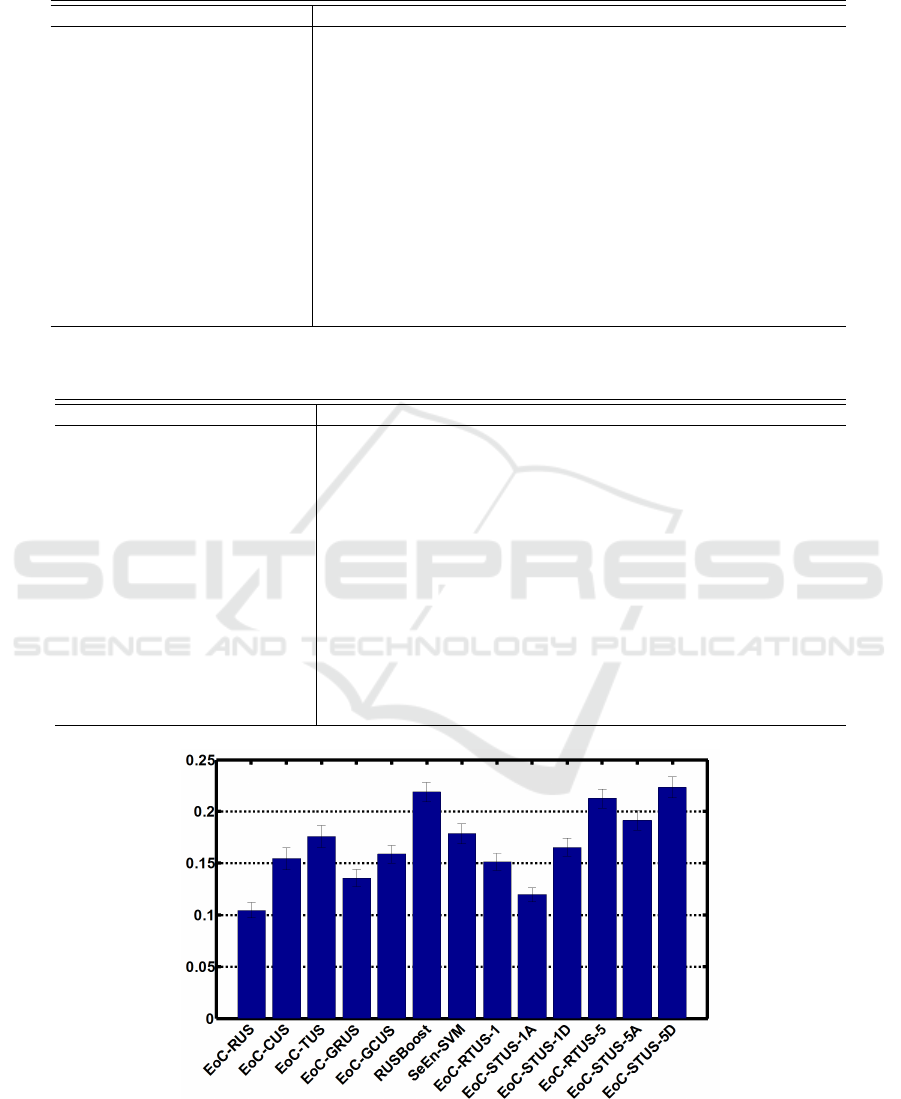
Table 2: Average of AUPR performance of proposed and baseline techniques over 10 target individuals, each with 10 replica-
tions, over class imbalance values in the test-set.
Classification System λ
test
1:1 1:20 1:50 1:100
SVM 0.61 ± 0.010 0.28 ± 0.014 0.22 ± 0.013 0.19 ± 0.013
SVM-RUS 0.75 ± 0.018 0.46 ± 0.027 0.37 ± 0.028 0.31 ± 0.027
EoC-RUS 0.48 ± 0.019 0.45 ± 0.019 0.44 ± 0.019 0.43 ± 0.019
EoC-CUS 0.87 ± 0.012 0.87 ± 0.011 0.87 ± 0.011 0.87 ± 0.011
EoC-TUS 0.87 ± 0.012 0.87 ± 0.011 0.88 ± 0.011 0.88 ± 0.011
EoC-GRUS 0.47 ± 0.019 0.47 ± 0.019 0.47 ± 0.019 0.47 ± 0.019
EoC-GCUS 0.58 ± 0.023 0.58 ± 0.023 0.58 ± 0.023 0.58 ± 0.023
RUSBoost (Seiffert et al., 2010) 0.79 ± 0.020 0.47 ± 0.020 0.37 ± 0.020 0.30 ± 0.020
SeEn-SVM (Li et al., 2013) 0.70 ± 0.022 0.46 ± 0.022 0.46 ± 0.022 0.46 ± 0.022
EoC-RTUS-1 0.64 ± 0.022 0.64 ± 0.022 0.64 ± 0.022 0.64 ± 0.022
EoC-STUS-1A 0.45 ± 0.019 0.45 ± 0.019 0.45 ± 0.019 0.45 ± 0.019
EoC-STUS-1D 0.65 ± 0.015 0.65 ± 0.015 0.65 ± 0.015 0.65 ± 0.015
EoC-RTUS-5 0.65 ± 0.029 0.65 ± 0.029 0.65 ± 0.029 0.65 ± 0.029
EoC-STUS-5A 0.56 ± 0.020 0.56 ± 0.020 0.56 ± 0.020 0.56 ± 0.020
EoC-STUS-5D 0.75 ± 0.017 0.75 ± 0.017 0.75 ± 0.017 0.75 ± 0.017
Table 3: Average of AUC performance of proposed and baseline techniques over 10 target individuals, each with 10 replica-
tions, over class imbalance values in the test-set.
Classification System λ
test
1:1 1:20 1:50 1:100
SVM 0.37 ± 0.014 0.37 ± 0.014 0.37 ± 0.014 0.37 ± 0.014
SVM-RUS 0.44 ± 0.023 0.44 ± 0.023 0.44 ± 0.023 0.44 ± 0.023
EoC-RUS 0.52 ± 0.021 0.52 ± 0.021 0.52 ± 0.021 0.52 ± 0.021
EoC-CUS 0.50 ± 0.030 0.51 ± 0.029 0.51 ± 0.029 0.51 ± 0.029
EoC-TUS 0.60 ± 0.027 0.61 ± 0.026 0.61 ± 0.026 0.61 ± 0.026
EoC-GRUS 0.54 ± 0.022 0.54 ± 0.022 0.54 ± 0.022 0.54 ± 0.022
EoC-GCUS 0.60 ± 0.020 0.59 ± 0.019 0.60 ± 0.019 0.60 ± 0.019
RUSBoost (Seiffert et al., 2010) 0.70 ± 0.021 0.69 ± 0.021 0.69 ± 0.021 0.69 ± 0.021
SeEn-SVM (Li et al., 2013) 0.65 ± 0.021 0.66 ± 0.020 0.66 ± 0.020 0.66 ± 0.020
EoC-RTUS-1 0.68 ± 0.023 0.68 ± 0.023 0.68 ± 0.023 0.68 ± 0.023
EoC-STUS-1A 0.52 ± 0.018 0.52 ± 0.017 0.52 ± 0.017 0.52 ± 0.017
EoC-STUS-1D 0.69 ± 0.020 0.69 ± 0.020 0.69 ± 0.020 0.69 ± 0.020
EoC-RTUS-5 0.63 ± 0.027 0.63 ± 0.027 0.63 ± 0.027 0.63 ± 0.027
EoC-STUS-5A 0.57 ± 0.019 0.58 ± 0.017 0.58 ± 0.018 0.58 ± 0.018
EoC-STUS-5D 0.69 ± 0.015 0.70 ± 0.014 0.69 ± 0.014 0.69 ± 0.014
Figure 4: Average of diversity (disagreement measure) of proposed and baseline techniques over 10 target individuals and 10
replications. Dispersion measures are standard errors of the sample mean.
ICPRAM 2016 - International Conference on Pattern Recognition Applications and Methods
106
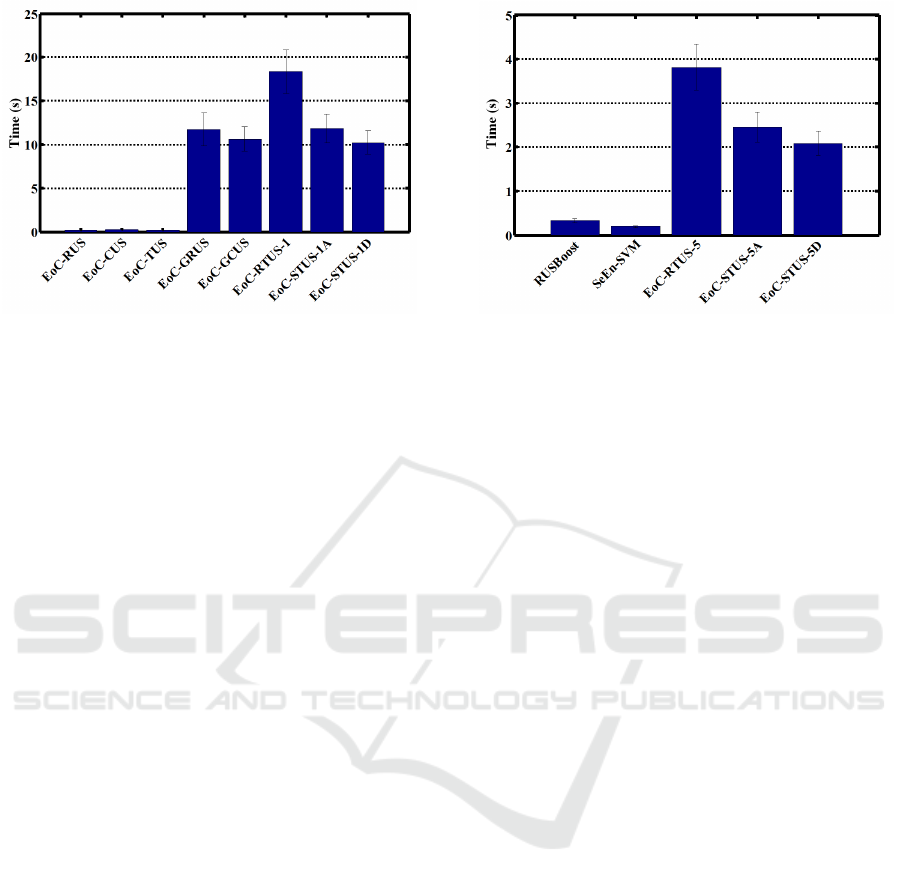
(a) Average training time of ensembles of size N
−
= 100. (b) Average training time of ensembles of size N
e
= 21.
Figure 5: Average of training runtime of proposed and baseline techniques over 10 target individuals and 10 replications.
Dispersion measures are standard errors of the sample mean.
REFERENCES
Bedagkar-Gala, A. and Shah, S. K. (2014). A survey of ap-
proaches and trends in person re-identification. Image
and Vision Computing, 32(4):270–286.
Chang, C.-C. and Lin, C.-J. (2011). Libsvm: a library for
support vector machines. ACM Transactions on Intel-
ligent Systems and Technology, 2(3):27.
Chawla, N. V., Bowyer, K. W., Hall, L. O., and Kegelmeyer,
W. P. (2002). Smote: synthetic minority over-
sampling technique. Journal of artificial intelligence
research, 16(1):321–357.
Chawla, N. V., Lazarevic, A., Hall, L. O., and Bowyer,
K. W. (2003). Smoteboost: Improving prediction of
the minority class in boosting. In Knowledge Discov-
ery in Databases: PKDD 2003, pages 107–119.
De-la Torre, M., Granger, E., Radtke, P. V., Sabourin, R.,
and Gorodnichy, D. O. (2015a). Partially-supervised
learning from facial trajectories for face recognition in
video surveillance. Information Fusion, 24:31–53.
De-la Torre, M., Granger, E., and Sabourin, R. (2015b).
Adaptive skew-sensitive fusion of ensembles and their
application to face re-identification. Pattern Recogni-
tion, 48:3385–3406.
Edgar, G. (2007). Measure, topology, and fractal geometry.
Springer Science & Business Media.
Fawcett, T. (2006). An introduction to roc analysis. Pattern
recognition letters, 27(8):861–874.
Galar, M., Fernandez, A., Barrenechea, E., Bustince, H.,
and Herrera, F. (2012). A review on ensembles for
the class imbalance problem: bagging-, boosting-, and
hybrid-based approaches. Systems, Man, and Cyber-
netics, Part C: Applications and Reviews, IEEE Trans-
actions on, 42(4):463–484.
Goh, R., Liu, L., Liu, X., and Chen, T. (2005). The cmu face
in action (fia) database. In Analysis and Modelling of
Faces and Gestures, pages 255–263.
Kubat, M., Matwin, S., et al. (1997). Addressing the curse
of imbalanced training sets: one-sided selection. In
ICML, volume 97, pages 179–186. Nashville, USA.
Kuncheva, L. I. and Whitaker, C. J. (2003). Measures
of diversity in classifier ensembles and their relation-
ship with the ensemble accuracy. Machine learning,
51(2):181–207.
Li, Q., Yang, B., Li, Y., Deng, N., and Jing, L. (2013). Con-
structing support vector machine ensemble with seg-
mentation for imbalanced datasets. Neural Computing
and Applications, 22(1):249–256.
Li, X., Wang, L., and Sung, E. (2008). Adaboost with
svm-based component classifiers. Engineering Appli-
cations of Artificial Intelligence, 21(5):785–795.
Liu, Y., Yu, X., Huang, J. X., and An, A. (2011). Combining
integrated sampling with svm ensembles for learning
from imbalanced datasets. Information Processing &
Management, 47(4):617–631.
Ojala, T., Pietikainen, M., and Maenpaa, T. (2002). Mul-
tiresolution gray-scale and rotation invariant texture
classification with local binary patterns. Pattern Anal-
ysis and Machine Intelligence, IEEE Transactions on,
24(7):971–987.
Pagano, C., Granger, E., Sabourin, R., Marcialis, G., and
Roli, F. (2014). Adaptive ensembles for face recogni-
tion in changing video surveillance environments. In-
formation Sciences, 286:75–101.
Radtke, P. V., Granger, E., Sabourin, R., and Gorodnichy,
D. O. (2014). Skew-sensitive boolean combination for
adaptive ensembles–an application to face recognition
in video surveillance. Information Fusion, 20:31–48.
Rokach, L. (2009). Taxonomy for characterizing ensemble
methods in classification tasks: A review and anno-
tated bibliography. Computational Statistics & Data
Analysis, 53(12):4046–4072.
Rokach, L. (2010). Ensemble-based classifiers. Artificial
Intelligence Review, 33(1-2):1–39.
Sammon, J. W. (1969). A nonlinear mapping for data
structure analysis. IEEE Transactions on computers,
18(5):401–409.
Classifier Ensembles with Trajectory Under-Sampling for Face Re-Identification
107

Satta, R., Fumera, G., Roli, F., Cristani, M., and Murino, V.
(2011). A multiple component matching framework
for person re-identification. In Image Analysis and
Processing–ICIAP 2011, pages 140–149. Springer.
Seiffert, C., Khoshgoftaar, T. M., Van Hulse, J., and Napoli-
tano, A. (2010). Rusboost: A hybrid approach to alle-
viating class imbalance. Systems, Man and Cybernet-
ics, Part A: Systems and Humans, IEEE Transactions
on, 40(1):185–197.
Stefanowski, J. and Wilk, S. (2008). Selective pre-
processing of imbalanced data for improving classifi-
cation performance. In Data Warehousing and Knowl-
edge Discovery, pages 283–292. Springer.
Sun, Y., Kamel, M. S., Wong, A. K., and Wang, Y. (2007).
Cost-sensitive boosting for classification of imbal-
anced data. Pattern Recognition, 40(12):3358–3378.
Viola, P. and Jones, M. (2001). Rapid object detection using
a boosted cascade of simple features. In Computer Vi-
sion and Pattern Recognition, 2001. CVPR 2001. Pro-
ceedings of the 2001 IEEE Computer Society Confer-
ence on, volume 1, pages I–511. IEEE.
Wu, E. Y. G. and Chang, K. (2006). Kernel boundary align-
ment considering unbalanced data distribution. IEEE
Trans. Knowl. Data Eng, 17(6):786–796.
Yan, R., Liu, Y., Jin, R., and Hauptmann, A. (2003). On
predicting rare classes with svm ensembles in scene
classification. In Acoustics, Speech, and Signal Pro-
cessing, 2003. Proceedings.(ICASSP’03). 2003 IEEE
International Conference on, volume 3, pages III–21.
IEEE.
Yen, S.-J. and Lee, Y.-S. (2009). Cluster-based under-
sampling approaches for imbalanced data distribu-
tions. Expert Systems with Applications, 36(3):5718–
5727.
ICPRAM 2016 - International Conference on Pattern Recognition Applications and Methods
108
