
A Flexible PET-based Wearable Sensor for Arterial Pulse Waveform
Measurement
Dan Wang
1
, Dean Krusienski
2
and Zhili Hao
1
1
Department of Mechanical and Aerospace Engineering, Old Dominion University, Norfolk, VA, U.S.A.
2
Electrical and Computer Engineering, Old Dominion University, Norfolk, VA, U.S.A.
Keywords: Wearable Sensors, Microfluidics, Arterial Pulse Waveform, Baseline Drift, Health Monitoring.
Abstract: In light of the need of health monitoring, the paper presents a flexible polyethylene terephthalate (PET)-
based wearable sensor for arterial pulse waveform measurement. The sensor encompasses a
polydimethylsiloxane (PDMS) microstructure embedded with an electrolyte-enabled 5×1 transducer array,
which spans 6mm and has a spatial resolution of 1.5mm. A pulse signal exerts a deflection on the
microstructure and is recorded as a resistance change by a transducer at the site of the pulse. An untrained
individual can easily align the sensor on a targeted artery with a negligible margin and then acquire the
arterial pulse waveform continuously and non-invasively. This sensor is fabricated using microfluidics
technology and thus features low cost for mass production. The sensor is hand-held on an artery and records
its pulse signal for a 10s period, which bears baseline drift, due to the respiration and the motion artifact.
Discrete Meyer Wavelet Transform (DMWT) and Cubic Spline Estimation (CSE) are employed to remove
baseline drift in a pulse signal. The pulse waveform is expressed in terms of the sensor deflection as a
function of time. Carotid arterial pulse waveforms are measured by the sensor on three subjects at rest and
on two subjects post-exercise. Additionally, radial arterial waveforms are measured on one subject at rest.
The measured pulse pattern change of the two subjects between at rest and post-exercise is consistent with
the literature. As the pulse transmits from central (carotid) to peripheral (radial) for one subject, the ratio of
amplitude of main peak to amplitude of dicrotic wave goes up and the up-stroke time becomes shorter. This
is consistent with the related observations in the literature. Thus, the limited amount of data collected here
demonstrates the feasibility of using the sensor as a wearable health monitoring device.
1 INTRODUCTION
Arterial pulse waveforms are intimately associated
with the physiological conditions of the
cardiovascular system and thus provide valuable
information of the diagnosis and treatment of
Cardiovascular disease (CVD) (Lin et al., 2013). As
reported by the World Health Organization, CVDs
are the number one cause of death globally: more
people die annually from CVDs than from any other
cause (Lin et al., 2013). For this reason, various
devices and techniques have been developed for
arterial pulse waveform measurement, or arterial
tonometry. To date, a few devices for arterial
tonometry, including a flexible pulse monitoring
system from Pressure Profile System (PPS) (Hu et
al., 2012) and CASPal system that measures Central
Aortic Systolic Pressure (CASP) from HealthStats
(Saugel et al., 2014), are commercially available and
have been successfully employed for arterial pulse
waveform measurement. However, current
tonometric devices are unsuitable for not only
wearing with relative comfort but also for an
untrained individual to use at home.
Recently, based on microfluidics technology, a
polyethylene terephthalate (PET)-based sensor array
to monitor arterial pressure waveforms is developed
(Digiglio et al., 2014). Although this PET-based
sensor array offers quite a few attractive features for
daily use by an untrained individual, it entails
complex fabrication process, including bonding
three layers together and injecting electrolyte into
each individual sensor in the sensor array.
Meanwhile, its spatial resolution of 5mm×5mm is
well above the typical size of a carotid and radial
artery, and thus the sensor array may risk having no
transducers placed right above the target artery.
To address the above-mentioned two issues
66
Wang, D., Krusienski, D. and Hao, Z.
A Flexible PET-based Wearable Sensor for Arterial Pulse Waveform Measurement.
DOI: 10.5220/0005698000660075
In Proceedings of the 9th International Joint Conference on Biomedical Engineering Systems and Technologies (BIOSTEC 2016) - Volume 1: BIODEVICES, pages 66-75
ISBN: 978-989-758-170-0
Copyright
c
2016 by SCITEPRESS – Science and Technology Publications, Lda. All rights reserved
preserving the attractive features of the sensor array,
this paper presents a PET-based sensor for arterial
pulse waveform measurement. With a flexible
substrate, this sensor bears the same design of a
Pyrex-based sensor previously developed by our
group (Cheng et al., 2013; Gu et al., 2013). The core
of the sensor is a single polydimethylsiloxane
(PDMS) microstructure embedded with an
electrolyte-enabled resistive transducer array
underneath. The spatial resolution of 1.5mm of the
transducer array allows aligning one of them right at
the site of an artery with a negligible margin. A
simple, low-cost fabrication process is developed for
realizing this PET-based sensor, where a new
bonding process is employed to strengthen the
bonding between the PDMS microstructure and the
PET substrate with indium titanium oxide (ITO)
electrodes. The fabricated sensor is further utilized
to measure carotid arterial pulse waveforms of three
subjects and radial arterial pulse waveforms of one
subject, and the measured results are compared with
the related information in the literature for
demonstrating its feasibility.
2 SENSOR DESIGN AND
FABRICATION
2.1 Sensor Design
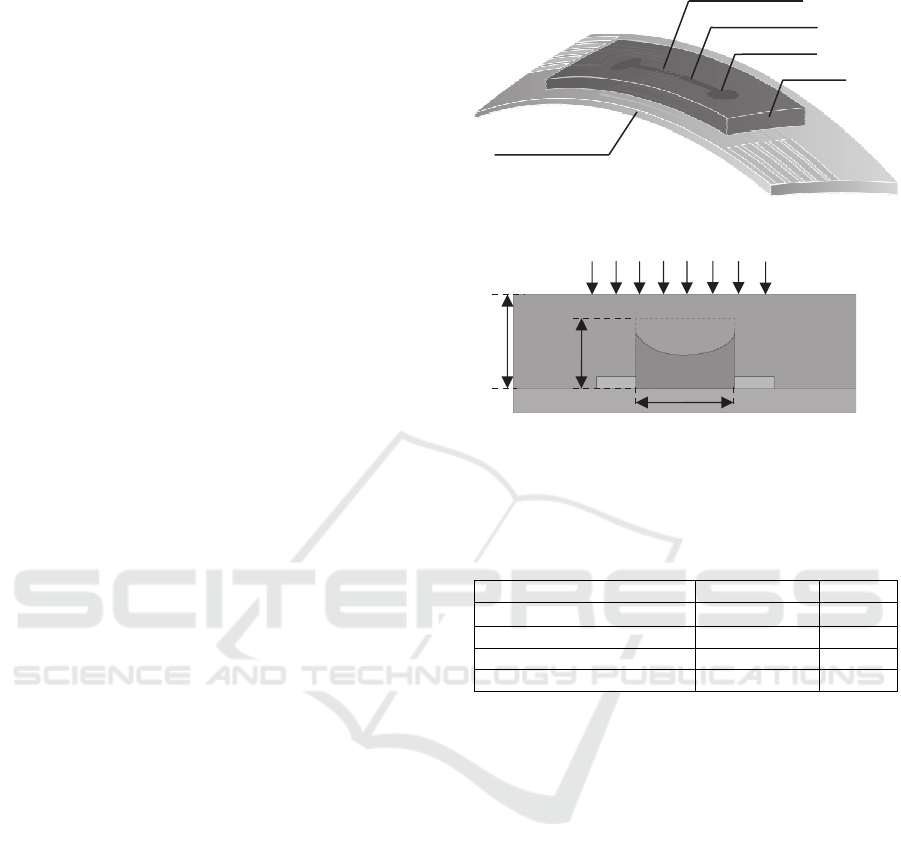
Figure 1 depicts the configuration of the PET-based
sensor. The sensor encompasses a rectangular
PDMS microstructure embedded with an electrolyte-
filled microchannel, and a set of ITO electrode pairs
distributed along the microchannel length. The
portion of electrolyte across an electrode pair
functions as a resistive transducer, whose resistance
varies with the bottom deflection of the
microstructure at its location and is routed out by the
electrode pair. Thus, together with the set of
electrode pairs, one body of electrolyte in the
microchannel forms a 5×1 transducer array with a
spatial resolution of 1.5mm.
Distributed deflection acting on the top of the
microstructure translates to the bottom deflection of
the microstructure and thus geometrical changes of
the microchannel, which register as resistance
changes by the transducer array. Table 1 summarizes
the key design parameters of the sensor. The details
of the sensor design can be found in the literature
(Cheng et al., 2013; Gu et al., 2013).
(a)
(b)
Figure 1: Configuration of microfluidic sensor: (a) 3D
view with labelling; (b) side view with key design
parameters being labelled.
Table 1: Key design parameters of the PET-based sensor.
Parameter Value Symbol
Microchannel cross-section
1mm×80µm w
e
×h
e
Microchannel length 30mm L
e
Spatial resolution 1.5mm d
e
Microstructure thickness 1.2mm h
m
2.2 Fabrication Process
Figure 2 illustrates a low-cost, two-mask fabrication
process for realizing the PET-based sensor. The
process starts with a commercial ITO/PET sheet (a
0.2mm-thick PET substrate coated with
120nm~160nm-thick ITO layer). To pattern ITO
electrodes on the PET substrate, a 15m-thick dry
film (Alpho NIT 215, NichigoMorton Co., Ltd.) is
laminated onto the PET substrate. Via the first mask,
electrode pattern is transferred to the dry film, which
is followed by wet etching of the ITO layer to form
ITO electrodes. Afterward, the dry film is removed
using ethanol. Via the second mask, a SU8 mold is
created on a Pyrex substrate. Then, a mixture of
curing agent to PDMS elastomer with a weight ratio
of 1:10 is poured over the SU8 mold. After being
cured at room temperature over 24hrs, the
microstructure is peeled off from the SU8 mold and
a hole is punched into each reservoir using a needle.
To strengthen the bonding strength between the
PDMS microstructure and the PET substrate with
h
e
h
m
Pulse Signal
w
e
Microchannel
Reservoi
r
PET Substrate
PDMS
ITO Electrodes
A Flexible PET-based Wearable Sensor for Arterial Pulse Waveform Measurement
67
patterned ITO electrodes, a chemical gluing strategy
is adopted (Tang and Lee, 2010, Tsuwaki et al.,
2014). First, photoresist is placed onto the
microchannel of the microstructure. Then, the
patterned ITO electrodes and the microstructure are
activated with hydroxyl groups by an oxygen plasma
treatment for 1 minute, which are followed by
immersing the microstructure and ITO electrodes
into 1% (v/v) 3-Glycidyloxypropyltrimethoxysilane
(GOPTS) and 5% (v/v) 3-
Aminopropyltriethoxysilane (APTES) for 20
minutes, respectively. Afterward, the microstructure
is rinsed with acetone, isopropanol and DI water,
and, sequentially, the PET substrate with patterned
ITO electrodes is rinsed with ethanol and DI water.
Finally, the microstructure and the PET substrate are
aligned and bonded under a contact pressure at
100 ℃ for 5 minutes, then at 50 ℃ for 24hrs.
Electrolyte, 1-ethyl-3-methylimidazolium
tricyanomethanide (EMIM TCM), is injected into
the microchannel via a reservoir using a syringe.
Two reservoirs are then sealed with PDMS with a
weight ratio of 1:10. Conductive epoxy is used to
make electrical connection between the contact pads
of the sensor and the associated electronics on PCBs.
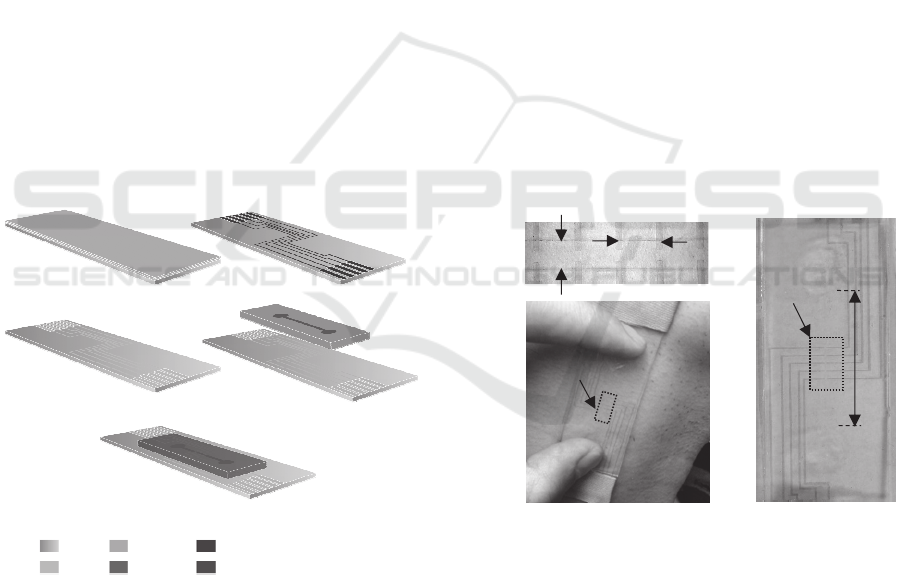
Figure 2 shows a couple of pictures of the fabricated
PET-based sensor.
Figure 2: Fabrication process for the PET-based sensor.
(a) Dry film lamination. (b) Patterning of dry film. (c)
Patterned ITO electrodes. (d) Alignment and bonding with
microstructure. (e) 3D view of the sensor.
3 ARTERIAL PULSE WAVEFORM
MEASUREMENT AND SIGNAL
PROCESSING
The measurements of arterial pulse waveform are
conducted on three subjects (a 16yr-old female
teenager, a 28yr-old female adult and a 28yr-old
male adult) in a quiet environment, after resting for
several minutes and no drinking and eating for over
1hr. All the pulse signals are taken from the carotid
artery at the right of the neck, except one is taken
from a radial artery. Additionally, two subjects are
required to do 5min-long strenuous exercise and
their carotid pulse signals are taken immediately
after exercise from the same location as at rest.
3.1 Pulse Waveform Measurement
As shown in Figure 3(c), the PET-based sensor is
placed at the site of the carotid artery and is pressed
against it with two fingers. Note that the hold-down
pressure against an artery is uncontrollable. The
arterial pulse exerts a time-varying deflection on the
top of the PDMS microstructure, which registers as a
resistance change by the transducer at the site of the
artery.
Figure 3: Pictures of the fabricated PET-based sensor. (a)
The transducer array with labelling. (b) The whole sensor.
(c) Demonstration of how the sensor is held for carotid
arterial pulse waveform measurement: two fingers holding
the sensor above the carotid artery.
To monitor resistance changes in the transducer
array, a function generator is used to apply an
Alternating Current (AC) signal (100kHz, peak-peak
amplitude: 220mv) as the input signal for all the
transducers (Cheng et al., 2013). The output of a
transducer is connected to its electronics
implemented on PCB for both amplifying the AC
signal coming out from the transducer and
(b)
(c)
(a)
1
2
3
4
5
d
e
=1.5mm
Transducer
Array
Transducer
Array
w
e
=1mm
L
e
=30mm
(a)
(b)
(c)
(d)
(e)
PET
Dry film
Patterned Dry film
PDMS
Mi
c
r
oc
h
a
nn
e
l
IT
O
BIODEVICES 2016 - 9th International Conference on Biomedical Electronics and Devices
68

converting the AC signal to a Direct Current (DC)
output, which is recorded by a LabVIEW program.
Note that the same design of electronics is used for
all the transducers, but is implemented on separate
PCBs. The circuit design can be found in our
previous work (Gu et al., 2013). Each pulse is
recorded for a 10s period. The sampling rate is kept
at 500Hz. Later on, 25 data points per second are
utilized for the extracted pulse waveform from an
originally recorded pulse signal.
3.2 Signal Processing for Converting
Resistance Changes to Pulse
Waveforms
As mentioned above, the recorded parameter of a
transducer is a DC voltage output, V
out
, which is
related to the resistance of a transducer by (Cheng et
al., 2013; Gu et al., 2013):
22
out
2
8
p
pF
vR
V
R
(1)
where v
pp
is the peak-to-peak value of the AC signal,
and R
F
is the feedback resistance of the electronics
used. Therefore, the resistance of a transducer can be
obtained by:
22
pp F
out
vR
R
V
(2)
The bottom deflection at a transducer is
represented by the resistance change:
0
11
-
22
pp F
out out
vR
R
VV
(3)
where V
out0
is the DC voltage of a transducer, when
it is free of deflection.
Owing to fabrication variation in transducer
height, h
e
, (the smallest design parameter), the
original resistance (defined as the resistance of a
transducer when it is free of deflection) may vary
among the transducers. The original resistance of the
i
th
transducer is roughly calculated as (Yang et al.,
2015):
0-
/2
e
i
eei
w
R
dh
(4)
where is the electrical conductivity of EMIM
TCM, d
e
, w
e
and h
e-i
are the length, width and height
of the i
th
transducer, respectively. We further define
the resistance of a transducer after being pressed
against an artery as its initial resistance, R
0-i
’
. As
such, the resistance change is calculated relative to
the initial resistance, instead of the original
resistance:
0
1
''
'2
0
'2
1- 1
/2
() /2
/2 ( )
ii
esi
eei ei
eie
s
isi
eei e
RRR
wz
dh h
wRd
zz
dh w
(5)
where z
s-i
is the deflection for the i
th
transducer, h
e-i
is the initial height of the transducer.
Since the hold-down pressure against an artery is
not controllable, the initial resistances of the sensor
vary among all the measurements. According to
Equation (5), the sensor deflection at the i
th
transducer can be obtained:
2
0
/2
()
e
si
e
i
w
R
z
d
R
(6)
3.3 Signal Processing for Baseline Drift
Removal
The respiration and motion artifact (i.e., motion of
the sensor and the body during measurement) can
introduce baseline drift to the recorded pulse
waveform. The Discrete Meyer Wavelet
Transformation (DMWT) and Cubic Spline
Estimation (CSE) have been implemented for
removing baseline drift from the recorded data (Xu
et al., 2007). DMWT is well known for representing
localized variations in a signal simultaneously in the
time and frequency domains. CSE is used to detect
the amplitude envelope of the signal.
Because the baseline drift introduced by
respiration and the body and sensor’s motion has
nonlinear and quasi-periodic contents, linear
interpolation estimation has been proven ineffective
(Xu et al., 2007). In contrast, a high-degree
polynomial is smooth, but it may cause the Runge
phenomenon, which increases the error of the signal
(Xu et al., 2007). Thus, CSE is widely used and is
adopted in this work to remove the baseline drift
when the Energy Ratio (ER) of the recorded data
reaches a threshold.
A Flexible PET-based Wearable Sensor for Arterial Pulse Waveform Measurement
69
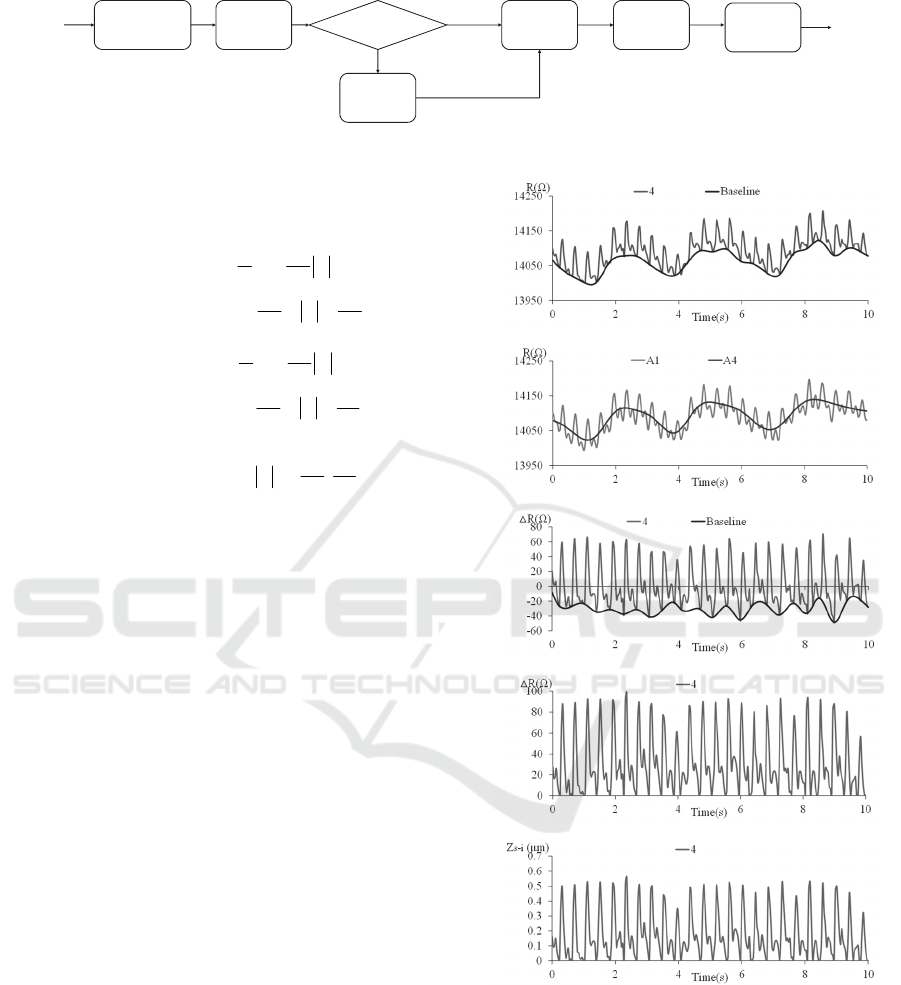
Figure 4: Flow chart of signal processing for pulse waveforms (Xu et al., 2007).
In DMWT, a function is defined in frequency
domain:
1/2 /2
1/ 2 / 2
3
(2 ) sin 1
22
24
,
33
3
(2 ) cos 1
24
(w)
48
,
33
0
jw
jw
evw
w
evw
w
28
, ,
33
w
(7)
where v(x) is an auxiliary function expressed as (Xu
et al., 2007):
423
() (35 84 70 20 ), [0,1]vx x x x x x
(8)
Figure 4 depicts the flow chart of signal
processing for removing the baseline drift from the
original pulse signal, while Figure 5 illustrates the
corresponding intermediate results of the signal
processing. First, we utilize CSE to obtain the
baseline envelope of the recorded resistance signal.
Figure 5(a) shows both the recorded resistance
signal, converted from the DC output voltage signal
using Equation (2), and the approximated baseline of
the signal via CSE as a function of time.
During the measurement post-exercise, there are
three to five respiration cycles for a 10s period. The
motion artifacts are the low frequency components.
The main frequency of baseline drift is less than 1Hz.
The cutoff frequency of the fourth-level scale
function is 1.56Hz. And the frequency content of the
pulse waveform is less than 40Hz. Thus, (A1−A4)
and A4 are used to approximate the pulse signal and
its baseline drift, respectively. Thus, we apply
DMWT to the resistance signal to obtain its first-
level approximation, A1, and its fourth-level
approximation, A4, as shown in Figure 5(b). The
two approximations are utilized to compute the ER
of the recorded pulse signal as below:
(a)
(b)
(c)
(d)
(e)
Figure 5: The corresponding intermediate results of the
signal processing using DMWT and CSE. (a) Resistance
with estimated baseline. (b) The first-level and fourth-
level approximation content of pulse decomposition. (c)
The resistance change with estimated baseline. (d) The
resistance change. (e) Sensor deflection at the 4
th
transducer.
Wav ele t
Decomposition
Point
Detection
Cubic
Spline
Estimation
Computing
the ER
Wavelet
Filter
ER > 10dB
R and
Deflection
∆
Original
Pulse
Signal
Filtered
Pulse
Signal
Y
N
BIODEVICES 2016 - 9th International Conference on Biomedical Electronics and Devices
70

10
14 (14)
20log
4(4)
AAmeanAA
ER
AmeanA
(9)
where || || represents the order-two norm, mean|| A1-
A4|| represents the average of A1-A4.
ER is used to quantify the extent of the baseline
drift. It is found that a pulse signal exhibits little
base drift when its ER is higher than 10dB.
Therefore, 10dB is selected as the ER threshold for
removing the baseline drift from the recorded
resistance signal. If ER is higher than 10 dB, the
baseline drift is removed by subtracting the
approximated baseline in Figure 5(a) from the
recorded resistance signal. If ER is lower than 10dB,
the baseline drift is removed by subtracting A4 in
Figure 5(b) from the recorded resistance signal.
Then, we obtain the resistance change of the
recorded resistance signal, as shown in Figure 5(c).
However, the pulse waveform still contains baseline
drift. CSE is used again to obtain the baseline drift
of the resistance change, as shown in Figure 5(c).
Afterward, the resistance change in Figure 5(c) is
subtracted by this new baseline drift to obtain the
resistance change in Figure 5(d). Finally, based on
Equation (6), the resistance change in Figure 5(d) is
converted to the sensor deflection, as shown in
Figure 5(e). The sensor deflection captures the pulse
waveform without being distorted by the baseline
drift. All the pulse signals measured on a subject at
rest have an ER value higher than 10dB, while the
pulse signals measured on a subject post-exercise
have an ER value lower than 10dB.
4 MEASURED RESULTS
Our goal for the sensor in this work is to aquire the
pulse waveform of a subject so as to evaluate some
physiological parameters related to the
cardiovascular system. Certainly, with an
oscillometric device (Digiglio et al., 2014), the
measured results can be further processed to obtain
the absolute values for blood pressure. To
demonstrate the feasiblity of the sensor for pulse
waveform measurement, carotid arterial pulse
waveforms are measured by the sensor on three
subjects at rest and on two subjects post-exercise.
Additionally, radial arterial waveforms are measured
on one subject at rest. Note that since we recently
started to explore the sensor for pulse waveform
measurement, the data collected here is not
comprehensive. Nevertheless, the measured pulse
waveforms are compared with the related
information in the literature for the feasibility of
using the sensor for pulse waveform monitoring.
4.1 Robustness to Motion Artifact
Motion artifact from the respiration and the
handshaking during measurement are unavoidable.
Sometimes, it is needed to assess arterial pulse
waveform difference between before-exercise and
post-exercise. As such, the sensor needs to be
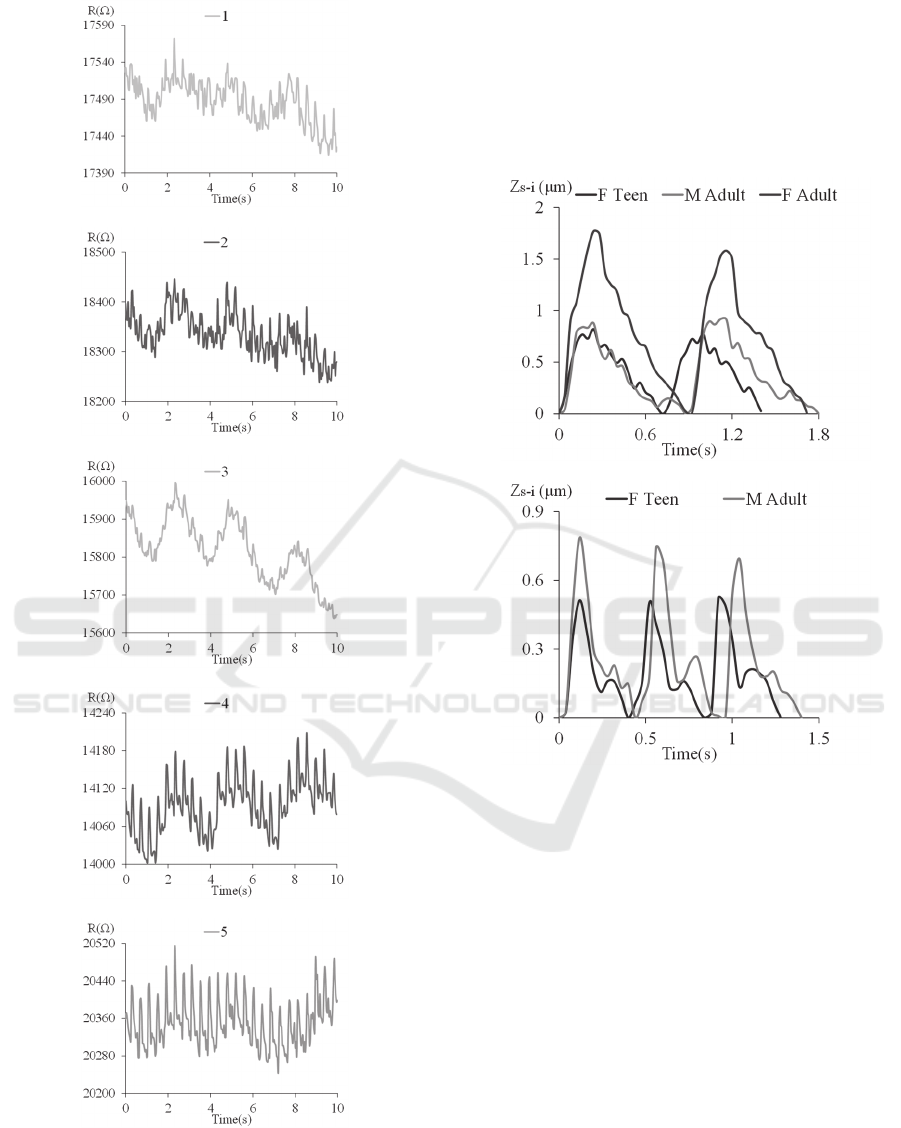
immune to motion artifact. Figure 6 shows the
measured resistances of the five transducers
measured on the 16-yr female post-exercise. The 4
th
and 5
th
transducers capture not only a clear patterned
pulse signal but also the heavily-breathing pattern,
indicating that the carotid artery is between the two
transducers. The breathing pattern introduces
extremely large baseline drift to the recorded pulse
signal. However, as will be seen in the next
subsection, the sensor is capable of obtaining the
undistorted pulse waveform under such severe
motion artifact.
The rest three transducers obtain random signals
with a respiration pattern, indicating that these
transducers are away from the carotid artery. Note
that this measurement indicates that the transducers
do not interfere with each other. Thus, the sensor
provides a negligible alignment margin for a
untrained individual to use.
4.2 Carotid Pulse Waveforms at-Rest
and Post-Exercise
The same sensor is used to conduct all the pulse
measurements on the carotid artery. Thus, variation
in pulse waveform among the three subjects arises
mostly from their cardiovascular system conditions,
in the sense that hold-down pressure may affect the
pulse waveform slightly, according to Equation (6).
Quantification of the effect of hold-down pressure
on the measured pulse waveform needs to be further
studied in the future. The measurement on the
carotid artery of each subject was repeated several
times. For each measurement, pulse signal typically
shows up in two or three transducers. For
consistence, we simply choose the pulse signal from
the 4
th
transducer for comparison. Thus, the sensor
deflection at this transducer is used to present a
measured pulse waveform.
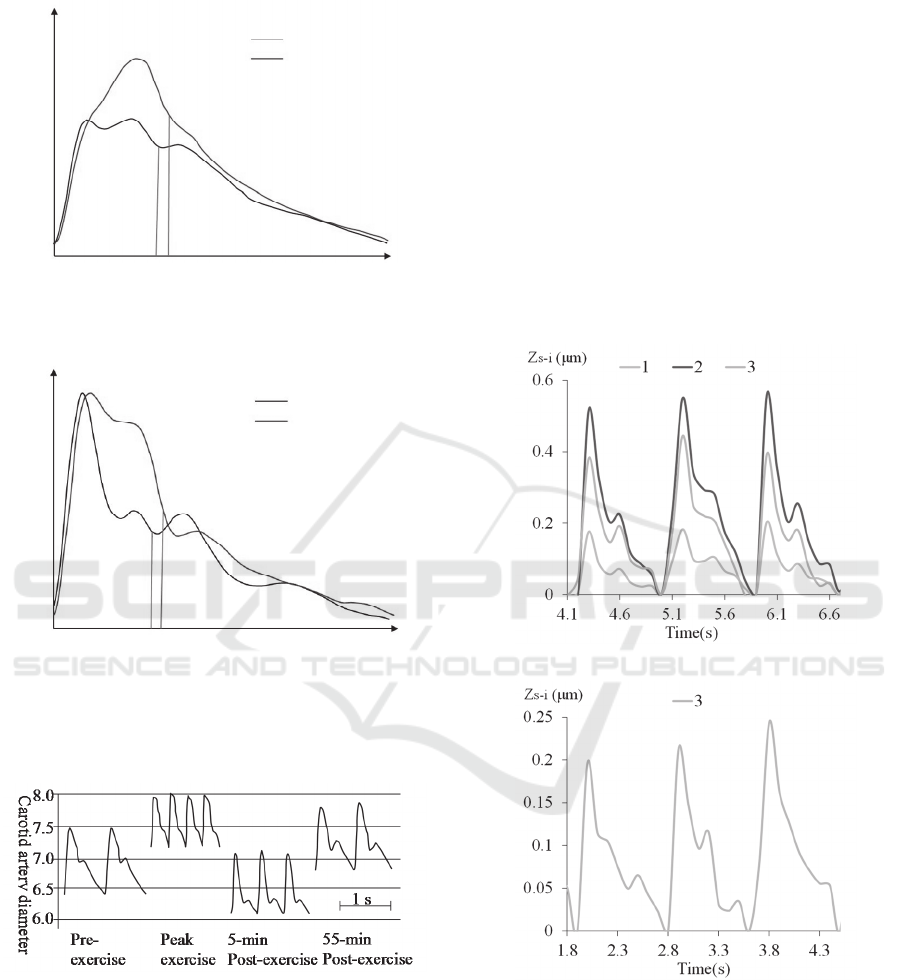
Figure 7(a) compares the pulse waveforms
measured on the three subjects at rest and Figure 7(b)
compares the pulse waveforms measured on onsets
of the first pulses of the subjects are set at the same
A Flexible PET-based Wearable Sensor for Arterial Pulse Waveform Measurement
71
(a)
(b)
(c)
(d)
(e)
Figure 6: Arterial waveform patterns of five transducers
from the 16yr-old female teenager post-exercise. (a)-(e)
are recorded resistance of each transducer.
time instant. While the hold-down pressure against a
carotid artery is larger at-rest than post-exercise, the
sensor deflection is larger at rest than post-exercise,
as can be seen in Figure 7. This indicates that a
strong pulse from post-exercise does not directly
translate to a large sensor deflection, without a large
hold-down pressure.
(a)
(b)
Figure 7: Carotid pulse waveform in terms of the sensor
deflection at the 4
th
transducer at-rest (a) and post-exercise
(b).
Figure 8(a) shows the aorta pressure waveform
in the comparison between two adults: a 68-year old
individual and his 37-year-old son (O'Rourke and
Hashimoto, 2007). The pulse pattern varies with
ages. Since carotid artery is central and thus is
representative of aorta pressure. Evidently, the pulse
waveforms of the 28yr-old male and 16yr-old female
(both physically active) at rest exhibit a quite
vertical up-stroke and are similar to the one of the
young man. In constrast, containing an inclined up-
stroke, the pulse waveform of the 28yr-old female
(not physically active) at rest is closer to the one of
the old man.
The 28yr-old female has the lowest pulse rate but
the highest pulse strength. This high pulse strength
might be due to the artery being close to the skin.
BIODEVICES 2016 - 9th International Conference on Biomedical Electronics and Devices
72
(a)
(b)
Figure 8: Aortic (a) and radial (b) pressure wave in 36-
year-old man (young) and his 68-year-old father (old)
(O'Rourke and Hashimoto, 2007).
Figure 9: Carotid artery distension wave and blood
pressure recordings before, during and after dynamic
exercise. Carotid artery distension wave recordings and
corresponding blood pressure values in one representative
subject during the control period, at peak-exercise, and at
5 and 55 min post-exercise. Time scale = 1s. (Studinger et
al., 2003, with permission).
The 16yr-old female has a faster pulse rate than the
28yr-old male both at rest and post-exercise. The
dicrotic notch in the pulse waveforms of the two
subjects post-exercise is much lower than its
counterpart at rest. Figure 9 shows a similar
difference in pulse waveform between at rest
(control) and post-exercise. Thus, our measurement
(Figure 7) is consistent with that in the literature.
4.3 Radial Arterial Pulse Waveforms
Another PET-based sensor is used to measure the
radial pulse of the 28yr-old female, with the sensor
being aligned in parallel with and perpendicular to
the radial artery. Figure 10 illustrates the measured
pulse waveforms under the two alignments. In the
parallel alignment, three transducers, 1, 2 and 3, are
at the site of the artery, while only transducer 3 is at
the site of the artery in the perpendicular alignment.
(a)
(b)
Figure 10: The radial artery pulse measurement for 28yr-
old female adult. (a) The sensor aligned parallel with the
radial artery. (b) The sensor aligned perpendicular to the
radial artery.
The pulse waveform varies between the two
alignments, which is believed to result from the
sensor being more loosely in contact with the artery
in the perpendicular alignment than in the parallel
Young
Old
130
60
0
Time
(
s
)
1
Radial
mmHg
Young
Time
(
s
)
Old
AORTA
130
mmHg
60
0
1
A Flexible PET-based Wearable Sensor for Arterial Pulse Waveform Measurement
73

alignment. Thus, the pulse waveform in Figure 10(a)
is believed to be correct and is compared with the
one in Figure 8(b), showing a little bit away from the
one of the young man.
4.4 Arterial Tonometric Parameters
Figure 11 illustrates a typical cycle of a measured
pulse signal, which includes main arterial tonometric
parameters often used to characterize the waveform
(Velik, 2015). The physical meaning of the
tonometric parameters in the figure is given in Table
2.
Figure 11: Parameters of pulse wave signal (Velik, 2015).
According to Figure 11, the arterial tonometric
parameters of the subjects are calculated and
summarized into Table 2. The ratio of h1/h5 is
calculated, instead of the absolute values of h1 and
h5, due to the lack of a device for calibration. The
radial pulse measurement under the parallel
alignment is included in the table. As mentioned
previously, the ratio of h1/h5 post-exercise is higher
than at rest, which is observed on the 16yr-old
female and the 28yr-old male. It has been found that
as the pulse transmits from central (carotid) to
peripheral (radial), the ratio of h1/h5 goes up
(McEniery et al., 2014) and the up-stroke time (t1)
becomes shorter (Hurst, 1982). The measured results
on the 28yr-old female are in good agreement with
these findings. Note that two different sensors of the
same design are used to measure the carotid and
radial arterial pulse waveforms of the 28yr-old
female. The consistency of the results on the carotid
artery and the radial artery (the ratio of h1/h5 going
up and the up-stroke time being shorter from carotid
to radial) simply prove the robustness of the sensor.
We envision that this flexible sensor can be
attached on a bracelet and can then be worn on the
wrist loosely, together with integrated circuit for
signal routing and wireless transmission. Whenever
an individual needs to measure the radial pulse
waveform, he can align the sensor at the site of the
artery and press the sensor against the artery with his
fingers. To measure the carotid artery, the bracelet
can be taken off the wrist and put the sensor on the
neck. Owing to the small size and flexibility of the
sensor, it is expected to be comfortable to wear a
bracelet with the sensor.
Table 2: Measured arterial tonometric characteristics from the subjects.
Variables Description
Carotid artery
Radial
artery
Female Teenager Male Adult Female Adult
Female
Adult
(parallel)
At-rest
Post-
exercise
At-rest
Post-
exercise
At-rest At-rest
h1/h5
Amplitude of main peak /
Amplitude of dicrotic wave
1.551 3.202 1.415 3.251 1.876 2.296
t1(s)
Duration between onset and
peak point
0.24 0.12 0.24 0.12 0.24 0.1
t2(s)
Duration between onset and
incisura
0.4 0.24 0.32 0.28 0.36 0.3
t3(s)
Duration between onset and
dicrotic
0.32 0.16 0.56 0.16 0.52 0.5
T(s) Time in one pulse cycle 0.72 0.4 0.88 0.44 0.88 0.8
Amplitude
As
Ad
h1
W
h2
h3
h4
h5
h7
h6
t1
t3
t2
T
Time
BIODEVICES 2016 - 9th International Conference on Biomedical Electronics and Devices
74

5 CONCLUSION
This paper presents a PET-based wearable sensor for
arterial pulse waveform measurement for untrained
individuals to conduct the arterial pulse waveform
measurement. The sensor contains a PDMS
microstructure embedded with a 51 resistive
transducer array, spanning 6mm and with a spatial
resolution of 1.5mm. Built on PET substrate, the
sensor is fabricated using a low-cost, two-mask
fabrication process. To demonstrate its feasibility for
arterial pulse waveform measurement, one sensor is
used to measure carotid arterial pulse waveform of
three subjects at rest and two subjects post-exercise,
while another sensor of the same design is used to
measure radial arterial pulse waveform of one
subject at rest. The respiration and motion artifact
introduces baseline drift to originally recorded pulse
signal. A combination of DMWT and CSE is
utilized to effectively remove the baseline drift in a
pulse signal. The robustness of the sensor to baseline
drift is demonstrated by the pulse signals measured
on a subject post-exercise. After its baseline drift
being removed, an arterial pulse waveform is
expressed in terms of the sensor deflection as a
function of time. All the measured pulse waveforms
of carotid and radial arteries of the three subjects at
rest and post-exercise are consistent with their
counterparts in the literature, thus demonstrating the
feasibility of using the sensor as a wearable health
monitoring device.
REFERENCES
Cheng, P., Gu, W., Shen, J., Ghosh, A., Beskok, A. and
Hao, Z., 2013. Performance study of a PDMS-based
microfluidic device for the detection of continuous
distributed static and dynamic loads. Journal of
Micromechanics and Microengineering, 23(8), p.
085007.
Digiglio, P., Li, R., Wang, W. and Pan, T., 2014.
Microflotronic arterial tonometry for continuous
wearable non-invasive hemodynamic monitoring.
Annals of biomedical engineering, 42(11), pp.2278-
2288.
Gu, W., Cheng, P., Ghosh, A., Liao, Y., Liao, B., Beskok,
A. and Hao, Z., 2013. Detection of distributed static
and dynamic loads with electrolyte-enabled distributed
transducers in a polymer-based microfluidic device.
Journal of Micromechanics and Microengineering,
23(3), p.035015.
Hu, C. S., Chung, Y. F., Yeh, C. C., and Luo, C. H., 2011.
Temporal and spatial properties of arterial pulsation
measurement using pressure sensor array. Evidence-
Based Complementary and Alternative Medicine, 2012.
Hurst, J. W. and Logue, R. B., 1982. The heart: arteries
and veins, McGraw -Hill, pp.170-179.
Lin, W. H., Zhang, H. and Zhang, Y. T., 2013.
Investigation on cardiovascular risk prediction using
physiological parameters. Computational and
mathematical methods in medicine, 2013.
McEniery, C. M., Cockcroft, J. R., Roman, M. J.,
Franklin, S. S. and Wilkinson, I. B., 2014. Central
blood pressure: current evidence and clinical
importance. European heart journal, 35(26), pp.1719-
1725.
O'Rourke, M. F. and Hashimoto, J., 2007. Mechanical
factors in arterial aging: a clinical perspective. Journal
of the American College of Cardiology, 50(1), pp.1-13.
Saugel, B., Fassio, F., Hapfelmeier, A., Meidert, A. S.,
Schmid, R. M., and Huber, W., 2012. The T-Line TL-
200 system for continuous non-invasive blood pressure
measurement in medical intensive care unit patients.
Intensive care medicine. 38(9), pp.1471-1477.
Studinger, P., Lenard, Z., Kovats, Z., Kocsis, L. and
Kollai, M., 2003. Static and dynamic changes in
carotid artery diameter in humans during and after
strenuous exercise. The Journal of physiology, 550(2),
pp.575-583.
Tang, L. and Lee, N. Y., 2010. A facile route for
irreversible bonding of plastic-PDMS hybrid
microdevices at room temperature. Lab on a Chip,
10(10), pp.1274-1280.
Tsuwaki, M., Kasahara, T., Edura, T., Matsunami, S.,
Oshima, J., Shoji, S., Adachi, C. and Mizuno, J., 2014.
Fabrication and characterization of large-area flexible
microfluidic organic light-emitting diode with liquid
organic semiconductor. Sensors and Actuators A:
Physical, 216, pp.231-236.
Velik, R., 2015. An objective review of the technological
developments for radial pulse diagnosis in Traditional
Chinese Medicine. European Journal of Integrative
Medicine, 7(4), pp.321-331.
Xu, L., Zhang, D., Wang, K., Li, N. and Wang, X., 2007.
Baseline wander correction in pulse waveforms using
wavelet-based cascaded adaptive filter. Computers in
Biology and Medicine, 37(5), pp. 716-731.
Yang, Y., Shen, J. and Hao, Z., 2015. A two-demensional
(2D) distributed deflection sensor for tissue palpation
with correction mechanism for its performance
variation. under review.
A Flexible PET-based Wearable Sensor for Arterial Pulse Waveform Measurement
75
