
Interactive Revision Exploration using Small Multiples of Software Maps
Willy Scheibel, Matthias Trapp and J
¨
urgen D
¨
ollner
Hasso Plattner Institute, University of Potsdam, Prof.-Dr.-Helmert-Str. 2-3, Potsdam, Germany
Keywords:
Software Visualization, Visual Analytics, Software Maps, Small Multiples, Interactive Visualization Tech-
niques.
Abstract:
To explore and to compare different revisions of complex software systems is a challenging task as it requires
to constantly switch between different revisions and the corresponding information visualization. This paper
proposes to combine the concept of small multiples and focus+context techniques for software maps to facil-
itate the comparison of multiple software map themes and revisions simultaneously on a single screen. This
approach reduces the amount of switches and helps to preserve the mental map of the user. Given a software
project the small multiples are based on a common dataset but are specialized by specific revisions and themes.
The small multiples are arranged in a matrix where rows and columns represents different themes and revi-
sions, respectively. To ensure scalability of the visualization technique we also discuss two rendering pipelines
to ensure interactive frame-rates. The capabilities of the proposed visualization technique are demonstrated in
a collaborative exploration setting using a high-resolution, multi-touch display.
1 INTRODUCTION
In software analytics, gathered data of a software sys-
tem is often temporal, hierarchical, and multi-variate,
e.g., software modules associated with per-module
metrics data (Telea et al., 2010; Khan et al., 2012).
We consider common tasks of the various stakehold-
ers of the software development process. For software
consultants, manual exploration of a software system
revision in combination with a specific metric map-
ping represents a frequent use case (Charters et al.,
2002). During this exploration process, revision and
metric mappings are often changed to compare sys-
tem states at different revisions (Voinea and Telea,
2006). This process is time-consuming, error-prone,
and does not facilitate the creation and preservation of
a mental map (Archambault et al., 2011).
One specific technique to visualize and analyze
software system information, especially for planning
and monitoring software development and communi-
cating insights into its characteristics, properties, and
risks, is the software map (Bohnet and D
¨
ollner, 2011;
Tr
¨
umper and D
¨
ollner, 2012). The hierarchical com-
ponents of a software system are depicted using a tree
map (Shneiderman, 1992) and different associated
metrics can be mapped onto several visual variables,
e.g., ground area, height, color, and texture of cuboids
that result when extruding the rectangles of the layout.
Figure 1: The POCO software project development de-
picted using a small multiples visualization of software
maps showing 6 revisions (columns) and 5 different soft-
ware maps themes (rows). The size of a cuboid depends on
the implementation size. The color mapping indicates in-
conspicuous (blue) and suspicious modules (red) according
to the current theme (further explanations in section 3).
Thus, the software map is a 2.5 dimensional visualiza-
tion technique (Bladh et al., 2004). Combinations of
specific metrics and their mapping onto visual vari-
ables are organized by software map themes to sup-
port specific issues and information needs that are re-
quired by different stakeholders. The use of cuboids
and placing margins between tree map nodes lead to
the impression of a virtual 3d city composed of build-
ings and streets (Panas et al., 2003).
One approach to overcome the problem of com-
paring software maps of different revisions and
Scheibel, W., Trapp, M. and Döllner, J.
Interactive Revision Exploration using Small Multiples of Software Maps.
DOI: 10.5220/0005694401310138
In Proceedings of the 11th Joint Conference on Computer Vision, Imaging and Computer Graphics Theory and Applications (VISIGRAPP 2016) - Volume 2: IVAPP, pages 133-140
ISBN: 978-989-758-175-5
Copyright
c
2016 by SCITEPRESS – Science and Technology Publications, Lda. All rights reserved
133

themes consists of applying small multiples (Wong
and Bergeron, 1994), a visualization concept based on
using a basic reference geometry to display different
aspects of a dataset (Tufte, 1990). Small multiples en-
able the depiction of multi-dimensional datasets with-
out yielding visual clutter, over-plotting, or visually
complex depiction introduced by the display of mul-
tiple variables simultaneously (Roberts, 2007). This
facilitates to compare across different variables and
communicate the range of potential patterns in the
charts, i.e., a reader can learn to read an individual
chart and apply this knowledge as they scan the re-
mainder of the charts (Javed et al., 2010). Thus, it
shifts the readers effort from understanding how the
chart works to what the data says. A regular layout
of small multiples allows for both, comparison be-
tween units and an understanding of the respective
categories (MacEachren et al., 2003).
Problem Statement. The approach to use small
multiples has a strong limiting factor in the available
screen size, especially for the past years. Addition-
ally, rendering systems have to handle the additional
effort required for rendering each small multiple in
the case of massive datasets. Today, the application
of display walls as well as the increased screen res-
olution and display sizes overcome the issue of the
available screen size (Yost and North, 2006). For ex-
ample, modern displays offer resolutions up to 4K
(3840 × 2160 pixels) and even higher resolutions,
providing screen space for over 30 multiples, each at a
resolution of 640 × 432 pixels. Using a display wall,
this number increases further. Insofar the rendering
represents the key limitation that has to be capable of
handling massive amounts of data for small multiples.
Contributions. This paper contributes a combined
visualization technique of small multiples and inter-
active software maps, arranged in a matrix and ex-
tended by interaction techniques to support the explo-
ration and analysis of multiple software system revi-
sions using multiple themes (Figure 1). The proposed
rendering can be implemented using either a multi-
pass or a single-pass approach. Our technique has
been used on a high-resolution screen for collabora-
tive exploration (Isenberg and Carpendale, 2007).
2 RELATED WORK
Previous research includes visualization of software
and its evolution, general hierarchy visualization and
changes upon them, and small multiples used in in
visualization.
Visualization of Hierarchies and Their Evolu-
tion. As software maps should help with monitoring
changes over several revisions of a software system,
the mental map of the user should be preserved. This
can be achieved with tree map layouting algorithms
having a spatial stability for the location of tree map
nodes. Typically, this is a trade-off between spatial
stability and readability of tree map nodes (Tak and
Cockburn, 2013). When choosing a tree map lay-
out algorithm for one state of a hierarchy, the spa-
tial stability for the next state can be optimized by re-
applying the template of the first one (Kokash et al.,
2014). Besides rectangular tree maps, the voronoi
tree map provides an inherently more stable layout
algorithm, especially when using an initial distribu-
tion of nodes (Hahn et al., 2014). The gosper map
provides a more map-like look and a high spatial sta-
bility for changing hierarchical data (Auber et al.,
2013). An effective use of multiple visualization tech-
niques to examine changes in hierarchies is presented
by Guerra-Gom
´
ez et. al. (Guerra-Gomez et al., 2013).
Visualization of Software and Its Evolution.
When visualizing the changes of a software system
over time, i.e., its evolution, graph-based approaches
were made first (Collberg et al., 2003). Kuhn et. al.
propose a multidimensional scaling approach to map
multidimensional vectors, representing source code
files, to a two-dimensional layout (Kuhn et al., 2008).
The resulting software maps (not to be confused with
the software maps from Bohnet et. al.) are spatially
stable due to the typical similarity of source code be-
tween two revisions. Two other visualization tech-
niques using the city metaphor are software cities
(Steinbr
¨
uckner and Lewerentz, 2010) and CodeCity
(Wettel et al., 2011). Where the former concentrates
on streets and buildings on their sides, the latter is
more similar to the software maps used in this pa-
per. A matrix-based approach supported by animated
transitions named AniMatrix supports in understand-
ing the evolution of source code entities and their de-
pendencies (Rufiange and Melanc¸on, 2014). Caserta
et. al. published a survey with an overview on vi-
sualizing the static aspects of software, including vi-
sualization techniques for software system evolution
(Caserta and Zendra, 2011).
Small Multiples. Small multiples is a visualization
technique widely used to enable multi-dimensional
and multi-variate data for the use in visual analytics.
For example, it can be used to visualize thematic map-
pings of geo-referenced data, even with a temporal
component (MacEachren et al., 2003; Bavoil et al.,
2005). Small multiples of virtual three-dimensional
IVAPP 2016 - International Conference on Information Visualization Theory and Applications
134

scenes are used to compare wing beat patterns (Chen
et al., 2007). The comparison of structured data in two
dimensions was examined by Bremm et. al. (Bremm
et al., 2011) using trees and by Burch and Weiskopf
using graphs (Burch and Weiskopf, 2014). More gen-
erally, small multiples can be used as an alternative
to otherwise intertwined visualization of data (Perin
et al., 2012) and even different visualization tech-
niques for the same data (van den Elzen and van Wijk,
2013). The layout of the small multiples can be de-
rived from the use case (Kehrer et al., 2013), the user
(Phan et al., 2007), or the data (Liu et al., 2013).
Software Visualization using Small Multiples.
There exist software visualization techniques that use
small multiples to depict changes between software
revisions. For example, Lanza and Ducasse propose
rectangles for each software entity and software revi-
sion with two degrees of freedom (width and height
of the rectangle) that are laid out using the time
component as the x-axis (Lanza and Ducasse, 2002).
CodeCity uses a similar approach but maps the iden-
tity of software sub-entities to explore the system’s
implementation (Wettel and Lanza, 2008). Even a
display wall is used for different visualization tech-
niques of a software system (Anslow et al., 2009).
3 CONCEPT
The software map serves as a visualization technique
that allows us to explore software system information
and to communicate key insights about its status and
progress. A software map is configured by parame-
ters that specify the current project, a revision, and a
theme, i.e., the mapping of metrics onto visual vari-
ables. Although parameterizable, the software map is
currently limited to only one denotable revision and
one theme. To compare several revisions of software
maps, the user has to switch between them. Fur-
ther, only one theme can be shown at once. Context
switches and loss of the mental map are inevitable.
Current Approach. While exploring the software
system, multiple instances of the software map visu-
alization can be used simultaneously at the cost of a
separated interaction context and rendering. To com-
municate the insights, a list of software revisions and
themes is chosen and an image for each combination
is generated and placed next to each other, creating
a static version of small multiples of software maps.
The proposed visualization technique combines the
two unsupported usages of software maps – switching
between software system revisions and the compari-
son of multiple themes – by the use of small multiples
of software maps.
Example. Given software system information of
the POCO project (http://pocoproject.org/) an
analysis can focus on the development from Septem-
ber 2006 to March 2009 (Figure 1). The development
activity is sampled two times a year, resulting in six
displayed revisions. The weight of the tree map nodes
is dependent on the real lines of code and the nest-
ing level is mapped into the height for all themes to
correlate implementation size with cuboid size. The
following choice of themes, consisting of changes in
color for this example, allows for specific insights into
the development process and state of implementation:
• McCabe complexity per function, indicating mod-
ules with much logic,
• nesting level per function, indicating modules re-
quiring high understanding effort,
• use of C++ templates, indicating modules with
complex implementation,
• uncommented lines of code, indicating modules
requiring high understanding effort,
• number of hacks, indicating modules with unfin-
ished code.
3.1 Small Multiples Configuration
To enable small multiple visualizations for software
maps, each software map has to be configured sep-
arately for each small multiple. Given a matrix ar-
rangement, the configuration varies in horizontal and
vertical dimension. One dimension is used to de-
pict different revisions of a given software system, the
other dimension is used for different themes. The pa-
rameters that are common for all software maps are
grouped and denoted as base configuration.
Base Configuration. This configuration is shared
among all software maps and includes parameters that
are not influenced by the revision or theme. For ex-
ample, these include the software project, the layout
algorithm and margin, and the maximum height for
nodes. Two approaches can be used for the camera
position and perspective. The first uses the position
and view of the users eyes to adjust each small mul-
tiples on an adapted view frustum. The second and
chosen approach uses the same camera and projection
for all software maps. This base configuration results
in a general similarity of all software maps; especially
for a common revision.
Interactive Revision Exploration using Small Multiples of Software Maps
135
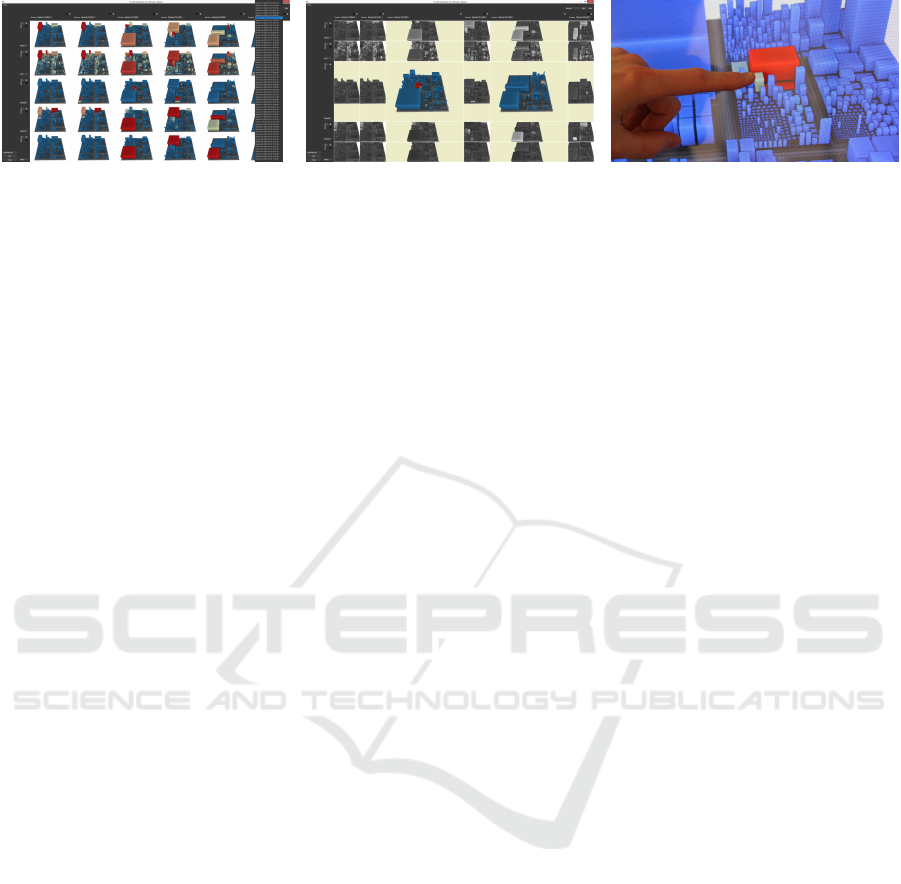
(a) A configuration user interface to se-
lect the revision and theme.
(b) Focus+context visualization to com-
pare two specific software maps.
(c) A close-up of a problematic soft-
ware module identified through direct
comparison.
Figure 2: The graphical user interface of the small multiples visualization of software maps. The small multiples are arranged
as a matrix where rows represent different themes and columns different revisions.
Per Small Multiple Configuration. For the chosen
use case, the per small multiple configuration includes
the revision and the theme. The theme can specify the
weight metric for the tree map layout, the metric for
the height mapping, the metric for the color scheme,
the color scheme itself, and the side face texturing
scheme. Further, the configuration includes the screen
sub-rectangle where this small multiple is placed. The
sub-rectangles of all small multiples do not have to be
disjunct and do not have to form the full screen rect-
angle when unified, but they are chosen to fulfill these
requirements.
3.2 Rendering
The rendering of all software maps (laid out in a grid)
uses the geometry of each software map, the associ-
ated sub-rectangle and the common camera perspec-
tive and projection to render the software map on the
screen. If small multiples may overlap, this rendering
has to take a separate canvas for each small multiple
to explicitly handle overlapping areas later.
3.3 Interaction Techniques
Besides the computation and rendering of all soft-
ware maps, the visualization technique has to be con-
figurable by a user. This includes the software map
configuration for each small multiple and the virtual
scene navigation as well as managing the focus on one
or multiple software maps.
Small Multiple Configuration. The configuration
of the software map is proposed to be available over a
graphical user interface that is placed on the left and
upper side of the canvas where the small multiples are
aligned using a matrix of multiple rows and columns
(Figure 2(a)). For the given use case, the revision can
be configured on the horizontal axis and the theme
on the vertical axis. To support fine-grained config-
uration on a per-row and per-column base, the user
interface shows one configuration template for each
column and each row. This part of the configuration
is applied for a complete column or row, respective,
resulting in a matrix where each small multiple has a
different configuration.
Navigation (Pan, Rotate, Zoom). To support nav-
igation in the matrix of software maps, interaction
functionality for panning, rotating, and zooming is in-
tegrated. This navigation is synchronized for all soft-
ware maps to show the same part of the virtual scenes.
Focus+Context. The matrix layout supports a flex-
ible mapping, i.e., software maps in focus gets more
space than software maps in the context. By de-
fault, all matrix cells are equally sized. Through the
graphical user interface, the user can select one or
more rows and columns to be in focus, resulting in
a higher portion of the overall space in comparison to
the unfocused rows and columns. If either columns or
rows are selected, the small multiples in these rows or
columns gets enlarged. If both columns and rows are
selected, the intersecting small multiples of the rows
and colums are enlarged. The enlarged small mul-
tiples then represent the focus, the smaller ones the
context (Hauser, 2006) (Figure 2(b)).
4 IMPLEMENTATION
We have implemented our concept in a software pro-
totype that supports loading of software system revi-
sion data, provides a graphical user interface for the
interactive configuration of software maps, processes
the configuration, and computes and renders the ma-
trix software maps. Navigation techniques comple-
ment the interaction within the prototype. The soft-
ware map geometry encoding and the implementa-
tion of the hardware-accelerated rendering are the key
techniques for the proposed concept. The prototype is
IVAPP 2016 - International Conference on Information Visualization Theory and Applications
136
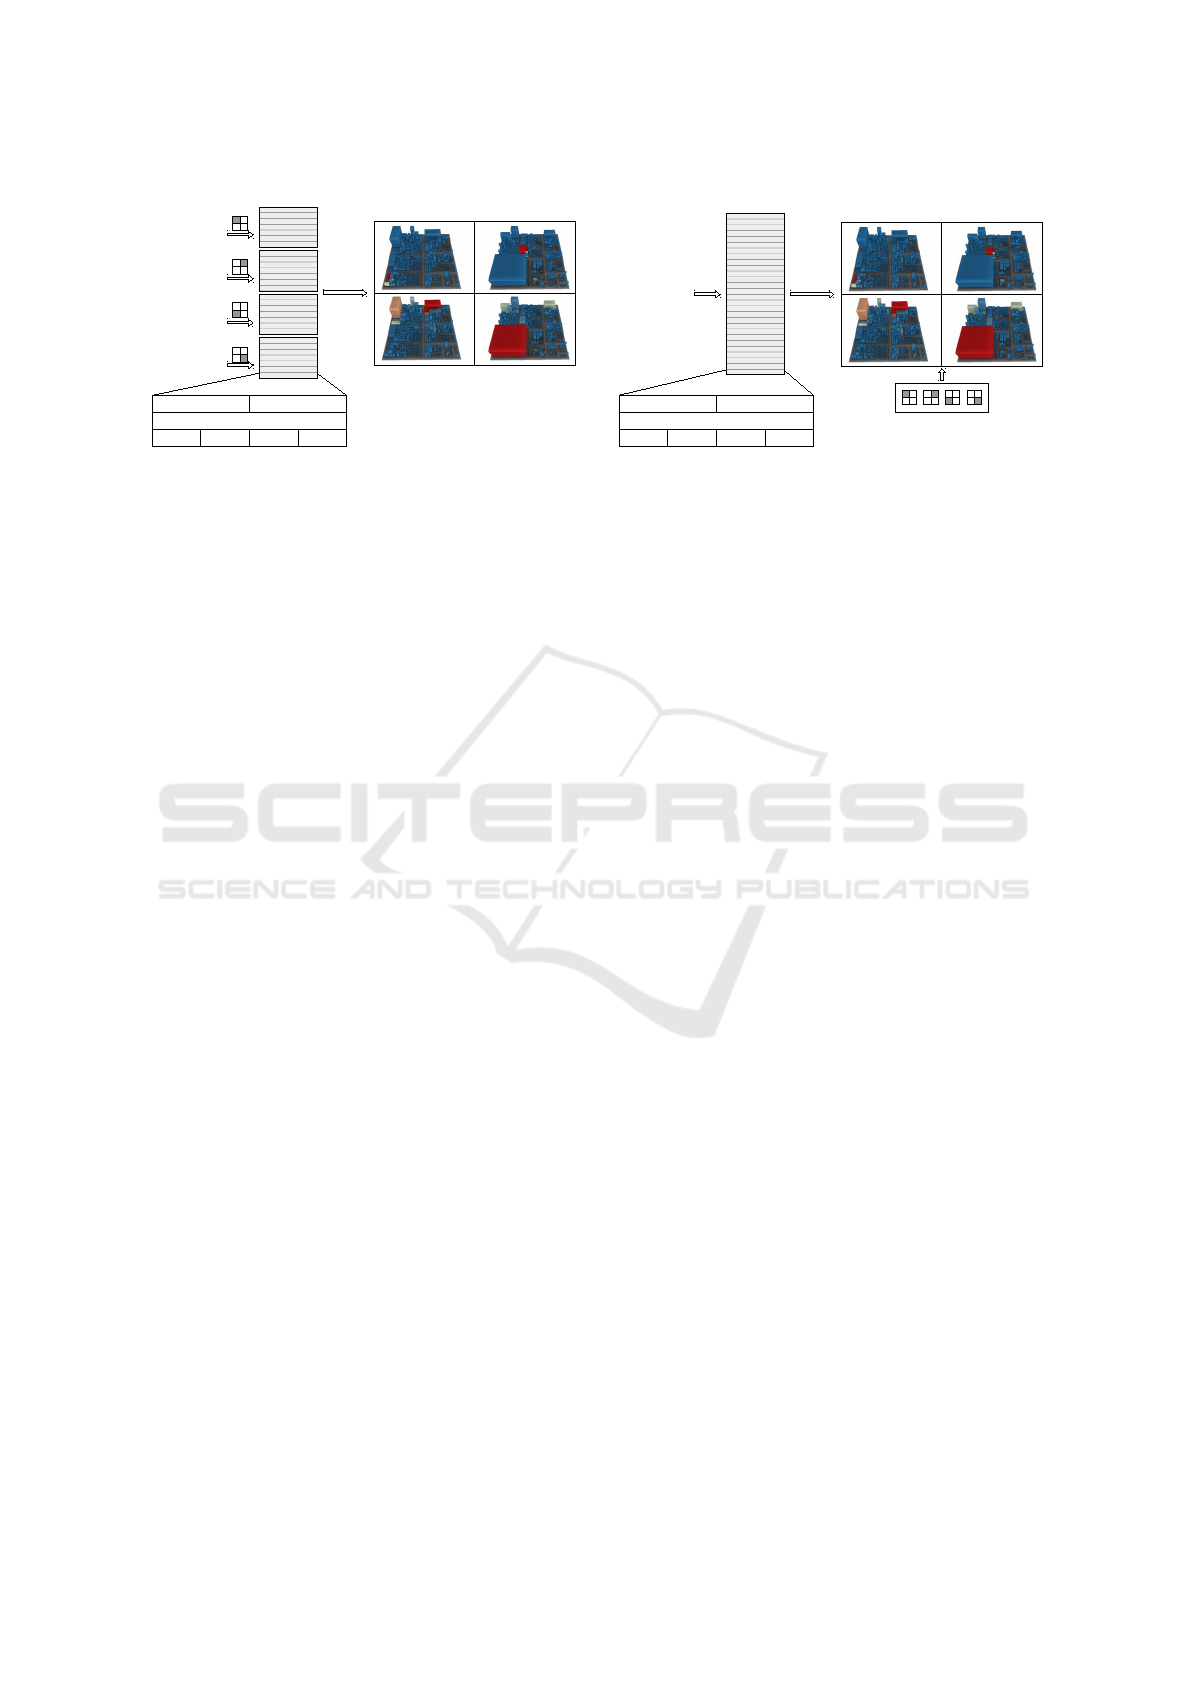
position
id
color
bottom height -
extent
Draw Call
Draw Call
Draw Call
Draw Call
Attributed Point Clouds Framebuer
(a) The multi-pass rendering pipeline uses per-pass view-
port manipulation and vertex buffer offsets. There is one
draw call per software map and a previous restriction of the
rasterization viewport to the viewport of the small multiple.
All vertices of all software maps are stored using a single
vertex buffer, that is traversed using vertex buffer offsets.
position
id
color
bottom height
vpi
*
extent
*
viewport index
Draw Call
Attributed Point Clouds
Framebuer
Viewports
(b) The single-pass rendering pipeline uses virtual view-
ports and screen-space vertex displacement. All vertices
from all software maps are input to the rasterization pipeline
using a single draw call. Prior to rasterization, the virtual
viewport is fetched and the projected vertices (in normalized
device coordinates) are applied to it.
Figure 3: Two proposed rendering pipelines for small multiples of software maps. The multi-pass rendering pipeline (a)
denotes the traditional approach and is straight-forward to implement. The single-pass rendering pipeline (b) reduces state
changes and uses virtual viewports and screen-space vertex displacement to handle all vertices in a single draw call.
implemented using C++ and Qt for the executable ap-
plication and OpenGL for the hardware-accelerated
rendering.
Software Map Encoding. The geometry for the
hardware-accelerated rendering of the software maps
is stored on the graphics hardware for efficiency. This
is feasible as the data does not change often. The
encoding of the geometry uses the concept of an at-
tributed point cloud (Trapp et al., 2013) using 48
bytes per vertex that is extruded to a cuboid during
the OpenGL geometry shader stage. The concept of
attributed point clouds is adapted to small multiples
insofar that each software map conceptually builds its
own attributed point cloud but all of them are stored
adjacently within a single vertex buffer.
Small Multiples Rendering. The image synthesis
can be performed using either a multi-pass or single-
pass rendering technique. Here, the multi-pass ren-
dering approach constitutes a traditional implemen-
tation, while the single-pass approach makes ex-
tended use of the programmable rendering pipeline of
OpenGL.
Multi-pass Rendering. The multi-pass rendering
pipeline operates on the list of attributed vertex
clouds and the list of viewports. For each pair, the
viewport of the small multiple is configured and
a draw call for all vertices of the attributed vertex
cloud is triggered (Figure 3(a)).
Single-pass Rendering. The single-pass rendering
pipeline uses the list of viewports during the
hardware-accelerated vertex processing, thus it is
available to the shaders using uniform buffers.
The rendering pipeline is triggered using one
single draw call covering all vertices from all
attributed vertex clouds. For each vertex the
corresponding virtual viewport is extracted from
the uniform buffer using programmable vertex
pulling (Riccio and Lilley, 2013). This view-
port is then used to apply screen-space vertex dis-
placement after the amplification in the geome-
try shader, transforming each vertex of the cuboid
into the virtual viewport (Trapp and D
¨
ollner,
2010). After rasterization, all fragments outside
the virtual viewport are discarded (Figure 3(b)).
5 EVALUATION
The application of small multiples of software maps
is depicted using the scenario of a software consultant
who shows a client findings in a software system. A
performance analysis and a discussion indicates the
properties and limitations of the proposed technique.
5.1 Collaborative Displays
The visualization of a software system using small
multiples of software maps is suited to support a soft-
ware consultant in communicating the findings and
insights into the development to the client. The con-
sultant can start with one revision and introduce the
status to the client. Later, other themes and revi-
sions can be added to guide the client through the
Interactive Revision Exploration using Small Multiples of Software Maps
137
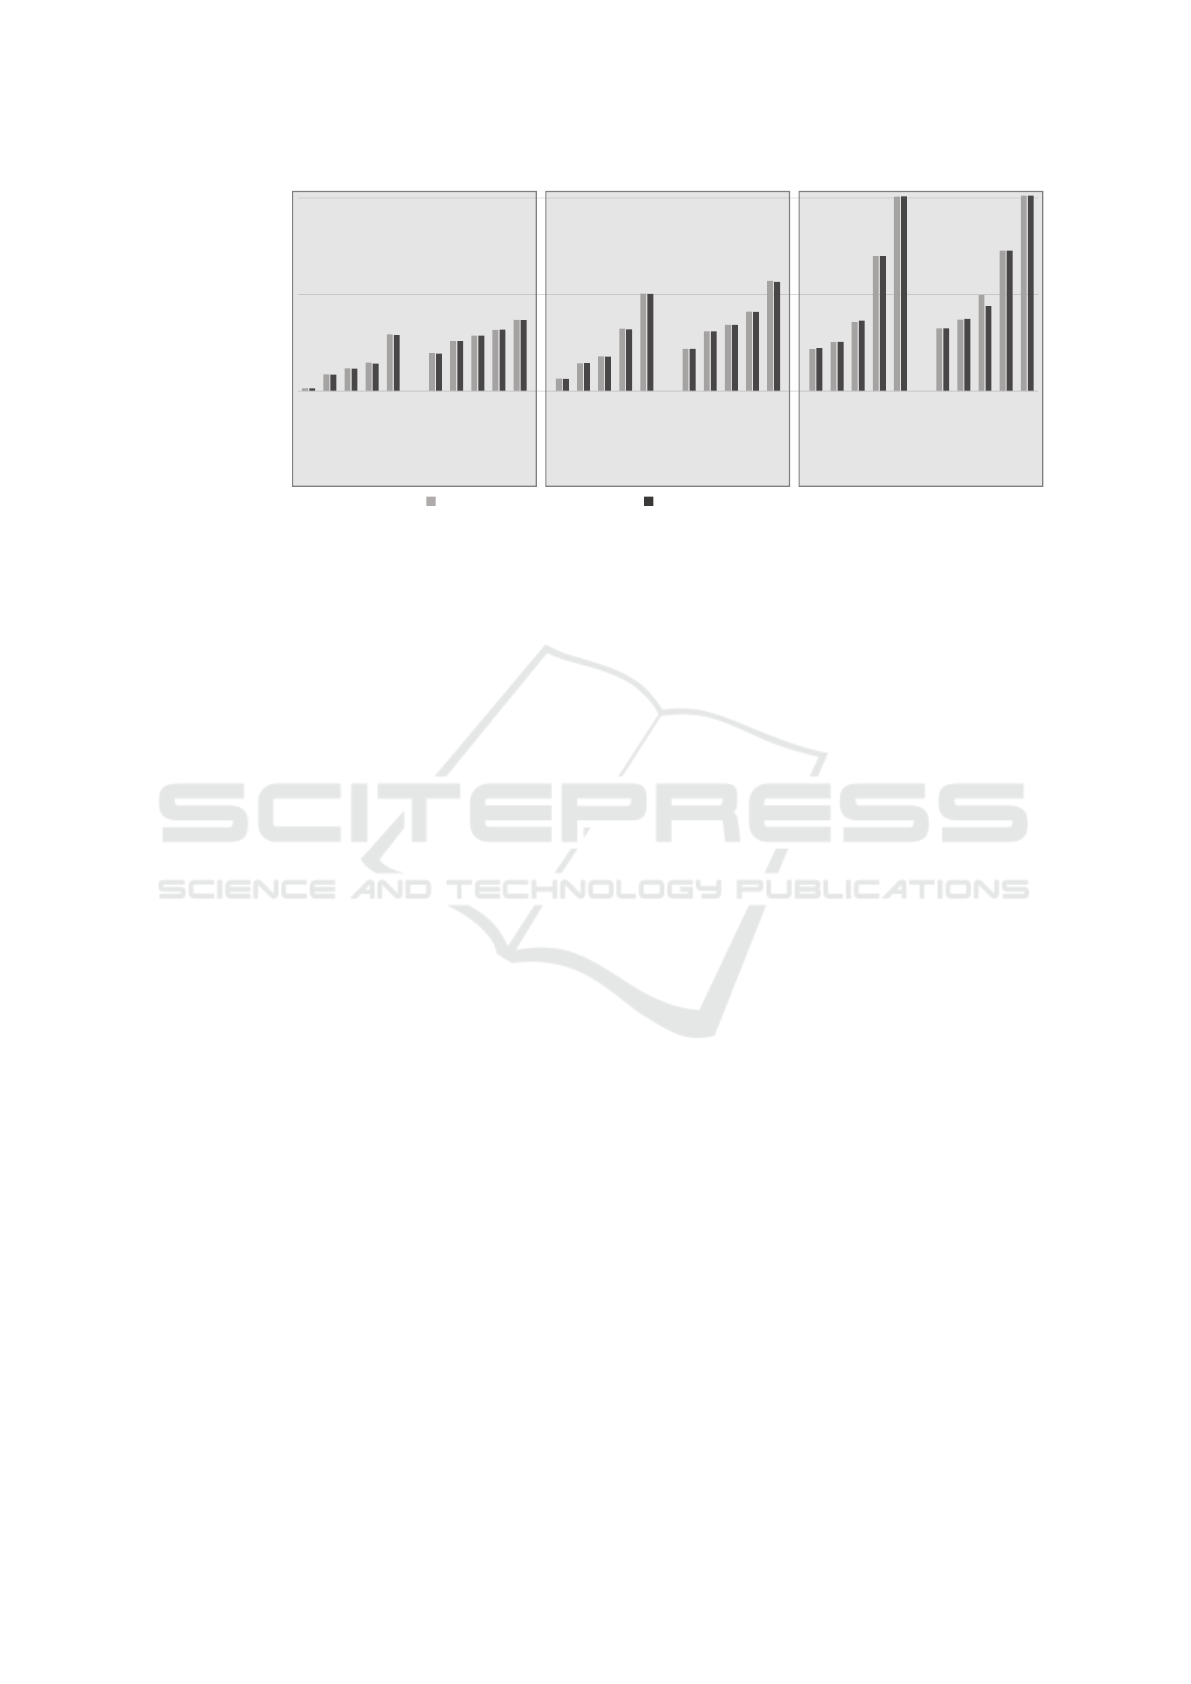
800
8000
80000
1 SM
4 SM
9 SM
64 SM
256 SM
1 SM
4 SM
9 SM
64 SM
256 SM
1 SM
4 SM
9 SM
64 SM
256 SM
1 SM
4 SM
9 SM
64 SM
256 SM
1 SM
4 SM
9 SM
64 SM
256 SM
1 SM
4 SM
9 SM
64 SM
256 SM
Rendering
time in
μ
s
Multi-Pass Rendering
Single-Pass Rendering
1080p
: 453 nodes : 2160p
1080p
: 1609 nodes : 2160p
1080p
: 35125 nodes : 2160p
Figure 4: Performance comparison of single-pass rendering and multi-pass rendering (logarithmic scale), depending on the
size of the software project (number of nodes), the resolution and the number of small multiples.
development of the software system. As new soft-
ware maps do not replace older ones, the client can
build up a mental map of the software system and
thus can focus on the differences and the develop-
ment of the software system. The consultant can fur-
ther guide the focus on specific software maps by set-
ting up the focus+context visualization. Given a large,
high-resolution display a single software map is pre-
sented at haptic sizes, inviting to discuss and explore
the states of the software system (Figure 2(c)).
5.2 Performance Evaluation
The run-time performance is evaluated for both the
multi-pass and the single-pass approach. The actual
GPU run-time for per-frame configuration and render-
ing of all small multiples is measured and averaged
over 2000 samples. The used datasets comprise 453,
1609, and 35125 tree map nodes, where each node is
represented by 12 vertices forming 10 triangles prior
to rasterization. All measurements were taken on a
Ubuntu 14.10 x64 Machine with an Intel Xeon at
8 × 2.8Ghz with 6GB RAM and an Nvidia GTX 680
graphics card with 1536 cores at 1215Mhz and 2GB
video memory. The performance measurements in-
dicate that both algorithms perform equally fast and
all datasets can be rendered at interactive frame-rates,
even at high resolutions (Figure 4).
5.3 Discussion
Although small multiples for software maps are an
effective tool to visualize multiple revisions and mul-
tiple themes at once, the proposed approach has limi-
tations and inherent properties, resulting from the na-
ture of small multiples. As small and medium soft-
ware system datasets can be rendered using a high
number of small multiples, massive datasets requires
higher performance by the rendering hardware. Fur-
ther, the overall number of modules in a software sys-
tem and the number of small multiples can result in
too small matrix cells for a meaningful software map
visualization. A generalization of software maps re-
duces both the required geometry and the visual clut-
ter and thus improves rendering performance and en-
ables for an overview of the software system (Rosen-
baum and Hamann, 2009). Such generalization has
to be aligned to the characteristics of the given soft-
ware system, especially generalizing inconspicuous
modules and highlighting suspicious ones. Further,
the proposed visualization technique is not restricted
to software maps but can be applied to other space-
restricted, implicit hierarchy visualization techniques
as well (Schulz et al., 2011).
6 CONCLUSIONS
This paper presents an interactive visualization tech-
nique for small multiples of software maps. It is
suitable for visualizing a number of software maps
simultaneously to facilitate direct comparison of the
software system’s structure with respect to differ-
ent revision and variable themes. Conducted perfor-
mance evaluations shows real-time rendering capabil-
ities for large-sized software maps and a high number
of small multiples. We further present suitable inter-
action techniques for synchronized navigation and a
user interface that combines small multiples with fo-
cus+context techniques. The presented concept was
tested with real-world datasets of different complex-
ity. It supports the exploration and analysis of soft-
ware system revisions in collaborative environments,
a common task for a software consultants.
IVAPP 2016 - International Conference on Information Visualization Theory and Applications
138

There are various directions for future work. For
example, using eye-tracking support or head track-
ing systems, it can be examined if a tilted soft-
ware map, depending on the viewpoint of the user,
can improve the view on small multiples in three-
dimensional scenes. Further, the alignment and man-
agement of the small multiples can be improved for
scalability in both number of revisions and themes.
ACKNOWLEDGEMENTS
The authors would like to thank seerene GmbH
(http://www.seerene.com/) for providing the datasets.
This work was funded by the German Federal
Ministry of Education and Research (BMBF) in
the InnoProfile Transfer research group ”4DnD-Vis”
(http://www.4dndvis.de/). We would also like to
thank the anonymous reviewers for their valuable
comments and suggestions to improve the paper.
REFERENCES
Anslow, C., Noble, J., Marshall, S., and Tempero, E.
(2009). Towards visual software analytics. Proc. of the
Australasian computing doctoral consortium (ACDC)
2009.
Archambault, D., Purchase, H., and Pinaud, B. (2011). An-
imation, small multiples, and the effect of mental map
preservation in dynamic graphs. IEEE TVCG 2011,
17(4):539–552.
Auber, D., Huet, C., Lambert, A., Renoust, B., Sallaberry,
A., and Saulnier, A. (2013). Gospermap: Using a
gosper curve for laying out hierarchical data. IEEE
TVCG 2013, 19(11):1820–1832.
Bavoil, L., Callahan, S. P., Scheidegger, C. E., Vo, H. T.,
Crossno, P., Silva, C. T., and Freire, J. (2005). Vis-
trails: Enabling interactive multiple-view visualiza-
tions. In IEEE Visualization 2005, pages 18–ff. IEEE.
Bladh, T., Carr, D., and Scholl, J. (2004). Extending tree-
maps to three dimensions: A comparative study. In
Computer Human Interaction, volume 3101 of LNCS,
pages 50–59. Springer Berlin Heidelberg.
Bohnet, J. and D
¨
ollner, J. (2011). Monitoring code qual-
ity and development activity by software maps. In
Proc. of the 2nd Workshop on Managing Technical
Debt 2011, pages 9–16. ACM.
Bremm, S., von Landesberger, T., Hess, M., Schreck, T.,
Weil, P., and Hamacher, K. (2011). Interactive visual
comparison of multiple trees. In IEEE VAST 2011,
pages 31–40. IEEE.
Burch, M. and Weiskopf, D. (2014). A flip-book of
edge-splatted small multiples for visualizing dynamic
graphs. In Proc. of the 7th International Symposium
on Visual Information Communication and Interac-
tion 2014, pages 29:29–29:38. ACM.
Caserta, P. and Zendra, O. (2011). Visualization of the static
aspects of software: A survey. IEEE TVCG 2011,
17(7):913–933.
Charters, S. M., Knight, C., Thomas, N., and Munro, M.
(2002). Visualisation for informed decision making;
from code to components. In Proc. of the 14th In-
ternational Conference on Software Engineering and
Knowledge Engineering 2002, pages 765–772. ACM.
Chen, J., Forsberg, A., Swartz, S., and Laidlaw, D. H.
(2007). Interactive multiple scale small multiples.
IEEE Visualization 2007 Poster Compendium.
Collberg, C., Kobourov, S., Nagra, J., Pitts, J., and
Wampler, K. (2003). A system for graph-based vi-
sualization of the evolution of software. In Proc. of
the Symposium on Software Visualization 2003, Soft-
Vis ’03, pages 77–ff. ACM.
Guerra-Gomez, J., Pack, M. L., Plaisant, C., and Shneider-
man, B. (2013). Visualizing change over time using
dynamic hierarchies: Treeversity2 and the stemview.
IEEE TVCG 2013, 19(12):2566–2575.
Hahn, S., Tr
¨
umper, J., Moritz, D., and D
¨
ollner, J. (2014).
Visualization of varying hierarchies by stable layout
of voronoi treemaps. In International Conference on
IVAPP 2014, pages 50–58.
Hauser, H. (2006). Generalizing focus+context visualiza-
tion. In Scientific visualization: The visual extraction
of knowledge from data, pages 305–327. Springer.
Isenberg, P. and Carpendale, S. (2007). Interactive tree
comparison for co-located collaborative information
visualization. IEEE TVCG 2007, 13(6):1232–1239.
Javed, W., McDonnel, B., and Elmqvist, N. (2010). Graph-
ical perception of multiple time series. IEEE TVCG
2010, 16(6):927–934.
Kehrer, J., Piringer, H., Berger, W., and Gr
¨
oller, E. (2013).
A model for structure-based comparison of many cat-
egories in small-multiple displays. IEEE TVCG 2013,
19(12):2287–2296.
Khan, T., Barthel, H., Ebert, A., and Liggesmeyer, P.
(2012). Visualization and evolution of software archi-
tectures. In OASIcs-OpenAccess Series in Informatics,
volume 27. Schloss Dagstuhl-Leibniz-Zentrum f
¨
ur In-
formatik.
Kokash, N., de Bono, B., and Kok, J. (2014). Template-
based treemaps to preserve spatial constraints. Inter-
national Conference on IVAPP 2014.
Kuhn, A., Loretan, P., and Nierstrasz, O. (2008). Consistent
layout for thematic software maps. In 15th Working
Conference on Reverse Engineering 2008, pages 209–
218. IEEE.
Lanza, M. and Ducasse, S. (2002). Understanding software
evolution using a combination of software visualiza-
tion and software metrics. In In Proceedings of LMO
2002 (Langages et Mod
`
eles
`
a Objets), pages 135–149.
Liu, X., Hu, Y., North, S., Lee, T.-Y., and Shen, H.-
W. (2013). Correlatedmultiples: Spatially coher-
ent small multiples with constrained multidimensional
scaling. Technical report, OSU Technical Report SE-
RIES (OSU-CISRC-4/13-TR10).
MacEachren, A. M., Dai, X., Hardisty, F., Guo, D., and
Lengerich, E. (2003). Exploring high-d spaces with
Interactive Revision Exploration using Small Multiples of Software Maps
139

multiform matrices and small multiples. In Confer-
ence on INFOVIS 2003, pages 31–38. IEEE.
Panas, T., Berrigan, R., and Grundy, J. (2003). A 3d
metaphor for software production visualization. In
14th International Conference Information Visualisa-
tion 2003, pages 314–314. IEEE.
Perin, C., Vernier, F., and Fekete, J.-D. (2012). Progressive
horizon graphs: Improving small multiples visualiza-
tion of time series. In Conference on INFOVIS 2012.
IEEE.
Phan, D., Paepcke, A., and Winograd, T. (2007). Pro-
gressive multiples for communication-minded visual-
ization. In Proceedings of Graphics Interface 2007,
pages 225–232. ACM.
Riccio, C. and Lilley, S. (2013). Introducing the pro-
grammable vertex pulling rendering pipeline. In GPU
Pro 4, pages 21–37. CRC Press.
Roberts, J. C. (2007). State of the art: Coordinated &
multiple views in exploratory visualization. In Proc.
of the 5th International Conference on Coordinated
and Multiple Views in Exploratory Visualization 2007,
pages 61–71. IEEE.
Rosenbaum, R. and Hamann, B. (2009). Progressive pre-
sentation of large hierarchies using treemaps. In Ad-
vances in Visual Computing, volume 5876 of LNCS,
pages 71–80. Springer Berlin Heidelberg.
Rufiange, S. and Melanc¸on, G. (2014). Animatrix: A
matrix-based visualization of software evolution. In
Second IEEE Working Conference on Software Visu-
alization (VISSOFT) 2014, pages 137–146. IEEE.
Schulz, H.-J., Hadlak, S., and Schumann, H. (2011). The
design space of implicit hierarchy visualization: A
survey. IEEE TVCG 2011, 17(4):393–411.
Shneiderman, B. (1992). Tree visualization with tree-maps:
2-d space-filling approach. ACM Trans. on Graphics
1992, 11(1):92–99.
Steinbr
¨
uckner, F. and Lewerentz, C. (2010). Representing
development history in software cities. In Proc. of the
5th International Symposium on Software Visualiza-
tion 2010, pages 193–202. ACM.
Tak, S. and Cockburn, A. (2013). Enhanced spatial stability
with hilbert and moore treemaps. IEEE TVCG 2013,
19(1):141–148.
Telea, A., Ersoy, O., and Voinea, L. (2010). Visual analyt-
ics in software maintenance: Challenges and oppor-
tunities. Proc. EuroVAST, Eurographics 2010, pages
65–70.
Trapp, M. and D
¨
ollner, J. (2010). Interactive rendering to
perspective texture-atlases. In Trans. of Eurographics
2010, pages 81–84.
Trapp, M., Schmechel, S., and D
¨
ollner, J. (2013). Interac-
tive rendering of complex 3d-treemaps. In Proc. of
GRAPP 2013, pages 165–175.
Tr
¨
umper, J. and D
¨
ollner, J. (2012). Extending recommen-
dation systems with software maps. In Third Inter-
national Workshop on Recommendation Systems for
Software Engineering (RSSE), pages 92–96. IEEE.
Tufte, E. (1990). Envisioning Information. Graphics Press.
van den Elzen, S. and van Wijk, J. J. (2013). Small mul-
tiples, large singles: A new approach for visual data
exploration. Computer Graphics Forum, 32(3):191–
200.
Voinea, L. and Telea, A. (2006). Multiscale and multi-
variate visualizations of software evolution. In Proc.
of ACM symposium on Software visualization 2006,
pages 115–124. ACM.
Wettel, R. and Lanza, M. (2008). Visual exploration of
large-scale system evolution. In 15th Working Con-
ference on Reverse Engineering 2008, pages 219–228.
IEEE.
Wettel, R., Lanza, M., and Robbes, R. (2011). Software
systems as cities: a controlled experiment. In Proc. of
the 33rd ICSE 2011, pages 551–560. ACM.
Wong, P. C. and Bergeron, R. D. (1994). 30 years of mul-
tidimensional multivariate visualization. In Scientific
Visualization, pages 3–33.
Yost, B. and North, C. (2006). The perceptual scalability of
visualization. IEEE TVCG 2006, 12(5):837–844.
IVAPP 2016 - International Conference on Information Visualization Theory and Applications
140
