
A Mobile Indoor Positioning System Founded on
Convolutional Extraction of Learned WLAN Fingerprints
Avi Bleiweiss
BShalem Research, Sunnyvale, U.S.A.
Keywords:
Indoor Positioning System, WLAN Fingerprint, K-Means Clustering, Convolutional Extraction, KNN.
Abstract:
The proliferation of both wireless local area networks and mobile devices facilitated cost-effective indoor
positioning systems that obviate the need for expensive infrastructure. We explore a floor-level, indoor lo-
calization system to predict the physical position of a mobile device holder in an office space by sensing a
fingerprint of signal strength values, received from a plurality of wireless access points. In this work, we
devise an instructive model that tailors elemental algorithms for unsupervised fingerprint learning, and resorts
to only using a single-layer convolutional neural-network, succeeded by pooling. We applied our model to a
fingerprint-based dataset that renders large multi-story buildings, and present a detailed analysis of the effect
of changing setup parameters including the number of hidden nodes, the receptive field size, and the stride
between extracted features. Our results surprisingly show that classification performance improves markedly
with a sparser feature extraction, and affirms a more intuitive gain, yet milder, as any of the number of features
or the tile size increases. Despite its simplicity, the positional accuracy we attained is sufficient to provide a
useful tool for a location-aware mobile application, purposed to automate the mapping of building occupants.
1 INTRODUCTION
One of the more prominent technologies to provide
occupancy information in commercial buildings is In-
door Positioning Systems (IPS). The expansion of
location-aware mobile computing to indoors, bene-
fits many real-world consumer applications, includ-
ing emergency responder, adaptive control of condi-
tioning and lighting, store navigation, and augmented
reality. For outdoors, location-based services (LBS)
typically utilize Global Positioning Systems (GPS)
that provide relatively accurate and robust positioning
solution. However, GPS require unobstructed line-
of-sight to the orbiting GPS satellites and indoors, its
signal becomes substantially compromised and pre-
sumed practically unfitting for resolving fine-grain
object locations. A variety of alternatives have been
proposed for indoor operation ranging from visual
through infrared and ultrasound to acoustic (Ruoxi
et al., 2014) sensing. Albeit being fairly matured,
these techniques are vulnerable to environmental dis-
ruptions and therefore require costly custom hard-
ware. On the other hand, the pervasive nature of radio
frequency (RF) signals spurred extensive research of
IPS founded on wireless networks along with WiFi
enabled mobile devices (Ching et al., 2010), to lever-
age an ever-growing and widespread infrastructure.
In recent years, location fingerprinting meth-
ods that harness existed wireless local area net-
work (WLAN) have been proposed for indoor spaces
(Kaemarungsi and Krishnamurthy, 2004). Most of
WLAN-based positioning systems in indoor environ-
ments rest on the Received Signal Strength Indicator
(RSSI) measure – the higher the RSSI power level,
the better the quality and speed of communications.
Typically, WLAN deployment performs a site sur-
vey on a rectangular grid of indoor locations to cap-
ture RSSI values from a multitude of dispersed wire-
less access points (WAPs), and obtain maximal space
coverage by overlapping transmittance beams. The
vector of RSSI intensities associated with each grid
point is termed the location fingerprint, and a set of
predetermined fingerprints then formalizes a training
database that maps all the grid nodes for locality of
reference. A mobile device held by an indoor area
occupant, captures the signal strengths from all wire-
less access points, and creates an RSSI vector sample
that is further compared to each of the database finger-
prints. The position of the person thus corresponds
to the location correlated with the most similar fin-
gerprint of the database map (Marques et al., 2012)
(Zhou and Shi, 2009). Location accuracy, defined as
214
Bleiweiss, A.
A Mobile Indoor Positioning System Founded on Convolutional Extraction of Learned WLAN Fingerprints.
DOI: 10.5220/0005685702140223
In Proceedings of the 5th International Conference on Pattern Recognition Applications and Methods (ICPRAM 2016), pages 214-223
ISBN: 978-989-758-173-1
Copyright
c
2016 by SCITEPRESS – Science and Technology Publications, Lda. All rights reserved
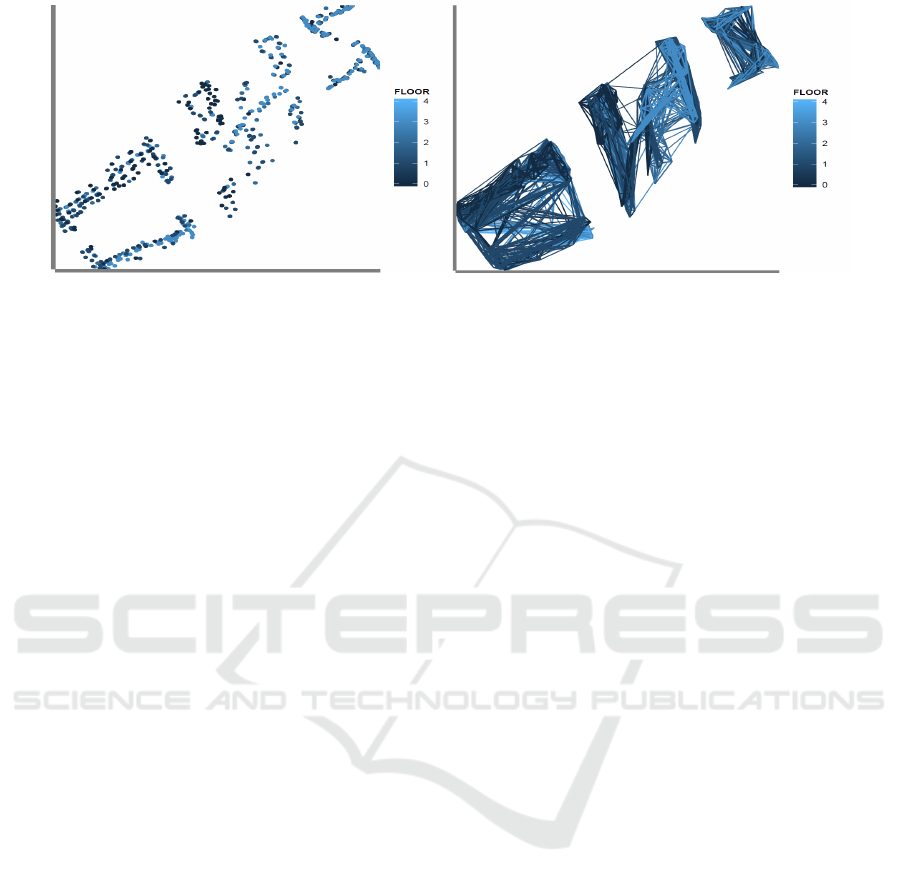
(a) Point spread. (b) Line path.
Figure 1: Physical positional distribution of training data: each mobile device location is expressed in two-dimensional
coordinates, shown for each of the floors of the three UJI university buildings in both point spread and line path formations.
the error distance from the actual position, largely de-
pends on the prediction algorithm used and the dataset
size (Chen et al., 2006). A real-world application that
utilizes a WiFi-based positioning system to track con-
struction site workers, reports a favorable location ac-
curacy of under five meters (Woo et al., 2011).
The fingerprint calibration data collected in an of-
fice building is often annotated with a ground-truth
location of the mobile device. However, to enable
context-aware services that scale well to large wire-
less infrastructures, mobile devices rather construct
their own spatial representation based on sequences
of unlabeled RSSI data. This requires the device to
simultaneously estimate both its location and the en-
vironment mapping (SLAM), corollary to practices in
the domain of robotics. To model WiFi signal propa-
gation in space, the work by Ferris et al. (Ferris et al.,
2007) is one technique that builds RSSI maps at run-
time without resorting to location training labels. By
reducing the high dimensional vector of values em-
anated from all the WAPs in the environment to a two
dimensional embedding space, the method facilitates
an immediate translation to extract an objective pair
of longitude and latitude coordinates of the device.
In our work, we use a pre-compiled SLAM
dataset, UJIIndoorLoc, publicly accessible from the
UCI Machine Learning Repository (UCI, 2014) and
known to date as the largest collection of WiFi finger-
prints. UJIIndoorLoc comprises distinct training and
validation sets, and is specifically targeted to provide
a reference platform for comparing results of indepen-
dent research that evaluates fingerprint-based indoor
localization methodologies. The dataset represents
three buildings of the Jaume I University (UJI) cam-
pus, each of either four or five floors, with a surface
coverage exceeding 10
5
m
2
(Torres-Sospedra et al.,
2014). Figure 1 illustrates the physical positional dis-
tribution of the training data collection. Each mobile
device location is formulated as a pair of longitude
and latitude variables, with occupancy displayed for
each of the floors of the three target buildings, and
shown in both point spread and line path formations.
A remarkable research effort has been devoted to
learning features from unlabeled input data for clas-
sification objectives, often typified by deploying in-
creasingly complex algorithms and training a multi-
layer of representations, one layer at a time. For an-
alyzing system performance, each of the layers is pa-
rameterized by the number of features to learn, the
location coordinates of where features are computed,
and the designed encoding scheme of system inputs
and outputs. In this paper, we explore these parame-
ter choices in seeking higher accuracy rate for predict-
ing a floor-level location of a mobile device indoors,
but rather pursue an economical single-layer, convo-
lutional neural-network (CNN) architecture, trained
by simple and primitive unsupervised-learning (Duda
et al., 2001) methods. Prior work on analyzing single-
layer CNN centered primarily on imaging benchmark
datasets (Coates et al., 2011), and to the best of
our knowledge, the system we propose is the first to
incorporate this methodology for evaluating indoor
positioning systems. Our proposed solution seam-
lessly consolidates both information retrieval (Man-
ning et al., 2008) and unsupervised machine learning
algorithms, as information retrieval (IR) is rapidly be-
coming the dominant form of data source access. Our
work closely leverages IR practices and follows ef-
ficient similarity calculations directly from the well
known Vector Space Model (Salton et al., 1975).
Most schemes of feature learning have revolved
around single-layer models that are cascaded to build
a deeper hierarchy. Typically, the basic building block
of a feed-forward CNN alternates between filter banks
and a down-sampling layer, and amongst the many
modules a CNN is composed of, the unsupervised
A Mobile Indoor Positioning System Founded on Convolutional Extraction of Learned WLAN Fingerprints
215
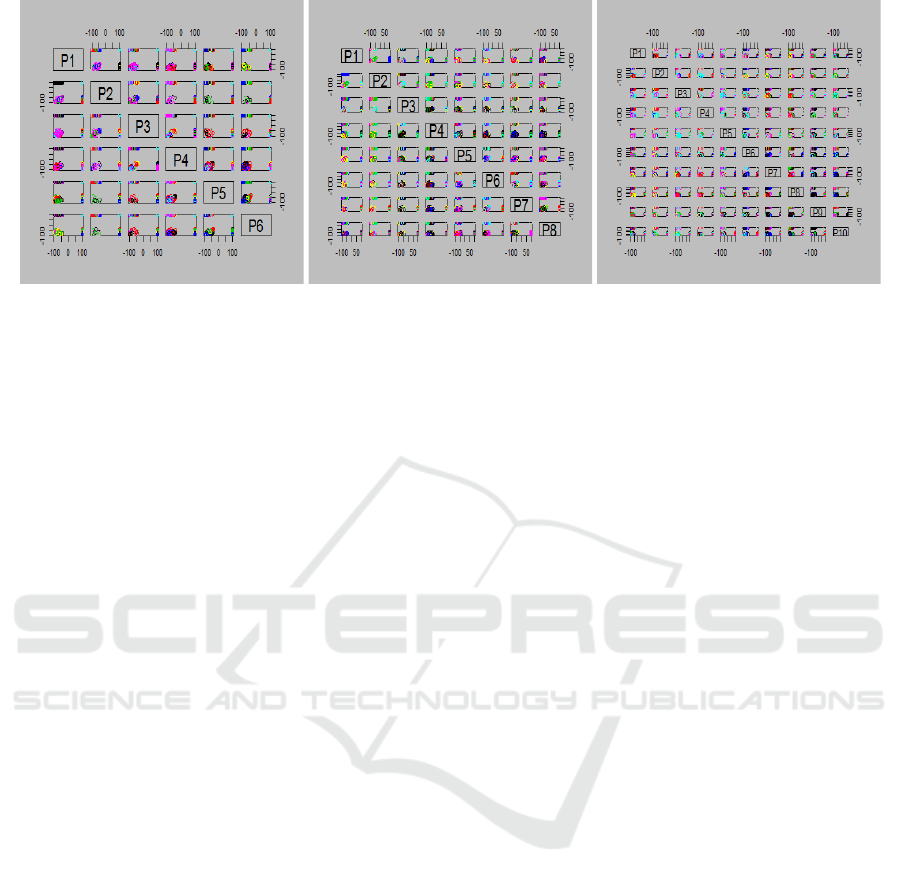
(a) w = 6. (b) w = 8. (c) w = 10.
Figure 2: Visualization of centroids learned by k-means clustering of the UJIIndoorLoc validation set, with 25 randomly
selected tiles from each of the unlabeled WiFi fingerprints, and shown for K = 100 as a function of the receptive field size, w.
learning algorithm appears to be the most probed.
However, recent studies considered the performance
impact of other system level parameters that directly
affect the design tradeoffs of a CNN architecture, in-
cluding the number of hidden nodes, the receptive
field size, and the sampling stride. The work by Jarrett
et al. (Jarrett et al., 2009) proved that introducing non-
linearity following the filter banks, produces sparse
features that are more suitable for subsequent pool-
ing and shown to be the most single important fac-
tor to improve object recognition accuracy. Similarly,
over-specifying a larger number of distinctly sampled
patches, is the most influential parameter governing
visual categorization results (Nowak et al., 2006).
The main contribution of our work is demonstrat-
ing that the CNN design considerations we laid out
may, in fact, be principal to the algorithm efficacy in
learning WiFi fingerprint features for improving the
accuracy rate of predicting the floor-level location of
a human-held mobile device. Potentially, more im-
portant even than the selection of the unsupervised
learning algorithm itself. To further commit to this
assertion, we use the simple k-means clustering al-
gorithm that requires no tuning parameters and has
not been widely adapted for deep feature learning.
Surprisingly, our analysis attributes more weight to
the choice of feature stride and increased sparsity for
ameliorating indoor location prediction, in contrast to
the common intuition broadly perceived in the image
understanding domain that a denser formulation mer-
its a higher object detection rate. The rest of this paper
is organized as follows. In section 2, we describe our
feature learning framework that incorporates k-means
clustering, coupled with a hard and a soft activation
function versions. Section 3 outlines the process flow
of fingerprint feature extraction prescribed in a pa-
rameterized single-layer CNN architecture, leading to
our majority-voting based k-nearest neighbor, base-
line classification method. We then present our eval-
uation methodology for analyzing WiFi fingerprint-
ing in using the UJIIndoorLoc (UCI, 2014) dataset,
and report extensive quantitative results of our exper-
iments, in section 4. We conclude with a discussion
and future prospect remarks in section 5.
2 FINGERPRINT LEARNING
In our feature learning framework, we view the
dataset of WiFi fingerprint vectors as a matrix W ∈
R
mxn
, where m are the distinct, indoor mobile-device
locations, and n the RSSI measurements captured
from all the WAPs in all the site buildings. We then
define a fingerprint tile as a contiguous subset of a fin-
gerprint vector with a dimension w and of d channels.
Conventionally, w is referred to as the receptive field
size and for fingerprint data, d is fixed and set to one.
Each fingerprint tile is then represented as a vector
x ∈ R
N
of RSSI intensity values, where N = w · d.
Our fingerprint learning process proceeds in sev-
eral stages. First, we extract random tiles from unla-
beled training fingerprints and construct a dataset of l
randomly sampled tiles X = {x
(1)
,x
(2)
,...,x
(l)
}, where
x
(i)
∈ R
N
. Then, every tile, x
(i)
, is optionally normal-
ized by subtracting the mean and dividing by the stan-
dard deviation of the tile vector elements. After tile
normalization, to discover features (Rajaraman and
Ullman, 2011) from unlabeled WiFi fingerprint data,
we employ the exceptionally efficient and simple to
tune k-means clustering algorithm that is used exten-
sively in the domain of computer vision. The k-means
unsupervised learning procedure takes the dataset X
and produces a function f : R
N
→ R
K
that maps an in-
put tile vector x
(i)
to a new feature vector of K dimen-
sionality, where K is an algorithm control parameter
ICPRAM 2016 - International Conference on Pattern Recognition Applications and Methods
216
that sets the number of clusters to generate, and the
k
th
feature of the mapped vector is denoted as f
k
. The
k-means algorithm uses the Euclidean distance mea-
sure and learns K centroids, c
(k)
, from the input tiled
data, X. Figure 2 provides visualization of bases, or
centroids, learned by k-means clustering of the UJI-
IndoorLoc validation set, with 25 randomly selected
tiles from each of the unlabeled WiFi fingerprints, and
shown for K = 100 as a function of an increased re-
ceptive field size, w. We consider two versions of the
feature mapping function f (Coates et al., 2011). A
standard 1-of-K, hard assignment encoding scheme
f
k
(x) =
(
1 if k = argmin
j
kc
( j)
− xk
2
2
0 otherwise,
(1)
and a non-linear soft mapping that offers a sparse out-
put, more suitable to the CNN pooling stage, and is
governed by the following equation
f
k
(x) = max{0,µ(z) − z
k
}, (2)
where z
k
= kx−c
(k)
k
2
and µ(z) is the mean of the ele-
ments of z. Function f transforms an input tile x ∈ R
N
to a new representation y = f (x) ∈ R
K
that we use as
a learned feature extractor and apply it to our labeled
training fingerprints, for classification. Hereon, to tell
them apart, the activation functions are referred to as
k-means hard and k-means soft, respectively.
3 CNN EXTRACTION
In this step, we extract features from equally spaced
tiles that cover an entire input fingerprint vector of the
labeled training dataset, and further reduce layer di-
mensionality by pooling features together over speci-
fied regions. We apply either the hard or the soft ver-
sion of our k-means feature extractor, f : R
N
→ R
K
, to
a multitude of fingerprint tiles, each of length w, and
compute a compact representation y ∈ R
K
for each
tile. The definition of a single layer architecture for
convolutional fingerprint extraction ensues by deploy-
ing the function f to any number of tiles, uniformly
selected from the entire scope of an input fingerprint
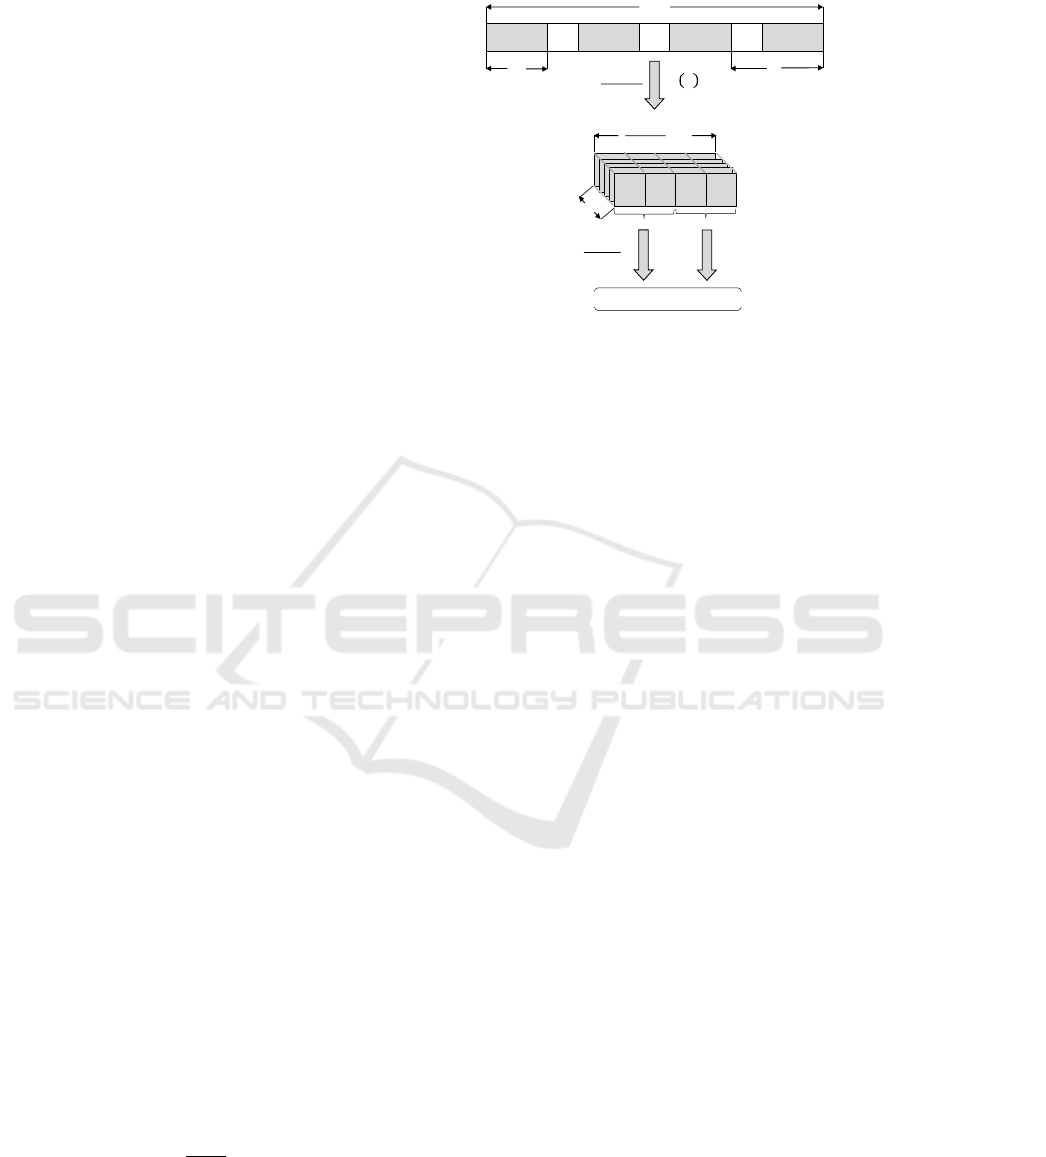
vector. This process is graphically staged in Figure
3. Distinctly, given a single channel, WiFi fingerprint
vector of n RSSI intensity elements, construed as tiles
of a receptive field size w each, and are evenly spaced
by a stride s of signal strength values, we formalize
the interpretation y as (
(n−w)
s
+1), K-dimensional fea-
ture vectors, each computed for a fingerprint tile.
The extracted feature vectors, y
(i)
, are succes-
sively pooled over two evenly sized half-space bins by
computing the sum of all the y
(i)
contributing in each
Tile
Representation
Classification
Features
Input
Fingerprint
mapping
pooling
Figure 3: Convolutional feature extraction using a receptive
field size w and a stride s. Evenly distributed WiFi tiles,
x
(i)
, of the input fingerprint vector of n RSSI intensity com-
ponents, are mapped to K-dimensional feature vectors to
form a new fingerprint interpretation. Following a standard
practice in deep feature learning, the mapped vectors are
then sum-pooled over a half-space local region to derive a
feature vector Φ of dimensionality 2K, we further use for
classification. For clarity, the stride shown for the input fin-
gerprint vector is greater than the receptive field size, but in
practice, the step s is almost always smaller than w.
region, to form the feature vector Φ of dimensionality
2K that we use for classification. Given t, the number
of tile samples in a fingerprint of size n, then the rela-
tionship t · K n often holds to justify pooling for di-
mensionality reduction of features, a key step to merit
efficient classification computation. To our pooled,
2K-dimensional feature vectors, Φ
(i)
, constructed for
each training WiFi fingerprint and a label, we apply
a majority-voting based k-nearest neighbor (Cormen
et al., 1990), baseline classifier to evaluate our system
cross-validation accuracy for predicting floor-level in-
door location of a mobile device.
4 EMPIRICAL EVALUATION
To validate our system in practice, we have imple-
mented a software library that realizes the analysis of
WiFi fingerprinting in several stages. After collect-
ing and cleaning the archived indoor data, we learn
unlabeled fingerprints by performing k-means clus-
tering (Kaufman and Rousseeuw, 1990) on randomly
selected tiles drawn from the validation dataset. Us-
ing a single-layer CNN architecture, we then extract
features from labeled training fingerprints for classifi-
cation. Our learning framework behavior is primarily
governed by the setting of the number of features, K,
the receptive field size, w, and the stride, s. We report
our experimental results on the impact of modifying
A Mobile Indoor Positioning System Founded on Convolutional Extraction of Learned WLAN Fingerprints
217

Table 1: Positional distribution of humanly held mobile devices, broken down by individual floors of each of the experimented
UJI campus buildings, for both the training and validation subsets. NA signifies a non-existent fifth floor in a building.
Dataset Building 1
st
Floor 2
nd
Floor 3
rd
Floor 4
th
Floor 5
th
Floor Total Mean SD
Training 1 1059 1356 1443 1391 NA 5249 1049.8 172.6
2 1368 1484 1396 948 NA 5196 1039.2 239.1
3 1942 2162 1577 2709 1102 9492 1898.4 605.4
Validation 1 78 208 165 85 NA 536 134 63.2
2 30 143 87 47 NA 307 76.8 50.2
3 24 111 54 40 39 268 53.6 33.8
these parameters by performing cross-validation.
4.1 Experimental Setup
Our work exploits the R programming language (R,
1997) to acquire the raw UJIIndoorLoc dataset from
the UCI Machine Learning Repository (UCI, 2014),
and fosters cleanup to serve useful in our software
environment. The extensive WiFi fingerprint dataset,
purposed to evaluate indoor positioning systems, is
multivariate and every row of the data frame com-
prises 529 columns that coalesce features of differ-
ent categories, each represented as a vector, possibly
combining real, integer, and boolean element types.
A set of intensity values leads off to form the WiFi
fingerprint vector. A fingerprint is described by 520
integer elements, each spans the [−104,0] decibel-
milliwatts (dBm) range, corresponding to the weak-
est (−104dBm) and exceptionally strong (0dBm) sig-
nal when contributed by a discovered wireless access
point, or set uniformly to +100dBm to indicate an
undetected WAP. Individual RSSI measurements both
inside [−45dBm,0dBm] and under −95dBm are rare
and retain inconsequential percentage of the total in-
tensity values captured (Torres-Sospedra et al., 2014).
Each fingerprint rendition follows with an asso-
ciated set of six real-world device location proper-
ties, to be either partially or in its entirety predicted
in the classification process. This output label vector
comprises three-dimensional positional coordinates
including longitude and latitude that are measured in
meters and reference the Universal Transverse Mer-
cator (UTM) grid, and an altitude value designated by
the floor enumeration in a building ∈ [0,4]. Along
with relational space identifiers that further expand
the fingerprint physical position and incorporate the
building id ∈ [0, 2], a categorical definition of the in-
door closed area that encompasses the wireless trace
e.g. a classroom, a lab, or an office, and a location
proximity indicator denoting the held device of being
either inside the specified region or outside and right
in front of the door of the prescribed space perimeter.
Lastly, a global class of attributes correlate user
and mobile device information to the acquired finger-
print data, and in addition provides an accurate and
device independent time-stamp for the WiFi record-
ing that took place. Eighteen individuals in total,
user id ∈ [1,18], participated in the process of collect-
ing the training samples, each identified by a phys-
ical height that is dereferenced via a separate table.
This adds a fine-grained, spatial positional dimension
to the device, found to directly impact its RSSI read-
ings (Kaemarungsi and Krishnamurthy, 2004). Mo-
bile device wise, twenty unique phone models, pop-
ulated with twenty five distinct Android OS versions,
were deployed to obtain the fingerprint data. As a
three dimensional table facilitates the essential map-
ping from an itemized device list onto a phone model,
the installed system-image version, and the associated
user enumeration. User id 0 is uniquely assigned for
capturing the validation fingerprint collection and its
occurrences relate several different phone models.
Quantitatively, the UJIIndoorLoc dataset is split
into a training subset of 19,937 fingerprint instances,
and an exclusive validation part of 1,111 WiFi record-
ings. Training held-device locations regularly corre-
spond to pre-defined reference points, whereas vali-
dation wireless readings were gathered from arbitrary
coordinates inside the buildings, without performing
any user tracking to better emulate a real-world indoor
positioning system. Notably, the validation collection
has several fields intentionally unlabeled in each of its
records, including the affiliated closed space and user
properties. Table 1 shows positional distribution of
humanly held mobile devices, broken down by indi-
vidual floors of each of the targeted UJI campus build-
ings, for both the training and validation subsets. The
first and the second subject buildings are each of four
floors with more evenly spread training fingerprints,
as the third building has five stories and exposes a
ICPRAM 2016 - International Conference on Pattern Recognition Applications and Methods
218

Table 2: Unique RSSI values presented in a fingerprint tile dataset, X
i
,shown as a function of increased receptive field size.
Receptive Field Size 2 4 6 8 10 12 14 16 18
Unique Fingerprints 341 927 1506 2110 2664 3194 3737 4171 4620
higher standard deviation. For this study, we are pri-
marily interested in the system performance of classi-
fying floor-level device location, hence longitude, lat-
itude, and space properties of the output feature vector
are unsubstantiated. Similarly, analysis related to user
and device attributes is outside the scope of our cur-
rent implementation and is deferred to future work.
4.2 Experimental Results
In this section we report experimental results of eval-
uating our indoor positioning system, using the UJI-
IndoorLoc validation subset to cross-validate its train-
ing companion. Our testing methodology commences
by training unnormalized WiFi fingerprints in a sin-
gle layer CNN, employing both the hard and soft ver-
sions of the k-means feature mapping function f , as
we vary our system parameters K, w, and s. We then
train a baseline k-nearest neighbor (KNN) classifier
and test it on the validation set. In KNN, we compute
the Euclidean-squared distance between a validation-
fingerprint mapped vector against each learned train-
ing vector. Our selected k = 10 most nearest training
samples are sorted in a non-descending order, and by
a majority rule we derive a score for all the building-
floor pairs. This score is further accumulated and av-
eraged across validation fingerprints, singled out for
each of the building-floor pairs, and the matching pair
corresponds then to the highest average scoring. Our
experiments ascribe a discrete value set to each of our
model parameters, K, w, and s. Respectively, we use
representations of 10, 25, 50, 100, and 250 learned
features, a series of receptive field sizes ∈ [2,18] in
increments of two, and stride values of 1, 2, 4 and 8.
A close observation at the validation raw finger-
prints reveals a highly sparse data structure with a
fairly large proportion of about 91% of vector ele-
ments are assigned the value of +100dBm, signifying
many wireless access points are undiscovered at the
designated device locations. This review warranted
the generation of many thousands of fingerprint tiles
to challenge the dispersed WiFi feature data, and en-
sure that k-means produces statistically reasoned clus-
ters. Hence, in learning our fingerprint feature rep-
resentation, for every system setting of the receptive
field size we sampled 25 random tiles from each of
the RSSI recording vectors of the unlabeled validation
set, and constructed our collection of tile datasets, X
i
,
where i ∈ 1,2,...,T , and T = 9, the number of system
choices for setting w. For 1,111 WiFi fingerprints, this
yielded per dataset a total of 27,775 tiles to learn their
centroids from, each with a corresponding dimension-
ality of the specified receptive field size. From an al-
ternate perspective, the uniqueness of values obtained
from WiFi signal measurements in a tile dataset, X
i
, is
also vital to clustering robustness. Table 2 depicts the
number of distinct RSSI vectors in each of the des-
ignated tile datasets, X
i
, as a function of our exper-
imental set of receptive field sizes, shown in a non-
descending order. Given our discrete choices for vary-
ing the number of features, K, we hereon report our
results using receptive field sizes that are greater than
four, with no less than 1,500 differentiable tiles.
For succinctness, we use the compact notation
λ(K, w,s) to describe our parametrically driven, IPS
implementation model that exploits a single layer
CNN. Using the UJIIndoorLoc validation dataset, we
evaluate our system for floor-level device location
pairing, by only varying one model parameter at a
time, while keeping the other two variables uniformly
constant and assigned to a prescribed default value.
First, we modified the number of features, or cen-
troids, K, in conjunction with fixing the receptive
field size to six RSSI length, and setting the fea-
ture extracting spacing between fingerprint tiles to
one, generally considered optimal for convolutional
learning systems. However, systems for learning fea-
tures from two dimensional images use a stride s > 1
to step across patches and avoid excessive computa-
tional cost. In contrast, for the WiFi fingerprint data,
traversing the tiles is of a considerably reduced linear
time complexity, and lets us strike a more reasonable
balance between process running time and algorithm
robustness. Figure 4(a) and Figure 5(a) show the ef-
fect on system average accuracy as the experimentally
prescribed, number of learned centroids increases, ap-
plying both the hard and soft versions of the k-means
activation function, f , respectively. For visualization
conciseness, positional performance is categorized by
the subject building id, rather than by each and every
pair of building and floor combinations. In learning
more centroids, the soft algorithm attains higher posi-
tional accuracy almost consistently for all the three
buildings. The mild performance decline observed
for K = 250 is mostly attributed to constraint clus-
tering due to our highly sparse tiling datasets. On the
other hand, k-means hard performed as expected for
A Mobile Indoor Positioning System Founded on Convolutional Extraction of Learned WLAN Fingerprints
219

0.5
0.55
0.6
0.65
0.7
10 25 50 100 250
Accuracy
Features
Bldg1 Bldg2 Bldg3
(a) Number of features, K.
0.55
0.6
0.65
0.7
0.75
6 10 14 18
Accuracy
Receptive Field Size
Bldg1 Bldg2 Bldg3
(b) Receptive field size, w.
0.55
0.6
0.65
0.7
0.75
0.8
0.85
1 2 4 8
Accuracy
Stride
Bldg1 Bldg2 Bldg3
(c) Stride, s.
Figure 4: Floor-level, system average accuracy using the hard k-means feature mapping function. Shown for varying each of
the model governing parameters, (K, w, s), and each categorized by the subject building id.
0.5
0.55
0.6
0.65
0.7
10 25 50 100 250
Accuracy
Features
Bldg1 Bldg2 Bldg3
(a) Number of features, K.
0.55
0.6
0.65
0.7
0.75
6 10 14 18
Accuracy
Receptive Field Size
Bldg1 Bldg2 Bldg3
(b) Receptive field size, w.
0.55
0.6
0.65
0.7
0.75
0.8
0.85
1 2 4 8
Accuracy
Stride
Bldg1 Bldg2 Bldg3
(c) Stride, s.
Figure 5: Floor-level, system average accuracy using the soft k-means feature mapping function. Shown for varying each of
the model governing parameters, (K, w, s), and each categorized by the subject building id.
the third building, but rather exposes an inconsistent
accuracy drop for both building ids, one and two. No-
tably, the 3
rd
building occupies five floors and owns
almost half of the training fingerprint data (Table 1).
Next, we stepped discretely along the second axis
of our learning model, λ(K,w, s), and quantified the
related incremental effect on our floor-level, posi-
tional classification rate. We sought after leveraging
the k-means algorithm to learn larger receptive fields
and possibly reduce feature sparseness in a tile that
overlaps an enlarged extent of a raw WiFi fingerprint.
Clearly, this necessitates an expansion of the state
space for the learning algorithm to operate on, and
thereof mandates an increased number of features to
learn. For this experiment, we tried receptive field
sizes of 6, 10, 14, and 18 to ensure the tile datasets
are of the highest distinctive wireless recordings. We
held the stride to one RSSI length, and selected a rea-
sonably high count of 100 centroids. An overview of
our performance results for both the hard and soft ver-
sions of our k-means feature mapping is shown in Fig-
ure 4(b) and Figure 5(b), respectively. Both variants
of f behave almost identically, though the soft version
is more modestly stable, and trend towards elevating
location matching accuracy as the receptive field size
increases, with the exception of the third target build-
ing that displays a relatively flat performance.
Lastly, we evaluated the impact of altering the
stride parameter, s, on predicting the indoor location
of a humanly held, mobile device. For this experi-
ment we varied the stride over 1, 2, 4, and 8 consec-
utive RSSI elements, fixed the number of centroids
to learn to 100, and set the receptive field size w to
6. The summary of our performance results for both
the hard and soft versions of our activation function,
f , is shown in Figure 4(c) and Figure 5(c), respec-
tively. Surprisingly, our results challenge a basic intu-
ition that despite an apparent reduction of the tile sam-
pling rate, we rather demonstrate a striking upward
accuracy trend as we increase the step size between
fingerprint tiles. Indifferent to the mapping function
form, floor-level accuracy for building one, for exam-
ple, depicts a marked climb from 0.58 to 0.79, or a
36% gain, as the stride treads a full extent from 1 to 8
RSSI units. In contrast to a much milder performance
gain observed when varying any of the centroid count
or the receptive field size, model parameters.
In addition to reporting average accuracy per sub-
ject building, we were interested in evaluating our
absolute system performance of device positional
matching for the broader and finer composition set
of all the possible building-floor pairs, p
br
, where
ICPRAM 2016 - International Conference on Pattern Recognition Applications and Methods
220
11
12
13
14
21
22
23
24
31
32
33
34
35
35
34
33
32
31
24
23
22
21
14
13
12
11
(a) K = 100, w = 6, s = 1.
11
12
13
14
21
22
23
24
31
32
33
34
35
35
34
33
32
31
24
23
22
21
14
13
12
11
(b) K = 100, w = 14, s = 1.
11
12
13
14
21
22
23
24
31
32
33
34
35
35
34
33
32
31
24
23
22
21
14
13
12
11
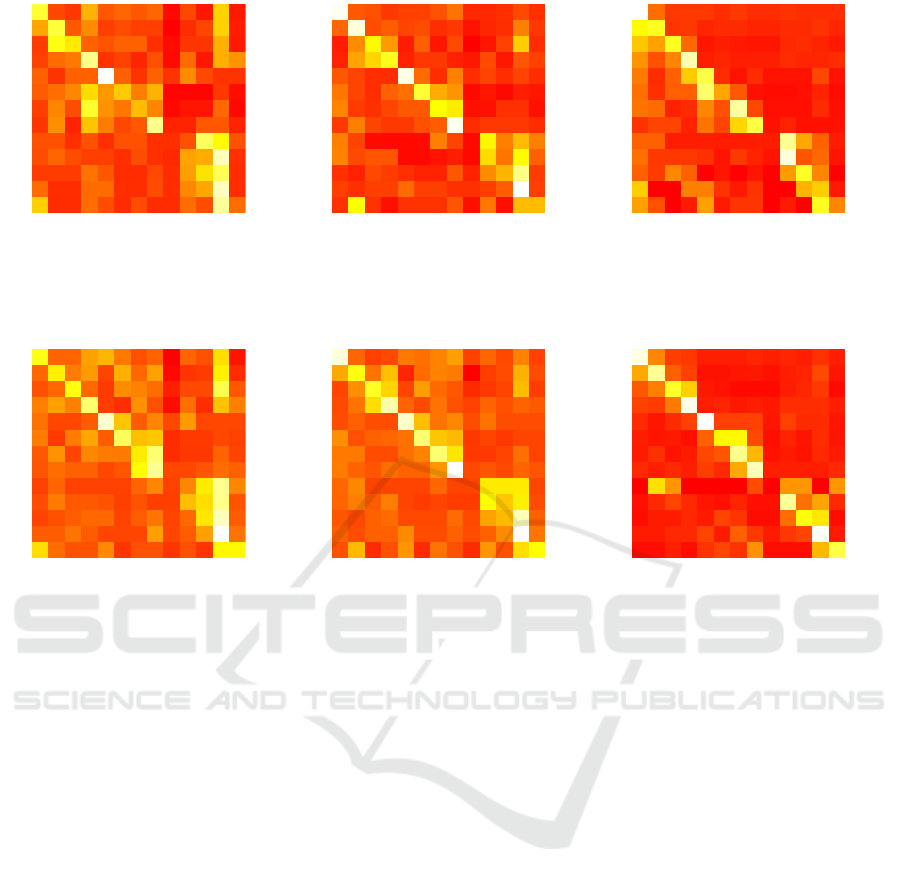
(c) K = 100, w = 6, s = 8.
Figure 6: Confusion matrices for all the valid thirteen building-floor combination pairs, using k-means hard learning with
preferred model parameters, (K,w, s).
11
12
13
14
21
22
23
24
31
32
33
34
35
35
34
33
32
31
24
23
22
21
14
13
12
11
(a) K = 100, w = 6, s = 1.
11
12
13
14
21
22
23
24
31
32
33
34
35
35
34
33
32
31
24
23
22
21
14
13
12
11
(b) K = 100, w = 14, s = 1.
11
12
13
14
21
22
23
24
31
32
33
34
35
35
34
33
32
31
24
23
22
21
14
13
12
11
(c) K = 100, w = 6, s = 8.
Figure 7: Confusion matrices for all the valid thirteen building-floor combination pairs, using k-means soft learning with
preferred model parameters, (K,w, s).
1 ≤ b ≤ 3 and 1 ≤ r ≤ 5, excluding the non-existent
p
15
and p
25
pairing choices, as prescribed by the UJI-
IndoorLoc dataset. Figure 6 and Figure 7 depict con-
fusion matrices for all predicted against actual thir-
teen building-floor combination pairs, p
br
, assessing
both the hard and soft designs of the feature mapping
function, f , respectively. As the parameters of our
learning model, λ(K,w,s), are fixed to a limited set
of preferred values we obtained from analyzing our
building scoped performance data. Evidently, results
for stride s = 8 are by far the better achieving with a
slight edge towards the soft activation version.
Selecting a set of model parameters entails thereof
a location-pairing accuracy tradeoff, we further quan-
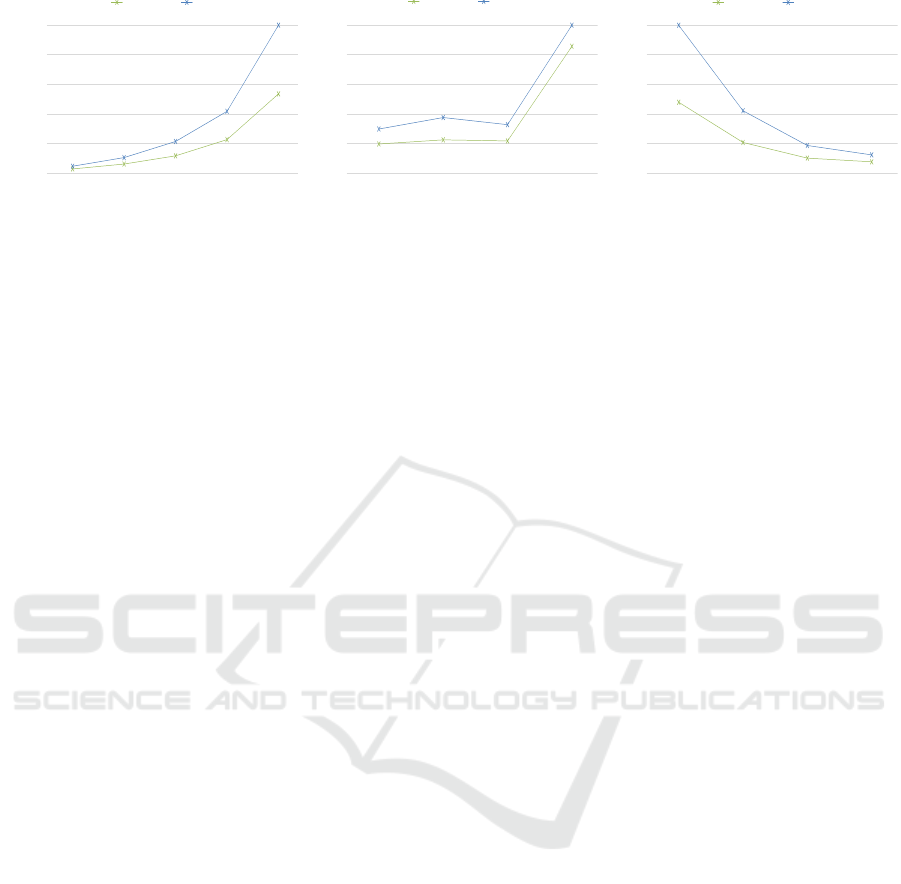
tify against the implied computational cost. Figure 8
shows the normalized running time of feature learn-
ing, as we vary each of the governing parameters,
(K, w, s), and respectively contrasting the hard with
the soft k-means mapping functions. Execution time
tends to rise fairly close to linear as the number of
centroids to learn increases, whereas a local minimum
is evident for w = 14 and immediately thereafter a
steep non-linear leap, as we step through the exper-
imental receptive field sizes. Incrementing the stride,
s, consistently trends a notable commensurate decline
of running time. Overall, and as expected, the soft
feature mapping tracks well the hard version behav-
ior, albeit running slower and at a proportional scale.
5 CONCLUSIONS
We have demonstrated the apparent potential in de-
ploying a learning architecture comprised of a sin-
gle convolutional layer for extracting WiFi fingerprint
features, to predict floor-level position of a human-
held mobile device, indoors. We conducted exten-
sive experiments using the recently introduced UJI-
IndoorLoc dataset, and assessed the effect of varying
neural-network parameters on location matching ac-
curacy. Despite an extremely simple learning algo-
rithm, k-means clustering, each of the model controls
we tested including centroid count, receptive field
size, and stride, conferred either a milder or a signifi-
cant impact on our system classification performance.
One of the major challenges of our work was the
highly sparse context of the WiFi fingerprint tiles with
a majority of undetected, wireless access points. Con-
A Mobile Indoor Positioning System Founded on Convolutional Extraction of Learned WLAN Fingerprints
221
0
0.2
0.4
0.6
0.8
1
10 25 50 100 250
Normalized Running Time
Features
K-means Hard K-means Soft
(a) Number of features, K.
0
0.2
0.4
0.6
0.8
1
6 10 14 18
Normalized Running Time
Receptive Field Size
K-means Hard K-means Soft
(b) Receptive field size, w.
0
0.2
0.4
0.6
0.8
1
1 2 4 8
Normalized Running Time
Stride
K-means Hard K-means Soft
(c) Stride, s.
Figure 8: Normalized compute running time of feature learning. Shown for varying each of the model governing parameters,
(K, w, s), and respectively contrasting the hard with soft k-means activation functions.
sequently, some of the more ubiquitous and essential
intuitions that more centroids to learn and denser fea-
ture extraction benefit performance greatly, become
considerably unsubstantiated. While confirming that
more features and larger receptive field size conclude
in a relative benign performance gain, the most sur-
prising result of our work is the striking behavior of
ascending positional accuracy as the sampling of the
fingerprint tiles becomes coarser, by increasing the
stride parameter. This result may seem inexplicable
at first observation, but the larger stride is likely to
sample more unique RSSI values to avoid underfit-
ting, and hence the improved location identification.
Respectively, sparse sampling also merits a propor-
tional decline in system-level computational cost.
To the best of our knowledge, and based on lit-
erature published to date, we are unaware of indoor
positional systems with similar goals to evenhandedly
contrast our results against. The creators of the UJI-
IndoorLoc dataset (Torres-Sospedra et al., 2014) have
provided a basic reference implementation of an IPS
that employs a Euclidean distance based KNN classi-
fier with k = 1. The classifier operates on the origi-
nal unpacked WiFi fingerprints of 520 elements each,
drawn out directly from the database. Unlike our
system that commences by performing convolutional
feature extraction, and utilizes pooling to produce an
O(n/K) compact tile representation of much reduced
dimensionality that is used subsequently for classi-
fication. Assuming that performing CNN feature
learning is a rather infrequent event in our pipeline,
our classification phase is presumably more efficient
computationally, and furthermore it scales well to
large WiFi infrastructures of thousands of wireless ac-
cess points and tens of thousands fingerprint records.
For cross-validation, the reference implementation re-
ports a success rate of %89.9 for correctly identifying
a fingerprint location in a building-floor pairing. De-
spite our fairly rigorous pooling scheme, to predict an
identical positional target, we recorded a respectful
0.79 accuracy of floor-level location matching, for a
sparse tile sampling with a stride s = 8.
A direct progression of our work is to evolve our
positioning system to ultimately predict the finer, user
location components of longitude and latitude in con-
junction with the third dimension of the floor enumer-
ation in the target building. Similarly, we find a use-
ful value-add in extending our work to better under-
stand the implications of the user height and the mo-
bile device type on our overall, system performance
rate. Given the limited vocabulary of RSSI values,
exploring a bag of words (Baeza-Yates and Ribeiro-
Neto, 1999) format for a more compact fingerprint
representation, holds the prospect to ameliorate over-
all compute efficiency. We look forward to advance
our study and incorporate a more adaptive sampling
of the fingerprint tile data for feature extraction, rather
than using a uniform stride, and further improve our
system accuracy. Incorporating a more comprehen-
sive linear-SVM classifier, as an additional option to
our baseline KNN model that is exclusively trained
on a single parameter k, is pertinent to our work to
possibly enhance positional matching performance.
We hope that this work and others to follow, will
provide researchers a larger foundation for comparing
results of different learning algorithms that key off an
identical, indoor location dataset.
ACKNOWLEDGEMENTS
We would like to thank the anonymous reviewers for
their insightful suggestions and feedback.
REFERENCES
Baeza-Yates, R. and Ribeiro-Neto, B., editors (1999). Mod-
ern Information Retrieval. ACM Press Series/Addison
Wesley, Essex, UK.
ICPRAM 2016 - International Conference on Pattern Recognition Applications and Methods
222

Chen, M. Y., Sohn, T., Chmelev, D., Haehnel, D., High-
tower, J., Hughes, J., LaMarca, A., Potter, F., Smith,
I., and Varshavsky, A. (2006). Practical metropolitan-
scale positioning for GSM phones. In Ubiqui-
tous Computing (UbiComp), pages 225–242, Orange
County, CA.
Ching, W., Rue, J. T., Binghao, L., and Rizos, C. (2010).
Uniwide WiFi based positioning system. In Tech-
nology and Society (ISTAS), pages 180–189, Wollon-
gong, Australia.
Coates, A., Lee, H., and Ng, A. (2011). An analysis of
single-layer networks in unsupervised feature learn-
ing. In JMLR Artificial Intelligence and Statistics,
pages 215–223, Fort Lauderdale, FL.
Cormen, T. H., Leiserson, C. H., Rivest, R. L., and
Stein, C. (1990). Introduction to Algorithms. MIT
Press/McGraw-Hill Book Company, Cambridge, MA.
Duda, R. O., Hart, P. E., and Stork, D. G. (2001). Unsu-
pervised learning and clustering. In Pattern Classifi-
cation, pages 517–601. Wiley, New York, NY.
Ferris, B., Fox, D., and Lawrence, N. D. (2007). WiFi-
SLAM using gaussian process latent variable models.
In International Joint Conference on Artificial Intelli-
gence (IJCAI), pages 2480–2485, Hyderabad, India.
Jarrett, K., Kavukcuoglu, K., Ranzato, M., and LeCun, Y.
(2009). What is the best multi-stage architecture for
object recognition? In International Conference on
Computer Vision (ICCV), pages 2146–2153, Kyoto,
Japan.
Kaemarungsi, K. and Krishnamurthy, P. (2004). Model-
ing of indoor positioning systems based on location
fingerprinting. In IEEE Computer and Communica-
tion Societies (INFOCOM), pages 1012–1022, Hong
Kong.
Kaufman, L. and Rousseeuw, P. J., editors (1990). Finding
Groups in Data: An Introduction to Cluster Analysis.
Wiley, New York, NY.
Manning, C. D., Raghavan, P., and Schutze, H. (2008). In-
troduction to Information Retrieval. Cambridge Uni-
versity Press, Cambridge, United Kingdom.
Marques, N., Meneses, F., and Moreira, A. (2012). Combin-
ing similarity functions and majority rules for multi-
building, multi-floor, WiFi positioning. In Indoor Po-
sitioning and Indoor Navigation (IPIN), pages 1–9,
Sydney, Australia.
Nowak, E., Jurie, F., and Triggs, B. (2006). Sampling strate-
gies for bag-of-features image classification. In Euro-
pean Conference on Computer Vision (ECCV), pages
490–503, Graz, Austria.
R (1997). R project for statistical computing. http://www.r-
project.org/.
Rajaraman, R. and Ullman, J. D. (2011). Mining of Massive
Datasets. Cambridge University Press, New York,
NY.
Ruoxi, J., Ming, J., and Costas, J. S. (2014). Sound-
Loc: Acoustic method for indoor localization with-
out infrastructure. Computing Research Reposi-
tory, Human-Computer Interaction, arXiv:1407.4409.
http://arxiv.org/abs/1407.4409.
Salton, G., Wong, A., and Yang, C. S. (1975). A vector
space model for automatic indexing. Communications
of the ACM, 18(11):613–620.
Torres-Sospedra, J., Montoliu, R., Martinez-Uso, A., Ar-
nau, T. J., Avariento, J. P., Benedito-Bordonau, M.,
and Huerta, J. (2014). UJIIndoorLoc: A new
multi-building and multi-floor database for WLAN
fingerprint-based indoor localization problems. In In-
door Positioning and Indoor Navigation (IPIN), Bu-
san, Korea.
UCI (2014). Machine learning repos-
itory - UJIIndoorLoc data set.
http://archive.ics.uci.edu/ml/datasets/UJIIndoorLoc.
Woo, S., Jeong, S., Mok, E., Xia, L., Choi, C., Pyeon, M.,
and Heo, J. (2011). Application of WiFi-based indoor
positioning system for labor tracking at construction
sites: A case study in Guangzhou MTR. Automation
in Construction, 20(1):3–13.
Zhou, J. and Shi, J. (2009). RFID localization algorithms
and application: a review. Journal of Intelligent Man-
ufacturing, 20(6):695–707.
A Mobile Indoor Positioning System Founded on Convolutional Extraction of Learned WLAN Fingerprints
223
