
Gaining Insight from Physical Activity Data using a Similarity-based
Interactive Visualization
Arkaitz Artetxe, Gorka Epelde, Andoni Beristain, Ane Murua and Roberto Álvarez
eHealth & Biomedical Applications, Vicomtech-IK4, Donostia, San Sebastian, Spain
Keywords: Personal Visualization, Personal Visual Analytics, Visualization Insights, Personal INFOVIS, Personal
Informatics, Data Clustering, Time-series Data, Periodic Events, Physical Activity, Quantified-Self,
Lifelogging.
Abstract: This paper presents a new interactive visualization approach which aims to help and support the user in
gaining insight over his physical activity data. The main novelty of the proposed visualization approach is the
representation of similarities in the physical activity patterns in time using data clustering techniques, in
addition to the continuous physical activity representation over a circular chart. This grouping of similar
activity patterns helps identifying meaningful events or behaviors, combined with the periodicity highlighting
circular charts. The user is able to interact with the visualization during the knowledge discovery process by
changing the represented time-scale, time-frame and the number of clusters used for the user’s physical
activity pattern categorization. Additionally, the proposed visualization approach allows to easily report and
store the insights gained during the visual data analysis process, by adding a textual description linked to the
particular user tailored visualization configuration which led to that insight.
1 INTRODUCTION
Individuals have tracked their personal data
historically with the objective to measure and
improve specific behaviors (e.g. health, economy,
sport performance) (Marcengo and Rapp, 2013).
Traditionally, this personal data tracking has been
carried out manually, or at most, with the support of
basic informatics tool (e.g. spreadsheets) for storage
and visualization purposes.
In recent years, the advances in self-monitoring
technology, the availability of low cost and
unobtrusive monitoring sensors (implemented in
Smartphones or wearable devices), and the
widespread adoption of the Smartphone and
development of self-monitoring Smartphone Apps
have led to a growth of the people engaged into the
self-quantification through personal informatics
movement (i.e. lifelogging or quantified-self). The
research being carried out by quantified-self early
adopters is of particular interest in the context of
empowering people in the self-management of their
health.
Personal physical activity is usually quantified as
1
https://www.fitbit.com
energy expenditure (e.g. calories), or distance
covered (e.g. step count). Those measures are
obtained from different kinds of sensors, being the
current trend to use the smartphone built-in sensors
and commercial wearable devices (e.g. Fitbit
1
or Mi
Band
2
) either separately or in combination.
Self-quantifiers draw meaningful inferences and
realize causality through the collection and analysis
of their personal data, following a self-reflection
process (Huang et al., 2014). Self-reflection is
achieved through the analysis of personal data using
data visualization tools. However many Quantified-
Selfers, are not visualization experts or data scientists
(Choe et al., 2015).
The contribution of this publication is the
proposal of an interactive visualization method which
complements traditional chart visualizations with the
automatic categorization of physical activity data
patterns using clustering techniques. This interactive
visualization method aims to assist individuals in
their self-reflection process, by depicting visual cues
to spot similar patterns, complemented with a data
representation spatial layout which fosters periodic
pattern identification.
2
http://www.mi.com/in/miband/
Artetxe, A., Epelde, G., Beristain, A., Murua, A. and Álvarez, R.
Gaining Insight from Physical Activity Data using a Similarity-based Interactive Visualization.
DOI: 10.5220/0005675701150122
In Proceedings of the 11th Joint Conference on Computer Vision, Imaging and Computer Graphics Theory and Applications (VISIGRAPP 2016) - Volume 2: IVAPP, pages 117-124
ISBN: 978-989-758-175-5
Copyright
c
2016 by SCITEPRESS – Science and Technology Publications, Lda. All rights reserved
117

In this paper, we first analyze the related work in
the field of self-tracked physical activity visualization
(Section 2). Section 3 presents our contributions, i.e.,
an approach for similarity based interactive
visualization of self-tracked physical activity. In
Section 4 we summarize the paper and present our
conclusions.
2 RELATED WORK
Huang et al. (Huang et al., 2014) define and classify
Personal Visualization (PV) as an interactive visual
data representation process for the personal context,
and Personal Visual Analytics (PVA), as
visualization that involves the computer assisted
analysis. Following this classification, in the first
subsection we will first analyze the evolution of the
personal visualization techniques considering the
scope of personal data. Next, in a second subsection,
PVA approaches, which integrate the computer
assisted analysis with the visualization of the self-
quantified data will be analyzed. The aim of the
computer assisted analysis is to facilitate the self-
reflection process and the identification of insights by
the user.
2.1 Personal Visualization Techniques
In the prior works in the field, various approaches
have been proposed for the visualization of self-
quantified data, ranging from traditional statistical
graphics, to representations in the form of abstract art.
Although proposals of new visualization paradigms
as informative art (Fan et al., 2012), living metaphors
(Consolvo et al., 2009; Khot et al., 2015; Lin et al.,
2006) or ambient display (Jafarinaimi et al., 2005;
Rogers et al., 2010) have been defined, most of the
tools for physical activity monitoring visualization at
the consumer user level (e.g. Endomondo,
MapMyFitness, ) still use charts (e.g. line, bar,
diagram scatter, pie charts) and most-self-quantifiers
use charts to represent and display their physical
activity (Choe et al., 2015).
Recently, new approaches to visualize self-
quantified data have emerged. A recent work (Larsen
et al., 2013), presents a visualization technique for
time series data in the form of a spiral structure
visualization. This visualization technique aims to
assist the user in identifying repeating patterns in self-
quantified data, such as geographical location or
physical activity.
The spiral-based representation is good at
discovering recurrent patterns over a period of time.
The spiral visualization represents events with similar
period aligned along similar angles of the arcs,
resulting in aligned sections of the spiral (Carlis and
Konstan, 1998; Weber et al., 2001).
A spiral is formed by a continuous line
representing the time, so that “time’s continuity”
concept is clearly represented. However, the
represented time unit (i.e. hours, days, weeks etc.) is
not always clearly identified. Say we have a
visualization formed by a spiral of Archimedes that
shows seven segments (representing days) per each
rotation of 360 degrees. The primary time unit -a day-
is obvious and easy to identify, nevertheless the
secondary time unit –a week- is not so obvious and its
boundaries are not always clear.
Our approach is based on circular maps. Spiral-
based visualization and circular visualizations are
similar in many ways, but the latter is unique in that
each ring represents a temporary unit. This concept is
similar to tree rings, where every ring represents a
year. The rings closer to the center are the oldest and
the external ones the newest. In addition, display can
also be seen as an analog clock, in which the clock
hands can have different number of positions
depending on the time scale. For a week scale, the
clock hands have 7 steps, one per day of the week.
For a day scale the hands may have 24 steps, one per
hour. And given position, all the rings crossed by the
clock hand correspond to the same step/phase in the
time scale (e.g. day of the week), that is, they are
visually aligned permitting a clear comparison.
2.2 Personal Visualization Analytics
Techniques
In the context of large data set exploration, it is
generally a difficult task to recognize patterns or
trends, even if a good visualization is provided.
Furthermore, regarding personal data visualization
and the tools available for that purpose, people may
not dedicate much effort exploring the possibilities
provided by those tools and may not have the skills or
experience required to identify such patterns.
In the non-personal context, computer algorithms
have been applied to visual analysis applications
successfully (Gotz et al., 2014; Van Wijk and Van
Selow, 1999). Here, Wijk et al. (Van Wijk and Van
Selow, 1999) presented a job that uses a combination
calendar and chart visualization combined with
clustering techniques to facilitate the identification of
patterns and trends in multivariate time series.
On a personal context, the use of computer
algorithms to recognize patterns and trends can help
users gaining insights into their behaviours and
IVAPP 2016 - International Conference on Information Visualization Theory and Applications
118

reducing the attention required to explore personal
visualizations.
In the research works (Froehlich et al., 2009,
2012; McDuff et al., 2012) the authors apply
clustering techniques to PV. Froehlich et al. applied
computer-based classification to improve the
visualization of transportation usage (Froehlich et al.,
2009) and water consumption (Froehlich et al., 2012).
In the same way, Mcduff et al. (McDuff et al., 2012)
use a classification scheme to predict the emotional
state of the user and provide a user interface to capture
the user reflection.
Some other authors have investigated the use of
computer algorithms to optimize the design of
personal visualizations (Douma et al., 2009; Shen and
Ma, 2008). Douma et al., (2009) use computer
algorithms to maintain the design of integrated radial
tree structure (involving graph structures) with
balanced layout visualization. The development
presented in (Shen and Ma, 2008) supports the
temporal and semantic filtering through a time chart
diagram and an interactive ontology. The aim of this
development is to isolate subsets of data, for a
detailed analysis.
Another usage of computer algorithms in PVA
that has been identified is on texts analysis for
visualization (Dork et al., 2010; Marcus et al., 2011).
In the research of (Marcus et al., 2011),
computational algorithms are applied to text analysis
to automatically find peaks and high activity of
tweets, and to significantly label them using text from
the tweets themselves. Similarly, (Dork et al., 2010)
use text processing in the context of the evolution of
a conversation to visually represent what just
happened and what is happening now.
Other uses for computer algorithms in PVA
include the reduction of the data dimensions to allow
users to visualize and navigate through them
(Faridani et al., 2010; Preuveneers and Berbers,
2008). (Faridani et al., 2010) applied this approach to
navigation through online comments and
(Preuveneers and Berbers, 2008) did the same for the
recognition of health states, to help users with
diabetes, to take informed decisions about the daily
dose, to achieve and sustain adequate levels of
glucose in blood.
Finally, the last identified computer algorithms
usage in PVA are data-mining techniques.
Khovanskaya et al. used data-mining techniques to
identify patterns in the personal context
(Khovanskaya et al., 2013).
3
http://d3js.org/
4
https://code.google.com/p/figue/
5
http://getbootstrap.com/
Grouping different data samples by similarity
often facilitates the insight gaining process. This is
why clustering techniques have been applied in the
field of visual analytics as a way to emphasize
differences and similarities between events or
sequence of events (Van Wijk and Van Selow, 1999).
In Wijk et al.’s work energy expenditure data is
clustered in order to find similar day patterns along a
year. Each cluster, -representing a day pattern- is
assigned a color and, within the calendar, each day is
painted with its corresponding cluster’s color.
Our approach takes from (Van Wijk and Van
Selow, 1999) the idea of grouping time series
according to their similarity and identifying samples
as members of the cluster they belong to, using colors.
However, instead of using a hierarchical clustering
algorithm as in (Van Wijk and Van Selow, 1999), our
approach uses centroid-based clustering techniques.
In addition, we have introduced the circular chart
visualization instead of a calendar, thus providing
better PVA capabilities.
3 MATERIAL AND METHODS
An interactive web-based user interface has been
implemented enabling users to visually explore and
analyze their own physical activity data.
We have used d3.js
3
as the primary chart
generating tool of our interactive user interface. We
have selected and combined some different
visualizations such as circular chart, pie chart and
multi-series line chart.
For the implementation of the unsupervised
classification part we have utilized a clustering
algorithm collection called figue
4
, since it provides a
JavaScript implementation of algorithms such as k-
means and fuzzy c-means amongst others.
Interactive web user interfaces have been built on
top of Bootstrap
5
framework and jQueryUI
6
library.
Those technologies allow following a responsive web
design approach, thus providing an optimal viewing
and interaction experience across different devices
(e.g. smartphones, tablets, laptops).
3.1 Activity Data
Although our work is generalizable to virtually any
kind of univariate interval time series data, this work
focuses on the analysis of physical activity data. To
demonstrate the capabilities of our visualization tool,
6
https://jqueryui.com/
Gaining Insight from Physical Activity Data using a Similarity-based Interactive Visualization
119

we have built a dataset using raw physical activity
data acquired continuously from Mi Band
7
devices.
We have collected the raw data samples recorded by
5 different devices during a period of 4 months (over
170000 samples per person). The obtained raw data is
composed of a per-minute measure of the following
data:
Timestamp
Number of steps
Activity (Sleep, Idle, Run, Walk)
Walk Distance
Run Distance
Walk Calories
Run Calories
Collected raw data has been processed in order to do
aggregations of different granularity.
3.2 Clustering
Our ultimate goal is to group similar day activity
patterns together, in order to show which group
belongs each day. We also aim to show the shape of
the average day of each cluster. For that purpose, we
use machine learning based clustering techniques.
To apply cluster analysis techniques we divide our
time series data into a collection of n elements, each
representing a day,
,…,
(1)
An element consists of a sequence of m elements,
,…,
(2)
Where y
i
denotes the value of the single activity
feature selected by the user (i.e. number of steps,
caloric expenditure, run/walk distance). Depending
on the time scale selected by the user, m can be either
1440 (per minute values) or 24 (per hour aggregation.
This value along with period of time (i.e. start and
ending dates), the clustering algorithm to be applied
and the number of clusters (k value) can be specified
by the user.
In this work we have used the well-known Fuzzy
c-means (Bezdek et al. , 1984) algorithm as well as
the widely used k-means algorithm, although other
clustering algorithms may be used.
In fuzzy clustering –unlike hard clustering
algorithms such as k-means- there is not a sharp
classification of data elements into non overlapping
groups. Instead, for every data sample the probability
of belonging to each cluster is provided.
Thus, after applying the algorithm, we obtain not
7
http://www.mi.com/in/miband/
only a list of c centroids,
,…,
(3)
But also a membership matrix,
,
∈
0,1
,1,…,,
1,…,
(4)
Where w
i,j
is a value between 0 and 1 which
represents the degree to which the element x
i
belongs
to cluster c
j
.
3.3 Similarity based Interactive
Visualization
During the clustering process we obtain a collection
of cluster centroids, which characterize each cluster
and can be regarded as the average of each day’s
activity pattern. We also get a membership matrix
where it is specified which cluster belongs each day.
Finding a proper way of displaying this information
could be a challenge.
As seen in
Figur, we have designed a web-based
user interface layout composed of 4 main elements,
namely a) parameter selector area, b) day pattern and
centroid area, c) circular map area and d) annotation
area.
In the parameter selector area users can select the
time range by specifying the starting and ending dates
in a calendar. Users may also select which activity
indicator should be used for the calculations. Choices
are: i) run caloric expenditure, ii) walk caloric
expenditure, iii) sum of run and walk caloric
expenditure, iv) walk distance, v) run distance, vi)
sum of walk and run distances and vii) number of
steps. The time scale can also be specified in minutes
or hours, along with the number of clusters for the
categorization.
Last but not least, users can select whether to
apply fuzziness or not. If fuzziness is set to false a
standard k-means algorithm is used, otherwise fuzzy
c-means algorithm is used and some additional
functionalities are available within the resulting
visualization (e.g. a pie chart showing the cluster-
membership distribution is shown when the cursor is
passed over a day).
Once the user has selected the values mentioned
above, data is processed and a clustering process is
triggered.
The patterns of resulting clusters are visualized in
a typical line chart, where a color is assigned to each
of them, as seen in Figure 1-b.
Days are represented using a circle chart and the
color assigned the cluster they belong to. When the
fuzzy c-means algorithm is utilized, the cluster with
IVAPP 2016 - International Conference on Information Visualization Theory and Applications
120
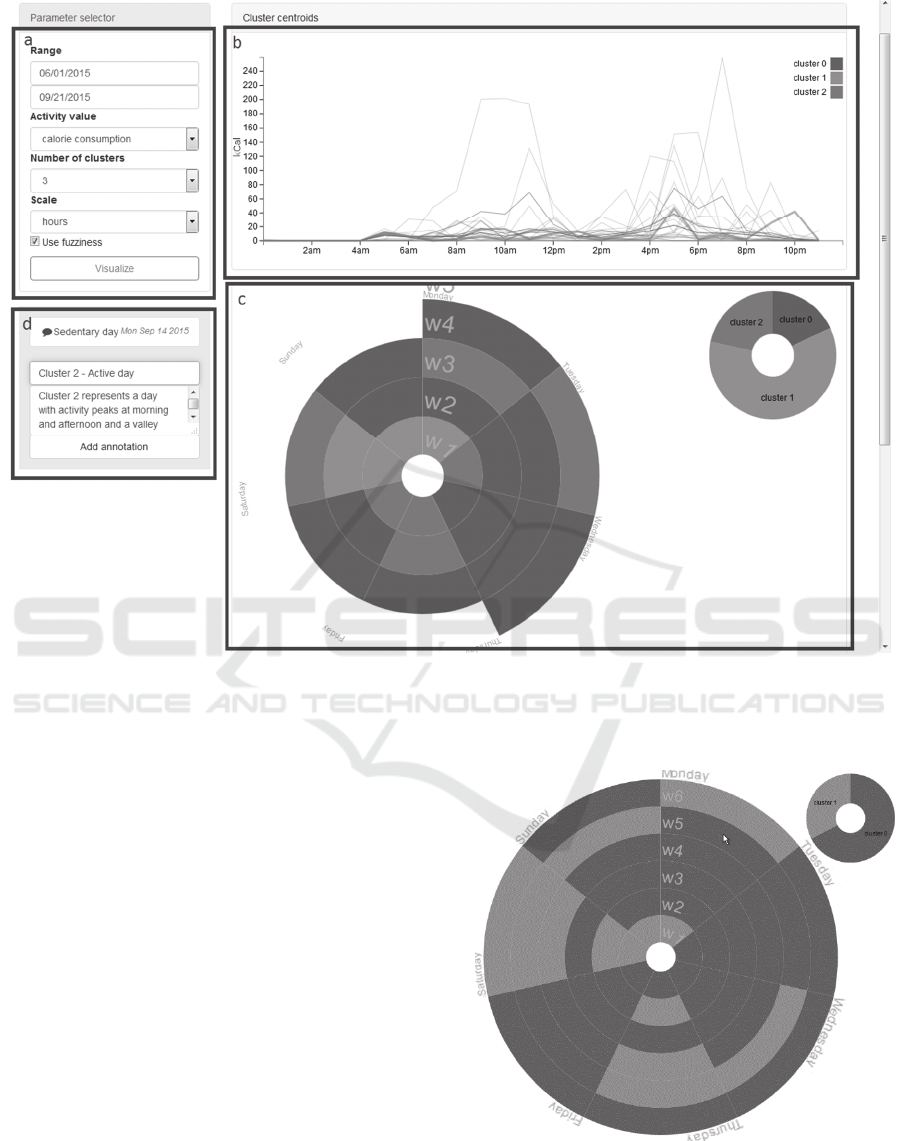
Figure 1: Web-based interactive visualization. a) Parameter selector area. b) View of the line chart showing day patterns (gray
lines) and cluster centroids colored according to the legend. c) The user has placed the mouse over a certain cell of the circle
chart, thus the pattern of that day is highlighted in the multi-series line chart (red line in the upper chart). Simultaneously a
pie chart shows the membership distribution of the selected day. d) Insight annotation area.
the highest w value is selected for each day i,
max
,
,…,
,
(5)
Although the color assigned for each day
corresponds to the c
max
value, we consider that the
distribution of the cluster-belonging degrees provides
valuable information that can enhance the exploration
process. Hence, when the user selects a day by
placing the mouse over a certain segment of the circle
chart, a pie chart showing the cluster membership
distribution for that particular day is shown in the
upper right part of the canvas (see Figure 2). In
addition, the activity pattern of that day is highlighted
in the line chart. This makes it easy to compare a
given day’s activity pattern with its corresponding
cluster’s pattern.
The user can also have a detailed visualization of
a particular day by clicking the corresponding
segment of the circle chart.
Then, a new circular map is shown, where each
segment represents the value of the selected parame-
Figure 2: Visualization of 6-week caloric expenditure data.
It can be seen that Saturdays (and Thursdays to some
extent) are more likely to belong to cluster 1. This cluster
groups days with higher activity levels in the afternoon.
Gaining Insight from Physical Activity Data using a Similarity-based Interactive Visualization
121

ter of one minute (see Figure 3). The darker the color
of the segment is, the greater the value (e.g. caloric
expenditure) of that minute. Each ring represents a
day, where the selected day is placed in the middle,
surrounded by the three previous and next three days.
This visualization aims to show the activity patterns
in a more detailed way, as well as to better detect
repeating patterns among days. Figure 3 depicts the
circle heat chart showing the caloric expenditure
patterns of a user during one week.
Finally, the user interface provides a simple yet
useful tool for insight annotation. Users can annotate
the discovered insights by inserting a title and a
description. This self-reflection insight reporting
functionality was added following (Choe et al., 2015)
findings and their recommendation to support easy
capture of self-reflection insights against specific
elements of a dataset that may be associated with the
insight, and access them both for exploration and for
presentation purposes. Saved annotations are linked
to the user-selected parameters, so that the associated
visualization can be easily accessed in the future.
Figure 3: View of the circular heat chart. Each ring
represents a day and is composed of 1440 cells (one per
minute of a day) colored according to the calories
expended.
4 CONCLUSIONS AND FUTURE
WORK
We have presented a novel combination of well-
established automated data analysis and visualization
techniques which permits the user to interactively
identify similarities in time-oriented data. This
approach has been implemented in the practical
scenario of physical activity pattern visualization.
The proposed visualization method is based on
spatially arranging activity data in a given time period
scale (e.g. day, week), automatically categorizing
days into groups based on their activity pattern
similarity and depicting similar activity days with the
same visual representation. Thanks to this visual
highlighting, repeating patterns can be easily spotted
by the user. Moreover, combining this highlighting
with the periodic arrangement of data that circular
maps provide, periodic patterns can be easily
recognized in different time scales (e.g. week or
month). Both techniques are complementary in the
sense that circular maps themselves don’t permit a
quick way to present similar items with the same
visual representation, where each day’s data cannot
be summarized as a ordinal value, and on the other
hand grouping days based on multiple features (and
visually representing this categorization), without a
proper spatial arrangement, doesn’t permit an easy
way to identify periodic patterns. Our approach takes
advantage of the benefits of both visualization
techniques, while avoiding their drawbacks.
Nevertheless, the authors are aware of at least a
couple of limitations of this method: first, the day
clustering technique is currently almost completely
automatic, only the number of groups can be selected
by the user, therefore lacking a fine tuning possibility
for the visualization, considering for example
different day similarity metrics. And second, the
circular map is quite static, that is, information can
only be arranged at daily and weekly time periods.
Additionally, due to the characteristics of circular
maps, older information has less visual impact, which
for some scenarios might be useful, but not always.
Finally, this visualization method follows a top
down interaction model, with an initial overview
visualization combined with a following focused
visualization for more in detail data review.
This visualization method closes the interaction
loop by including the possibility to report insights and
to link them to the visualization configuration which
led to each of them.
We have performed some initial tests on a group
of 5 volunteer subjects for a period of 4 months,
regarding the usability of different visualization
options and the insights provided by them. The
subjects have shown interest in continuing with the
self-monitoring and visual analysis process, as they
perceive it as a quick yet useful tool to quantify their
progress as well as to correct harmful behaviors.
Future work will include the validation of
approach from the user interaction perspective, the
IVAPP 2016 - International Conference on Information Visualization Theory and Applications
122

use of the clustering results to adapt the initial
overview visualization and the exploration of
hierarchical clustering methods, and alternatives such
as latent class analysis (LCA).
ACKNOWLEDGEMENTS
This work was partially funded by the Basque
Government ETORTEK 2012 Program
(ELDERBASK). The opinions herein are those of the
authors and not necessarily those of the funding
agencies.
REFERENCES
Bezdek, J. C., Ehrlich, R., & Full, W. (1984). FCM: The
fuzzy c-means clustering algorithm. Computers &
Geosciences, 10(2), 191–203. http://doi.org/
10.1016/0098-3004(84)90020-7.
Carlis, J. V., & Konstan, J. A. (1998). Interactive
Visualization of Serial Periodic Data. In Proceedings of
the 11th Annual ACM Symposium on User Interface
Software and Technology (pp. 29–38). New York, NY,
USA: ACM. http://doi.org/10.1145/288392.288399.
Choe, E., Lee, B., & Schraefel, M. (2015). Revealing
Visualization Insights from Quantified-Selfers’
Personal Data Presentations. IEEE Computer Graphics
and Applications, PP(99), 1–1. http://doi.org/10.1109/
MCG.2015.51.
Consolvo, S., McDonald, D. W., & Landay, J. A. (2009).
Theory-driven Design Strategies for Technologies That
Support Behavior Change in Everyday Life. In
Proceedings of the SIGCHI Conference on Human
Factors in Computing Systems (pp. 405–414). New
York, NY, USA: ACM. http://doi.org/
10.1145/1518701.1518766.
Dork, M., Gruen, D., Williamson, C., & Carpendale, S.
(2010). A Visual Backchannel for Large-Scale Events.
IEEE Transactions on Visualization and Computer
Graphics, 16(6), 1129–1138. http://doi.org/
10.1109/TVCG.2010.129.
Douma, M., Ligierko, G., Ancuta, O., Gritsai, P., & Liu, S.
(2009). SpicyNodes: Radial Layout Authoring for the
General Public. IEEE Transactions on Visualization
and Computer Graphics, 15(6), 1089–1096.
http://doi.org/10.1109/TVCG.2009.183.
Fan, C., Forlizzi, J., & Dey, A. K. (2012). A Spark of
Activity: Exploring Informative Art As Visualization
for Physical Activity. In Proceedings of the 2012 ACM
Conference on Ubiquitous Computing (pp. 81–84).
New York, NY, USA: ACM. http://doi.org/
10.1145/2370216.2370229
Faridani, S., Bitton, E., Ryokai, K., & Goldberg, K. (2010).
Opinion Space: A Scalable Tool for Browsing Online
Comments. In Proceedings of the SIGCHI Conference
on Human Factors in Computing Systems (pp. 1175–
1184). New York, NY, USA: ACM.
http://doi.org/10.1145/1753326.1753502.
Froehlich, J., Dillahunt, T., Klasnja, P., Mankoff, J.,
Consolvo, S., Harrison, B., & Landay, J. A. (2009).
UbiGreen: Investigating a Mobile Tool for Tracking
and Supporting Green Transportation Habits. In
Proceedings of the SIGCHI Conference on Human
Factors in Computing Systems (pp. 1043–1052). New
York, NY, USA: ACM. http://doi.org/
10.1145/1518701.1518861.
Froehlich, J., Findlater, L., Ostergren, M., Ramanathan, S.,
Peterson, J., Wragg, I., … Landay, J. A. (2012). The
Design and Evaluation of Prototype Eco-feedback
Displays for Fixture-level Water Usage Data. In
Proceedings of the SIGCHI Conference on Human
Factors in Computing Systems (pp. 2367–2376). New
York, NY, USA: ACM. http://doi.org/
10.1145/2207676.2208397.
Gotz, D., Wang, F., & Perer, A. (2014). A methodology for
interactive mining and visual analysis of clinical event
patterns using electronic health record data. Journal of
Biomedical Informatics, 48, 148–159.
http://doi.org/10.1016/j.jbi.2014.01.007.
Huang, D., Tory, M., Aseniero, B., Bartram, L., Bateman,
S., Carpendale, S., … Woodbury, R. (2014). Personal
Visualization and Personal Visual Analytics.
IEEE
Transactions on Visualization and Computer Graphics,
Early Access Online. http://doi.org/10.1109/
TVCG.2014.2359887.
Jafarinaimi, N., Forlizzi, J., Hurst, A., & Zimmerman, J.
(2005). Breakaway: An Ambient Display Designed to
Change Human Behavior. In CHI ’05 Extended
Abstracts on Human Factors in Computing Systems
(pp. 1945–1948). New York, NY, USA: ACM.
http://doi.org/10.1145/1056808.1057063.
Khot, R. A., Pennings, R., & Mueller, F.. “Floyd.” (2015).
EdiPulse: Supporting Physical Activity with Chocolate
Printed Messages. In Proceedings of the 33rd Annual
ACM Conference Extended Abstracts on Human
Factors in Computing Systems (pp. 1391–1396). New
York, NY, USA: ACM.
http://doi.org/10.1145/2702613.2732761.
Khovanskaya, V., Baumer, E. P. S., Cosley, D., Voida, S.,
& Gay, G. (2013). “Everybody Knows What You’Re
Doing”: A Critical Design Approach to Personal
Informatics. In Proceedings of the SIGCHI Conference
on Human Factors in Computing Systems (pp. 3403–
3412). New York, NY, USA: ACM.
http://doi.org/10.1145/2470654.2466467.
Larsen, J. E., Cuttone, A., & Jørgensen, S. L. (2013). QS
Spiral: Visualizing Periodic Quantified Self Data. In
Proceedings of CHI 2013 Workshop on Personal
Informatics in the Wild: Hacking Habits for Health
& Happiness. Retrieved from http://orbit.dtu.dk/
fedora/objects/orbit:127504/datastreams/file_d58b9d7
9-608a-46b5-8bde-f250a1d0adcd/content.
Lin, J. J., Mamykina, L., Lindtner, S., Delajoux, G., &
Strub, H. B. (2006). Fish’n’Steps: Encouraging
Physical Activity with an Interactive Computer Game.
Gaining Insight from Physical Activity Data using a Similarity-based Interactive Visualization
123

In P. Dourish & A. Friday (Eds.), UbiComp 2006:
Ubiquitous Computing (pp. 261–278). Springer Berlin
Heidelberg. Retrieved from http://link.springer.com/
chapter/10.1007/11853565_16.
Marcengo, A., & Rapp, A. (2013). Visualization of Human
Behavior Data: The Quantified Self. In Huang, L.H. &
Huang, W. (Eds.), Inovative Approaches of Data
Visualization and Visual Analytics (pp. 236–265). IGI
Global, Hershey.
Marcus, A., Bernstein, M. S., Badar, O., Karger, D. R.,
Madden, S., & Miller, R. C. (2011). Twitinfo:
Aggregating and Visualizing Microblogs for Event
Exploration. In Proceedings of the SIGCHI Conference
on Human Factors in Computing Systems (pp. 227–
236). New York, NY, USA: ACM.
http://doi.org/10.1145/1978942.1978975.
McDuff, D., Karlson, A., Kapoor, A., Roseway, A., &
Czerwinski, M. (2012). AffectAura: An Intelligent
System for Emotional Memory. In Proceedings of the
SIGCHI Conference on Human Factors in Computing
Systems (pp. 849–858). New York, NY, USA: ACM.
http://doi.org/10.1145/2207676.2208525.
Preuveneers, D., & Berbers, Y. (2008). Mobile Phones
Assisting with Health Self-care: A Diabetes Case
Study. In Proceedings of the 10th International
Conference on Human Computer Interaction with
Mobile Devices and Services (pp. 177–186). New York,
NY, USA: ACM. http://doi.org/10.1145/
1409240.1409260.
Rogers, Y., Hazlewood, W. R., Marshall, P., Dalton, N., &
Hertrich, S. (2010). Ambient Influence: Can Twinkly
Lights Lure and Abstract Representations Trigger
Behavioral Change? In Proceedings of the 12th ACM
International Conference on Ubiquitous Computing
(pp. 261–270). New York, NY, USA: ACM.
http://doi.org/10.1145/1864349.1864372.
Shen, Z., & Ma, K.-L. (2008). MobiVis: A Visualization
System for Exploring Mobile Data. In Visualization
Symposium, 2008. PacificVIS ’08. IEEE Pacific (pp.
175–182).
http://doi.org/10.1109/PACIFICVIS.2008.4475474.
Van Wijk, J. J., & Van Selow, E. R. (1999). Cluster and
Calendar Based Visualization of Time Series Data. In
Proceedings of the 1999 IEEE Symposium on
Information Visualization (p. 4–). Washington, DC,
USA: IEEE Computer Society. Retrieved from
http://dl.acm.org/citation.cfm?id=857189.857665.
Weber, M., Alexa, M., & Muller, W. (2001). Visualizing
time-series on spirals. In IEEE Symposium on
Information Visualization, 2001. INFOVIS 2001 (pp. 7–
13). http://doi.org/10.1109/INFVIS.2001.963273.
IVAPP 2016 - International Conference on Information Visualization Theory and Applications
124
