
Visual Analytics for Narrative Text
Visualizing Characters and their Relationships as Extracted from Novels
Markus John, Steffen Lohmann, Steffen Koch, Michael W
¨
orner and Thomas Ertl
Institute for Visualization and Interactive Systems, University of Stuttgart, Universit
¨
atsstraße 38, Stuttgart, Germany
Keywords:
Text Visualization, Visual Text Analytics, Digital Humanities, Distant Reading.
Abstract:
The study of novels and the analysis of their plot, characters and other entities are time-consuming and com-
plex tasks in literary science. The digitization of literature and the proliferation of electronic books provide
new opportunities to support these tasks with visual abstractions. Methods from the fields of computational lin-
guistics can be used to automatically extract entities and their relations from digitized novels, which can then
be visualized to ease exploration and analysis tasks. This paper presents a web-based approach that combines
automatic analysis methods with effective visualization techniques. Different views on the extracted entities
are provided and relations between them across the plot are indicated. Two usage scenarios show successful
applications of the approach and demonstrate its benefits and limitations.
1 INTRODUCTION
Common tasks in literary science are studying novels
and analyzing their plot, characters and other entities.
Literary scholars are interested in getting an overview
of the plot and its characters, the relationships be-
tween them and their evolution during the plot (Phe-
lan, 1989). The digitization of literature and the pro-
liferation of electronic books (ebooks) provide new
means to support these tasks with visual abstractions
that are automatically generated from ebooks.
Traditionally, literary scholars read and analyze
novels in a sequential way by using so-called close
reading. In contrast to this, Moretti introduced the
idea of distant reading (Moretti, 2005). Instead of
carefully reading and analyzing a literary work, dis-
tant reading abstracts the text by providing visualiza-
tions such as graphs that depict the genre change of
historical novels, maps to represent geographical as-
pects of the plot, or trees to classify various types of
detective stories (J
¨
anicke et al., 2015). These visual
abstractions can convey useful information and as-
sist in exploring and understanding complex relation-
ships, verifying hypotheses as well as forming new
research ideas.
In order to provide visual abstractions for lit-
erary works, a combination of automatic methods
and interactive visualization techniques is required.
When dealing with ebooks, natural language process-
ing methods are the first choice for automatic analy-
sis. Using these methods, entities such as characters
and places can be extracted from the ebooks. This en-
ables the development of visual abstractions that al-
low to explore these entities and their relationships in
more detail. In particular, a large interest has grown in
web-based systems for literature analysis that are easy
to use and do not require any skills in computational
linguistics (Plaisant et al., 2006).
This paper presents a web-based approach that
aims to provide literary scholars with visual abstrac-
tions to facilitate character analysis in novels. It uti-
lizes automatic named entity extraction and visualizes
relationships between characters and places based on
co-occurrence analyses. The basic idea of the ap-
proach is to highlight patterns, such as specific char-
acters and places or groups of characters that interact
with each other at certain places over time. By offer-
ing several views, such patterns are made easily rec-
ognizable with our approach and provide the starting
point for a deeper analysis. This can result in a better
understanding of the plot, in particular related to the
characters and their relationships.
The main contributions of this work are: 1) A web-
based approach that offers a wide range of interac-
tive features to facilitate character analysis in nov-
els. 2) Several interrelated visual abstractions that en-
able the interactive switching to the corresponding
text sources in the document.
The rest of the paper is structured as follows: Sec-
tion 2 summarizes related work before our approach
John, M., Lohmann, S., Koch, S., Wörner, M. and Ertl, T.
Visual Analytics for Narrative Text - Visualizing Characters and their Relationships as Extracted from Novels.
DOI: 10.5220/0005669800270038
In Proceedings of the 11th Joint Conference on Computer Vision, Imaging and Computer Graphics Theory and Applications (VISIGRAPP 2016) - Volume 2: IVAPP, pages 29-40
ISBN: 978-989-758-175-5
Copyright
c
2016 by SCITEPRESS – Science and Technology Publications, Lda. All rights reserved
29

is detailed in Section 3. This is followed by two use
cases demonstrating the applicability and usefulness
of the approach in Section 4. Section 5 provides a dis-
cussion of the approach and Section 6 concludes the
paper with a summary and outlook on future work.
2 RELATED WORK
Since our approach is concerned with the visual ab-
straction of text, we first summarize existing work in
this area. Next, we report on visual analytics attempts
in the field of literary science and review the systems
that are most closely related to our approach.
2.1 Visual Text Abstraction
Several techniques for visually abstracting and sum-
marizing text documents have been developed over
the last years. One compact visualization method
related to our approach is literature fingerprinting
(Keim and Oelke, 2007), which uses a pixel-based
technique that represents each text unit as a single
pixel and visually groups them into higher level units.
A related technique is used in Seesoft (Eick et al.,
1992), which has been designed as a visual finger-
print summarization of source code to graphically
represent software statistics. The intention of Tilebars
(Hearst, 1995) is the visual representation of search
results similar to the fingerprint idea, while Feature-
Lens (Don et al., 2007) also uses a pixel-based at-
tempt to explore interesting text patterns and to find
co-occurrences in texts.
Another popular technique to visually summa-
rize text are word clouds (Vi
´
egas and Wattenberg,
2008; Clement et al., 2009). They usually depict the
most frequently used words of a text with the font
size scaled according to the word frequencies. Word
clouds enable literature scholars to get a first impres-
sion of the main terms and topics of a text (Heimerl
et al., 2014).
To visualize relational information of a text doc-
ument, approaches such as WordTrees (Wattenberg
and Viegas, 2008) and PhraseNets (Van Ham et al.,
2009) were suggested. They depict either syntactic,
lexical or hierarchical relationships that exist between
the words of a text as node-link diagrams. In contrast,
(Oelke et al., 2013) use an adjacency matrix to encode
the development of relations between entities across a
text document.
Inspired by Munroe’s hand-drawn illustration
“Movie Narrative Charts” (Munroe, 2009), a new vi-
sual technique has emerged as so-called storyline or
plot view visualization (Liu et al., 2013). It aims to
portray the dynamic relationship between entities in a
story over time. (Tanahashi and Ma, 2012) as well as
(Liu et al., 2013) propose design considerations and
an efficient optimization approach for generating aes-
thetically appealing storyline visualizations.
2.2 Visual Text Analytics
In recent years, several approaches for visual text an-
alytics have been introduced in different domains.
Examples can be found in social media (Dou et al.,
2012), opinion mining (Oelke et al., 2009) or patent
analysis (Koch et al., 2011), among others.
There are also quite a number of visual analytics
approaches in the field of literary science. (J
¨
anicke
et al., 2014) propose several techniques for the visu-
alization and comparison of text that is reused in dif-
ferent documents in order to support literary scholars
in discovering and exploring intertextual similarities.
(Abdul-Rahman et al., 2013) present a rule-based so-
lution for poetry visualization allowing for high-level
interactions with the end users in a closed loop. They
use glyphs to encode phonetic units and visual links
to show phonetic and semantic relationships.
The VarifocalReader (Koch et al., 2014) sup-
ports literary scholars by combining distant and close
reading and by enabling intra-document explorations
through advanced navigation concepts. It integrates
machine learning techniques, search mechanisms and
several visual abstractions.
(Oelke et al., 2013) discuss the analysis of prose
literature by using the aforementioned literature fin-
gerprinting technique. Their approach visually ab-
stracts implicit relationships between characters and,
at the same time, encodes their development within
the analyzed novel. However, it does not allow to di-
rectly work with the text resource.
(Vuillemot et al., 2009) present the system
POSvis, which extracts named entities from literary
text and focuses on the exploration of networks of
characters. POSvis offers multiple coordinated views,
including word clouds and self-organizing graphs,
equipped with filter methods to review the vocabu-
lary of novels. While this is closely related to our
work, we do not pursue the goal to review the vocab-
ulary in the context of one or more entities filtered by
part of speech. Instead, we aim to support the analy-
sis of characters and their relationships in the story-
line of a novel, based on named entity extraction and
co-occurrence analyses.
Another system closely related to our work is Jig-
saw (Stasko et al., 2008), which has been designed
to support analysts during foraging and sense-making
activities in collections of textual reports and other
IVAPP 2016 - International Conference on Information Visualization Theory and Applications
30

sets of documents. It provides multiple coordinated
views including lists, scatter plots, word clouds and
graph visualizations that allow tracking entities and
exploring their relationships across the document col-
lections.
Jigsaw has been designed primarily for inter-
document analysis, whereas we are interested in intra-
document analysis, i.e., we support the analysis of a
single text document at a time. Apart from that, Jig-
saw follows a rather generic approach that does not
focus on fictional literature and the analysis of char-
acters but provides general-purpose visualizations for
different kinds of entities extracted from the docu-
ments.
3 VISUAL ANALYSIS
Our approach has been implemented as a web appli-
cation that is easily available to literary scholars and
other user groups, as it does not require any installa-
tion on the user’s side. The implementation is based
on standard web technologies and can be run with a
modern web browser supporting HTML5, SVG, CSS,
and JavaScript.
1
It provides different visual abstrac-
tions representing specific characteristics of the ana-
lyzed novel and highlighting search results that illus-
trate the development of characters in a storyline.
The web application offers automatic methods for
importing novels, extracting characters and places
and visualizing them. The developed visualizations
include word clouds, fingerprints of characters and
places, a graph representation indicating connections
between characters and a plot view that illustrates the
relationships between characters and places in a story
over time.
3.1 Text Processing
There are a variety of formats for the digital represen-
tation of novels. One widely used format is EPUB,
which is a free and open standard that encodes struc-
ture and layout information besides the actual text
of the novel. Many digital libraries, such as Project
Gutenberg
2
, offer ebooks in EPUB format or alterna-
tively as plain text.
EPUB and plain text are also the two formats sup-
ported by our approach. It does not require the plain
text to be structured in a specific way. However, if
the structure of chapters or other metadata should be
1
A public demo of the web application is available at:
http://textvis.visualdataweb.org
2
http://www.gutenberg.org
considered in the analysis, this information must be
given in the text file. We therefore utilize some sim-
ple markup to structure ebooks provided in plain text,
such as those by Project Gutenberg. The markup can
be used to add chapter headings, line breaks and com-
ments as well as other metadata (e.g., the title, au-
thor(s), publication date, publisher, edition or genre
of a book) manually or automatically.
Once the ebook is loaded into the system, it is
processed in a linguistic analysis pipeline, consisting
of tokenization, sentence splitting and named-entity
recognition. The implementation offers three differ-
ent analysis tools that users can choose from: Stan-
ford CoreNLP
3
, OpenNLP
4
and ANNIE
5
. All three
tools perform state-of-the-art natural language pro-
cessing (NLP) but use different techniques that each
have their benefits and limitations. Depending on the
use case and type of novel, users can select the NLP
tool that is most suitable for the analysis. As this is
often not clear from the start, they can also run the
linguistic analysis several times with all three tools,
compare the different outputs and choose the one that
produces the best results. The current implementation
only supports the processing of English texts; how-
ever, it can be extended to other languages if required.
The users can set several other parameters for the
analysis and visualization. Most importantly, they can
control whether stop words are removed and whether
person and place names starting with a lowercase let-
ter should be considered. However, these parameters
are only shown on demand and are intended for the
experienced user. By default, ANNIE is used for NLP
processing and unlikely character and place names
are removed, as these settings, in our experience, pro-
duced the best results for most of the novels we tested.
3.2 Overview Page
After an ebook has been linguistically analyzed, an
overview page is shown, listing metadata about the
book and providing links to the visual abstractions.
As an example, the overview page of the classic ad-
venture novel “Around the World in 80 Days” by Jules
Verne is shown in Figure 1
b
.
Some of the metadata (e.g., the title, author, and
release date) is directly taken from the text source
(if provided), while the determination other meta-
data (e.g., the number of words and chapters) requires
some basic text analysis. Yet other metadata, such as
the main characters listed on the overview page, can
only be determined by using advanced text analysis,
3
http://nlp.stanford.edu/software/corenlp.shtml
4
http://opennlp.apache.org/
5
https://gate.ac.uk/ie/annie.html
Visual Analytics for Narrative Text - Visualizing Characters and their Relationships as Extracted from Novels
31
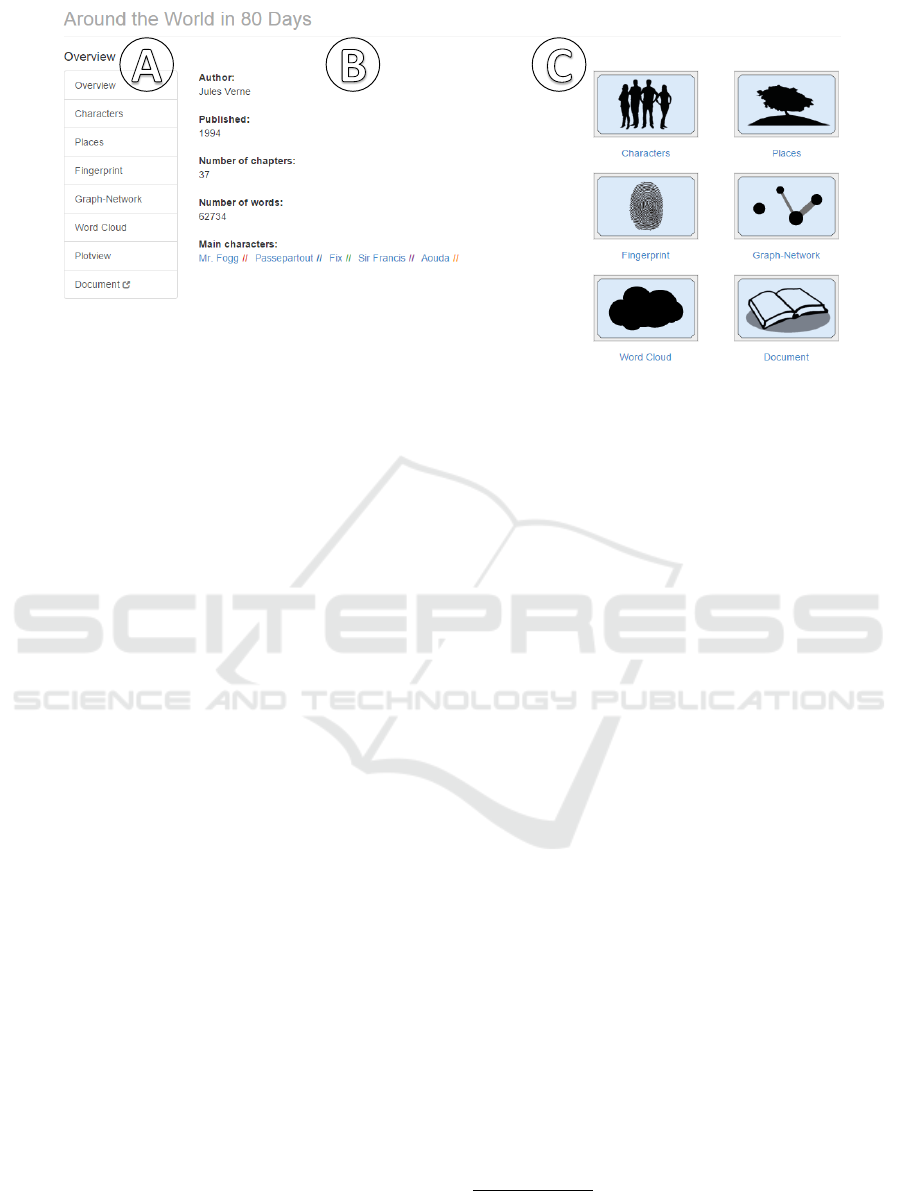
Figure 1: Overview page showing metadata about the novel “Around the World in 80 Days” by Jules Verne.
in this case named-entity recognition. This advanced
text analysis is computationally complex and can take
some time depending on the size of the novel. For in-
stance, the advanced analysis of the novel “Around
the World in 80 Days” with ANNIE requires around
50 seconds on the current server that hosts the demo
application (CPU: Intel Core i7-4930K with 3.4 GHz,
4 GB RAM), whereas the basic analysis is completed
in less than 5 seconds. As a general strategy, we there-
fore decided to show the results of each analysis step
whenever they are available; for example, the web ap-
plication already shows the results of the basic analy-
sis although the advanced analysis is still running.
This strategy also applies to the different visu-
alizations provided by our approach. For instance,
while a basic word cloud visualization can quickly be
generated, the more advanced word cloud as well as
most other visualizations require more sophisticated
NLP processing and can therefore not be shown be-
fore this processing is completed.
The interactive visualizations are available via the
menu on the left (Figure 1
a
), or via the icons on the
right on the overview page (Figure 1
c
). The finger-
print visualizations of the main characters can directly
be opened from the overview page by clicking on
the corresponding links. The main characters are de-
termined by counting their occurrences in the novel,
with those that appear most often in the novel are as-
sumed to be the protagonists. This simple measure
worked surprisingly well for the novels we tested,
in particular, since we also consider variations of the
character names as detailed in Section 3.4.
The application assigns a unique color to each
of the main characters. This color is shown in the
overview page and consistently used for that character
on all pages and in all visualizations. We created two
color schemes, one for users with color vision defi-
ciencies, consisting of four distinct colors determined
by using the ColorBrewer 2.0
6
, and the other for users
with normal vision consisting of seven distinct colors
using the categorical color scheme of D3
7
. If there are
more than seven characters in a novel, the rest of them
are shown in a gray color.
3.3 Characters and Places
To get an overview of the extracted characters and
places, users can open either the characters or places
view. Initially, the most frequently occurring entity is
preselected in both views, complemented by a list of
all extracted entities (Figure 2
c
), where it is possible
to search for and switch between entities.
For each selected entity, a profile is provided,
containing information about its occurrences, the de-
tected gender and alternative names (for characters),
and listing other entities that co-occur most frequently
with that entity (Figure 2
a
). In addition, the finger-
print visualization of the selected entity is shown (Fig-
ure 2
b
).
3.4 Fingerprint Visualization
After the users obtained a first overview, they can fur-
ther analyze the characters and places with the fin-
gerprint visualization. It shows the temporal distribu-
tion of the entity occurrences in the novel. Blue and
red bars represent parts and chapters of a book. Black
blocks depict text segments where the entities occur.
6
http://colorbrewer2.org
7
https://github.com/mbostock/d3/wiki/Ordinal-Scales#
categorical-colors
IVAPP 2016 - International Conference on Information Visualization Theory and Applications
32
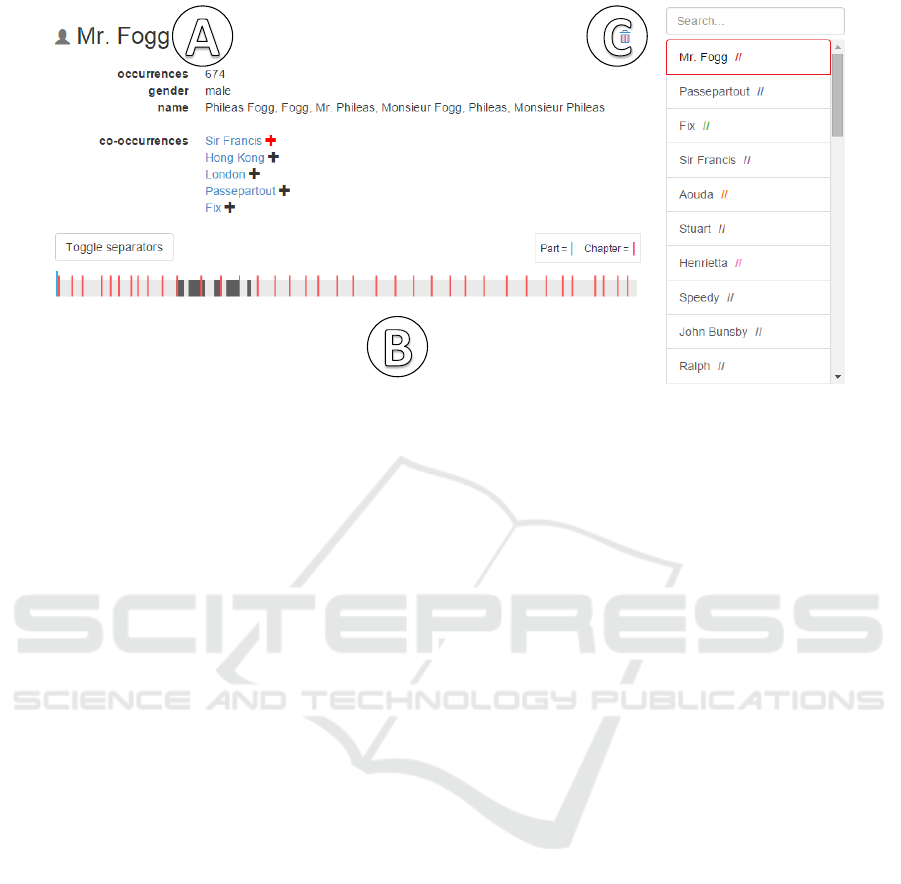
Figure 2: Character view listing information about the character Mr. Fogg extracted from the novel.
By clicking on the toggle separators button, the part
and chapter bars can be hidden to get the ‘plain’ fin-
gerprint.
Longer blocks indicate that entities occur often in
that segment of the book, while shorter blocks appear
when a character or place is only briefly mentioned.
However, a longer block does not necessarily mean
that entities are mentioned in every consecutive sen-
tence, but it is sufficient if they are mentioned every
few sentences.
Users can highlight a block segment by hovering
over it to determine the respective chapter, shown in
a tooltip. By clicking on it, they can jump to the cor-
responding text passage in the novel, which is opened
in the text view. In that view, all occurrences are high-
lighted with the assigned specific color of the entity.
This supports users in finding and analyzing text pas-
sages faster.
In addition, they can select multiple characters or
places to get a combined fingerprint, as depicted in
Figure 3. The example shows the conjunction of two
selected characters (Passepartout and Fix). This way,
users can easily determine text passages where se-
lected characters co-occur.
By default, we define that entities co-occur if
they appear in at least one sentence, which is a
common co-occurrence measure. However, other co-
occurrence measures (number of words, etc.) are also
possible and can be set as internal system parameters
if required.
3.5 Character Network
To further investigate the character relations, users
can switch to the character network view. This view
contains a force-directed graph visualization that rep-
resents connections between characters, as depicted in
Figure 4. The nodes of the graph represent the charac-
ters and the edges the number of sentences in which
each pair of characters co-occurs. The node size and
edge thickness are scaled proportionally to the charac-
ters’ individual and co-occurrence frequency respec-
tively. This helps to get a quick overview of the main
characters and their connections.
The character network is once again comple-
mented by a fingerprint visualization (Figure 4
b
) to
indicate where the characters occur in the novel, and
with a range slider (Figure 4
c
) that lets users limit
the view to a certain range of the novel (e.g., a sin-
gle chapter). This has the advantage that users are
not only enabled to analyze the overall structure of
a novel but also the course of the relationships be-
tween characters, at least on the level of character
co-occurrences. Users can select an edge in the graph
(Figure 4
d
) to display the co-occurrences of two re-
lated characters in the combined fingerprint visualiza-
tion.
Initially, up to seven characters are preselected for
the graph visualization, based on their occurrence fre-
quency. The list of characters is again available in that
view (Figure 4
a
), so that users can search, select and
deselect the characters that are shown in the graph
visualization. That way, the graph visualization can
be dynamically adapted according to the goals of the
user. It can also be panned, zoomed, and rearranged
to further support the analysis.
Visual Analytics for Narrative Text - Visualizing Characters and their Relationships as Extracted from Novels
33
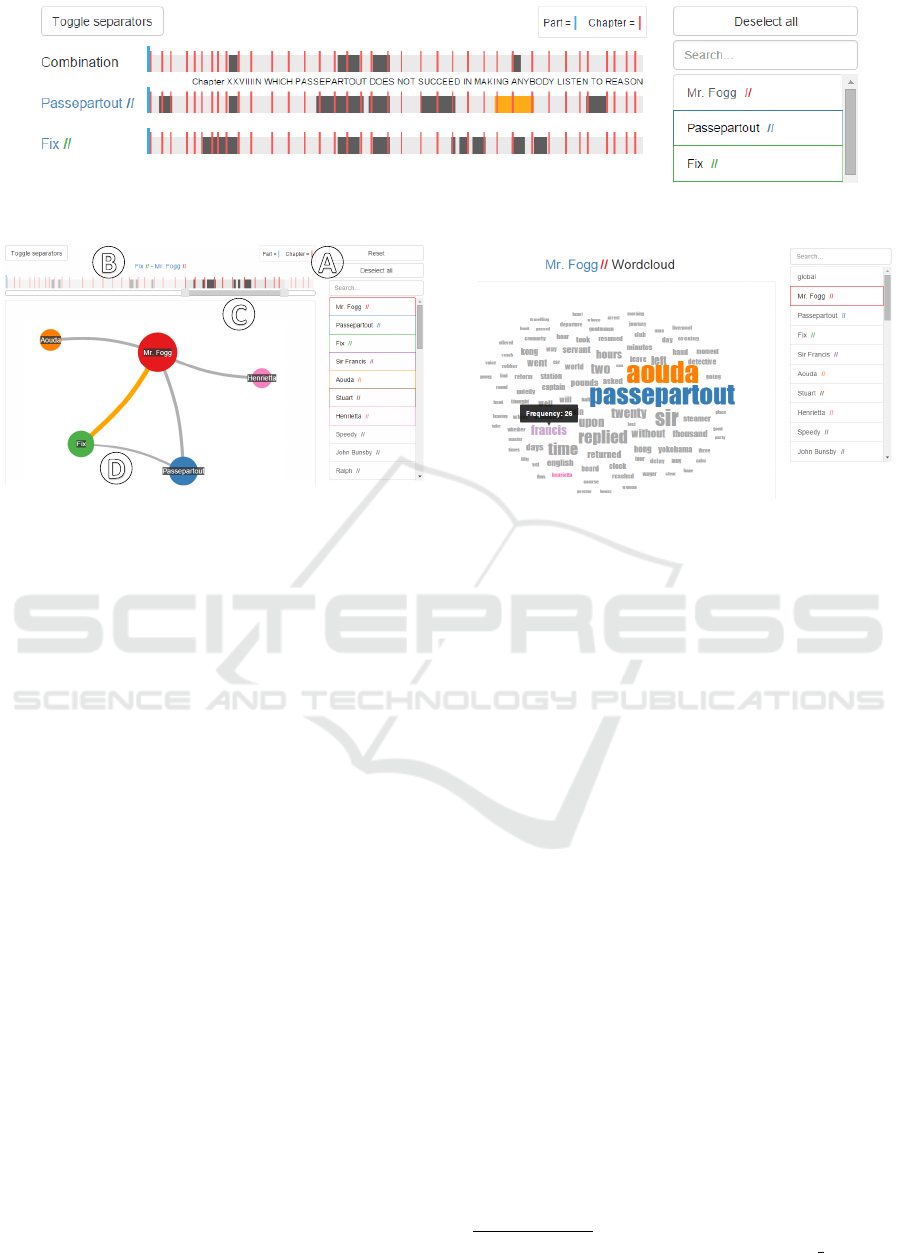
Figure 3: Combined fingerprint visualization showing two selected characters: Passepartout and Fix.
Figure 4: Character network visualization representing the
co-occurrence graph of a selected text segment. This exam-
ple represents connections between the main characters of
the novel “The Lord of the Rings”. The nodes of the graph
represent the characters and the edges the number of sen-
tences in which they co-occur.
3.6 Word Cloud
If users are interested in what is being said near the
characters or in getting a first impression of the con-
tents of the novel, they can switch to the word cloud
view. Word clouds are commonly used by literary
scholars, as they are considered easy to understand
(Clement et al., 2009) despite all their limitations
(McNaught and Lam, 2010). The font size of the vi-
sualized words is scaled proportionally to their oc-
currence frequency, which is additionally shown in a
tooltip on demand.
The user can switch between a global word cloud
representing the entire novel and local word clouds
for the individual characters. The latter show the
words that co-occur most often with the characters,
as depicted in Figure 5 for Mr. Fogg. This gives users
some flexibility in their analysis, by providing a visu-
ally appealing overview of the novel or a novel char-
acter as well as supporting the discovery of new ideas
and hypotheses.
3.7 Plot View
Finally, users can switch to the plot view to get a bet-
ter idea of the dynamic relationships between char-
Figure 5: Word cloud view of the character Mr. Fogg.
acters. It reuses and extends an implementation of
the University of Waterloo
8
, which takes annotation
data and automatically generates narrative charts in
the spirit of the aforementioned “Movie Narrative
Charts” (Munroe, 2009).
Our approach adapts the visualization and dis-
plays the ten most frequently occurring characters as
lines and every chapter as a node (cf. Figure 6
a
). The
horizontal axis represents the plot of the novel and the
vertical grouping of lines indicates which characters
co-occur in the chapters. If two or more lines share
a node, this means that the corresponding characters
co-occur frequently in that chapter. When hovering
over a node, a tooltip lists the characters and places
which co-occur in that chapter. Hovering over a line
highlights the whole line as well as the name of the
corresponding character.
The plot view supports users in getting a rough
idea of the course of the storyline. It allows to quickly
identify when and where characters come together or
go separate ways and whether groups of characters
exist. In the plot view of Figure 6, one can see, for
example, that Mr. Fogg and Fix interact for the first
time in chapter seven (Figure 6
b
), while Aouda and
John Bunsby enter the plot in the middle of the novel
(Figure 6
c
).
8
http://csclub.uwaterloo.ca/
∼
n2iskand/?page id=13/
IVAPP 2016 - International Conference on Information Visualization Theory and Applications
34
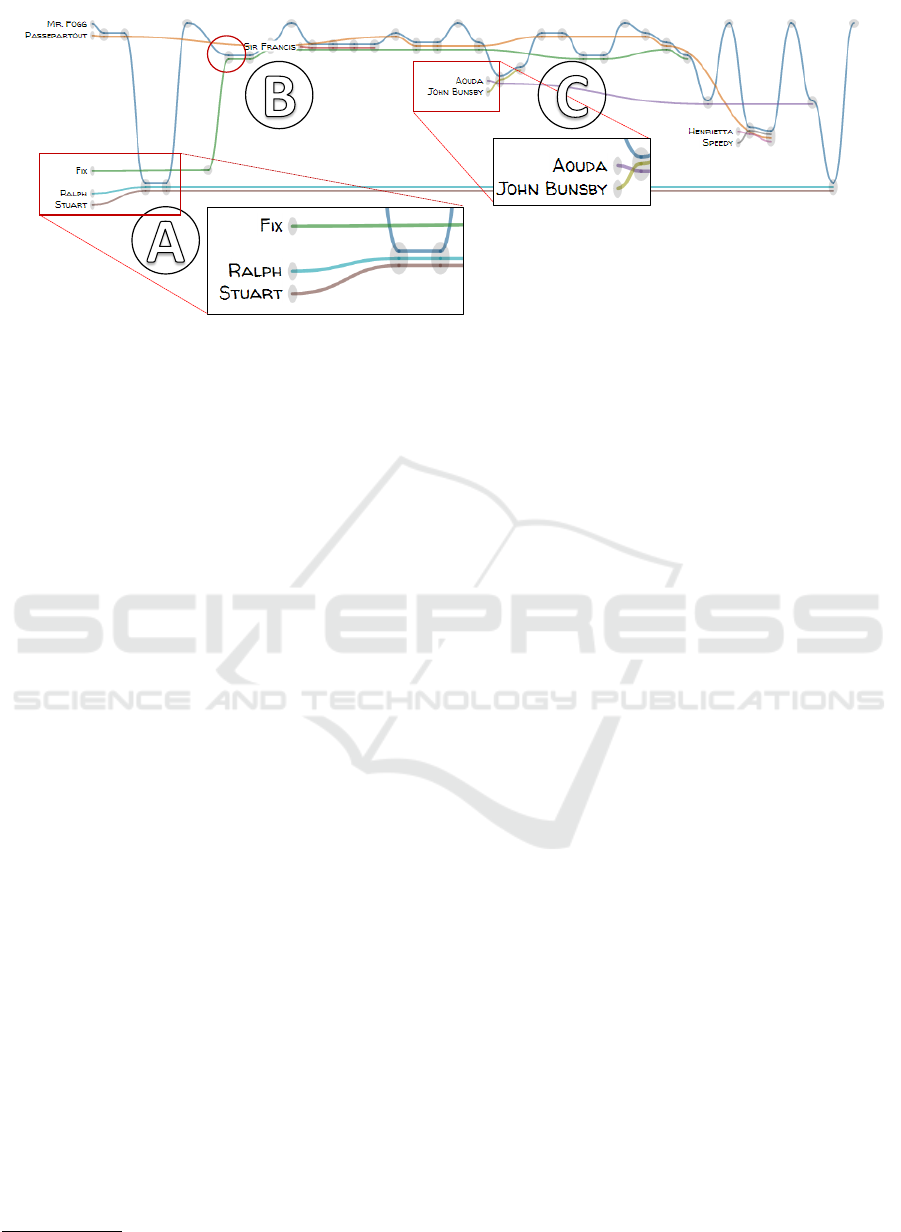
Figure 6: Plot view of Jules Verne’s novel “Around the World in 80 Days”.
3.8 Text View
To support literary scholars in their common work-
flow, we also provide a text view where they can di-
rectly work with the text. Recognized chapters are
listed as hyperlinks on the left (Figure 7
a
), while
the text is presented on the right (Figure 7
b
). The
focused chapter is emphasized with bold type. After
clicking on a chapter, the text view jumps to the begin-
ning of that chapter. If the user reached the text view
from the fingerprint, graph network or word cloud
view, the selected entity or entities are highlighted in
the assigned color. Furthermore, there is a possibility
for searching any other word or text passage as well
as to reset the highlighting with a reset button.
The text view displays a vertical fingerprint next
to its scrollbar. The idea is to provide both a visual
representation of the distribution of entities and the
possibility to inspect a text passage in detail, in or-
der to support a distant and close reading analysis.
When hovering over the fingerprint blocks, the corre-
sponding text passage is displayed in a tooltip (Fig-
ure 7
b
), and after clicking on one, the text view
jumps to the corresponding position. Additionally, the
literary scholars can jump to the next or previous oc-
currence of an entity by clicking on the up and down
arrow buttons.
4 USAGE SCENARIOS
In the following, we present two usage scenarios that
demonstrate the applicability and usefulness of our
approach. In the ePoetics project
9
, we developed ap-
proaches to support the analysis of German poetics
– a form of early scholarly works on literature that
9
http://www.epoetics.de
formed the foundation of modern literature science.
During our collaboration with colleagues from the lit-
erature department, we discussed the usefulness of
direct access to text sources when using visual ab-
stractions. This discussion inspired the development
of an approach for analyzing narrative texts in a simi-
lar way, but taking into account the specific aspects of
the plot and the social network of characters described
in the text.
Although this was not the primary focus of the
project, our colleagues emphasized its usefulness for
their own work and for teaching. We therefore de-
cided to set up a corresponding student project in oder
to find out whether creating such visual abstractions
from text mining results would be possible using off-
the-shelf NLP techniques and tested the applicability
on well-known novels.
For the usage scenarios, we selected a modern and
an old English novel for analysis by a fictitious lit-
erary scholar. She has previous knowledge about the
novels, since she read them some time ago, and is now
trying to retrace the storyline and the important events
by means of our approach.
4.1 Analysis of “Harry Potter and the
Half-Blood Prince”
In our first usage scenario, we present an analysis of
the novel “Harry Potter and the Half-Blood Prince”
by J. K. Rowling. It is the sixth and penultimate novel
in the Harry Potter series and was published in 2009.
The series chronicles the adventures of the young wiz-
ard Harry Potter and his quest to defeat the dark wiz-
ard Lord Voldemort, who strives to rid the wizarding
world of Muggle (non-magical) heritage.
In a first step, the literary scholar explores and an-
alyzes the character and network view. That way, she
Visual Analytics for Narrative Text - Visualizing Characters and their Relationships as Extracted from Novels
35
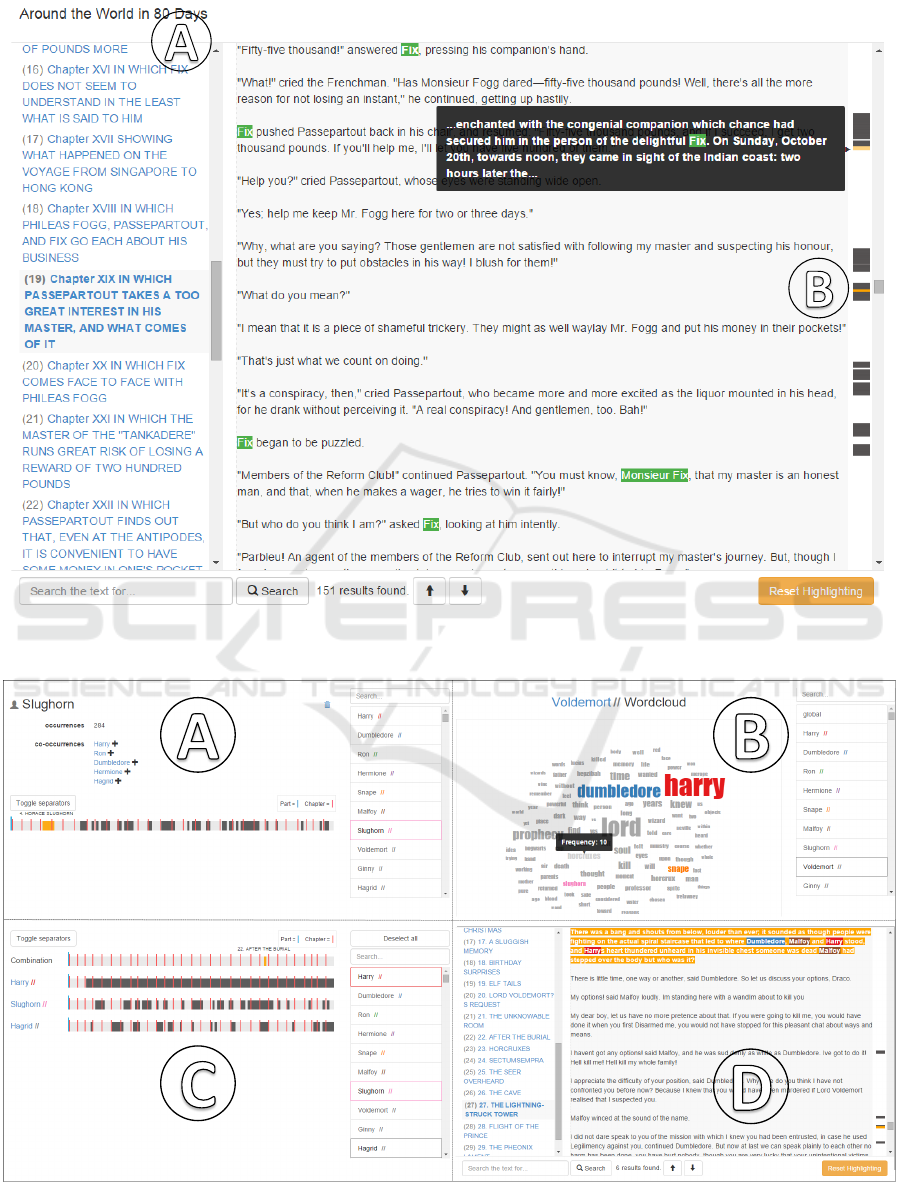
Figure 7: Text view with selected character Fix.
Figure 8: Some of the visualizations used by the literary scholar in the analysis of the novel “Harry Potter and the Half-Blood
Prince”: character view
a
, word cloud
b
, fingerprint visualization
c
and text view
d
.
IVAPP 2016 - International Conference on Information Visualization Theory and Applications
36
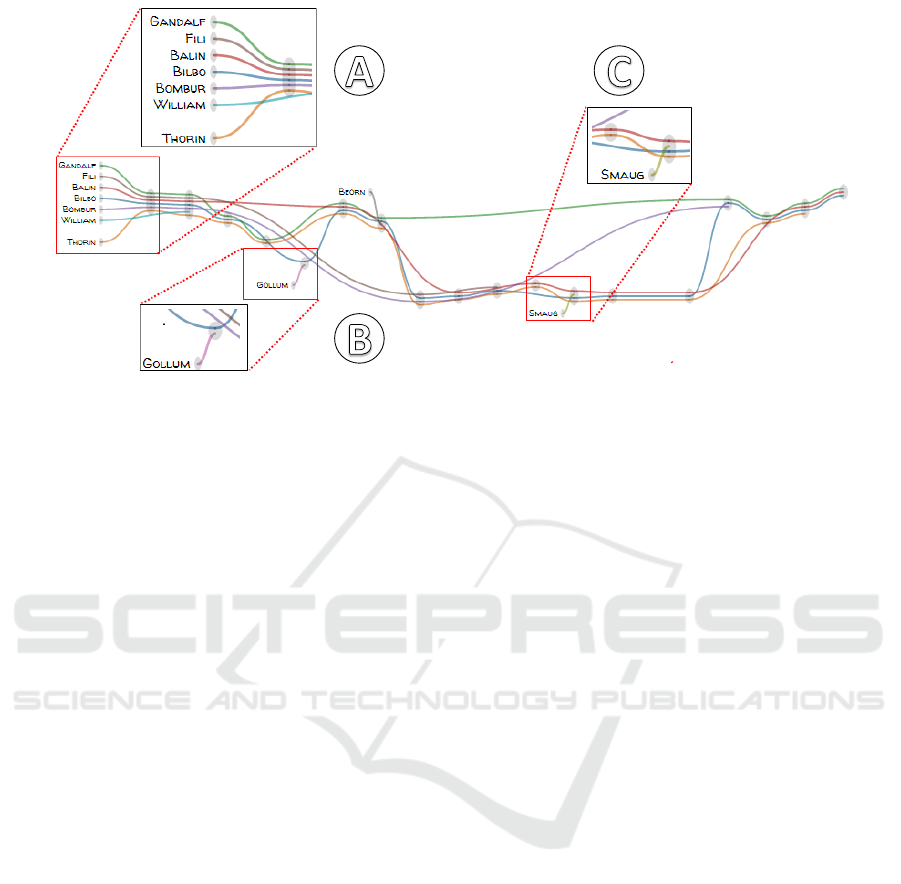
Figure 9: Plot view showing some of the main characters of J. R. R. Tolkien’s novel “The Hobbit”.
gets a quick overview of the main characters and their
relationships. During the analysis, she encounters the
name Slughorn and is surprised because she cannot
remember him. To find out more about Slughorn, she
selects the name in the character view (Figure 8
a
)
and uses the fingerprint visualization to jump directly
to its first occurrence, which is opened in the text
view.
While reading some paragraphs in the text view,
she finds out that Dumbledore, the headmaster of the
wizarding school Hogwarts, convinced Slughorn to
return as potions teacher. Afterwards, she vaguely re-
members that Dumbledore tasked Harry Potter with
retrieving a memory from Slughorn that contains cru-
cial information about Voldemort. To pursue this as-
sumption, she switches to the word cloud view and
explores the word clouds of Slughorn and Voldemort
(Figure 8
b
).
In the word cloud of Voldemort, she identifies the
term Horcrux (an object in which a dark wizard has
hidden a fragment of his soul for the purpose of at-
taining immortality) and remembers a conversation
between Slughorn and Harry Potter at the home of
Hagrid, the gamekeeper of Hogwarts.
In order to find the text passage, she uses the
fingerprint view and selects the three characters
Slughorn, Hagrid and Harry Potter. She determines
that all three characters only co-occur at one text pas-
sage (Figure 8
c
). Consequently, she jumps to that
text passage and finds that Harry Potter succeeds in
retrieving the memory, which shows Voldemort ask-
ing for information on creating Horcruxes.
In the following, she switches to the plot view
since she is interested in examining the course of the
storyline again. She still knows that Dumbledore dies
at the end of the book and that Draco Malfoy, the son
of one of Voldemort’s followers, and Severus Snape,
a professor at Hogwarts, are involved in his death. By
analyzing the different chapters (nodes) and occurring
characters (lines) in the plot view, she quickly recog-
nizes the chapter of Dumbledore’s death and jumps
directly to the text.
With the aid of the vertical fingerprints next to the
text view’s scroll bar, she can easily analyze the rele-
vant text passages as depicted in Figure 8
d
. She con-
firms her recollection that Draco Malfoy was chosen
by Voldemort to kill Dumbledore. Furthermore, she
finds out that Malfoy was unable to bring himself to
do it and that Snape accomplished it with a deadly
curse.
4.2 Analysis of “The Hobbit”
In the second usage scenario, our fictitious literary
scholar analyzes the children’s book “The Hobbit” by
J. R. R. Tolkien. It was published in 1937 and is about
Bilbo, a hobbit and the protagonist, and his adventures
with dwarfs, elves, trolls and a dragon.
To reproduce the course of the novel, she starts
her analysis on the plot view, as depicted in Figure 9.
By scanning the view, she gets a quick overview of
the plot and remembers that Bilbo’s adventure begins
at his home with Gandalf, a wizard, and 13 dwarfs
(Figure 9
a
).
After jumping to the text and reading some pas-
sages in the text view, she remembers that they want
to recover the treasure from Erebor (also known as the
Lonely Mountain, former home to the greatest dwarf
kingdom) and Bilbo is hired as their “burglar”, since
hobbits are small and unobtrusive.
Once she returns to the plot view, she notices
the name of the creature Gollum (Figure 9
b
) (origi-
Visual Analytics for Narrative Text - Visualizing Characters and their Relationships as Extracted from Novels
37
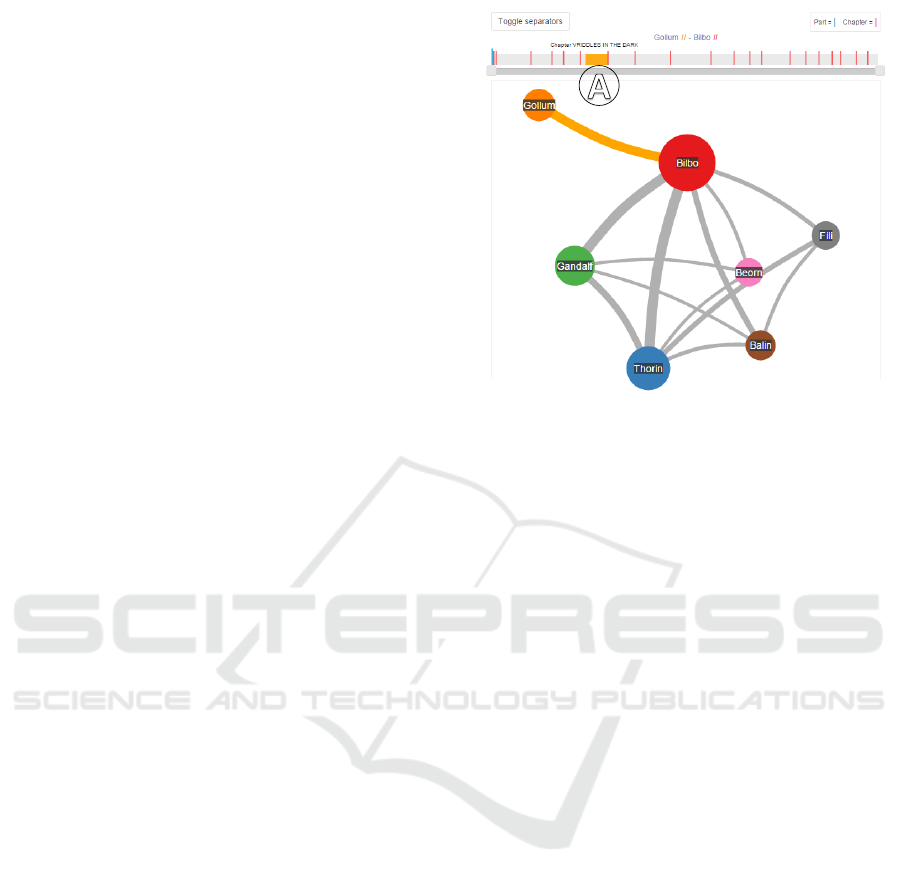
nally a hobbit) and recalls that Bilbo wins a magical
ring from him in a riddle war. However, she is un-
sure which further role Gollum plays in the plot and
whether he co-occurs with other characters. To gain
insights into this question, she switches to the graph
view and immediately recognizes that only a relation-
ship between Gollum and Bilbo exist, as depicted in
Figure 10
a
. Subsequently, she activates the character
view of Gollum to examine his fingerprint visualiza-
tion, and thus confirms that he only appears at this
point within the novel.
As the next step, she further analyzes the plot view
and discovers that Smaug (Figure 9
c
), a great fire
dragon, enters the plot at the end of the novel. The
literary scholar knows that Smaug invaded the dwarf
kingdom of Erebor a long time ago and now guards
the treasure. She vaguely remembers that Bilbo and
the dwarfs are searching for a specific treasure ob-
ject. To inspect this assumption, she switches to the
text view and jumps to the text passage where Smaug
occurs for the first time in the plot. While reading,
she finds out that the searched-for object is the Arken-
stone, a great jewel.
In order to get more information on the Arken-
stone, she uses the keyword search to highlight all
occurrences as vertical fingerprints next to the text
view’s scroll bar. By analyzing the text passages, she
determines, for example, that the Arkenstone is a heir-
loom of the dwarf kings and that, at the end of the
novel, it is placed upon Thorin’s, the legitimate king
of Erebor’s, chest within his tomb deep under the
Lonely Mountain.
The usage scenarios show that our approach pro-
vides literary scholars with visual abstractions that fa-
cilitate character analysis in novels. Through the de-
veloped set of visual and automatic methods, we sup-
port them in confirming and generating hypotheses,
confirming recollections and gaining insights.
5 DISCUSSION AND FUTURE
WORK
Our approach was developed to support intra-
document analysis by visualizing the dynamic rela-
tion between characters, and not for a comparative
text of novels. However, we provide several visual ab-
stractions, which offer different views on the text to
support literary scholars in their analysis.
The approach can be flexibly extended by addi-
tional visual abstractions. For example, views that
support literary scholars with visualizations of geo-
graphical information (J
¨
anicke et al., 2012) could be
integrated if the novel’s setup is based on the real
Figure 10: Character network view showing some of the
main characters of “The Hobbit” and their co-occurrence
frequencies.
world or offers own cartographic material.
In addition, the visual abstractions could be im-
proved and extended. One such extension could be
different graph layouts for the character network to
get a better impression of the constellation of char-
acters or to add more information, such as semantic
relations between characters. This would enable liter-
ary scholars to recognize relationships between char-
acters even better.
A further possibility might be to expand the plot
view with automatically detected specific events (e.g.,
the “Battle of Helm’s Deep” in case of the novel “The
Lord of the Rings”). Thereby, literary scholars could
better track and identify the course of the story.
Our visual abstractions are based on out-of-the-
box natural language processing toolkits and we are
interested in examining how far we can get in sup-
porting literary scholars with their analysis. Natural
language processing methods have continuously im-
proved and show strong robustness. Typically, they
are rule-based, or rely on statistical and machine
learning approaches, which have been trained on
available modern newspaper or journal article texts,
since large trainings sets are most often available for
these types of texts. As a consequence, natural lan-
guage processing techniques could be less effective
when applied to a very specific type of text, such as
historical or fictional novels.
This can lead to uncertainties and errors in the
visual abstractions. As a consequence, uncritical in-
terpretation of such visual representations can cause
confusion and misunderstandings. Visualization can
play an important role in addressing these problems
IVAPP 2016 - International Conference on Information Visualization Theory and Applications
38

in the future. We intend to provide visual clues on the
quality of automatic analyses (if available), for exam-
ple, through color and opacity. This could help literary
scholars to interpret automatically generated results.
Furthermore, we want to let users steer and adapt
techniques interactively according to their needs. As
a result, automatic methods can be improved and ap-
plied to similar texts.
The current implementation of the detection of co-
occurrences between entities is based on named en-
tity recognition. We determine that two entities co-
occur if they both appear at least in one sentence.
This approach works well in many cases. However, it
can be improved in various aspects. One option could
be to let the literary scholars set the co-occurrences
range variable, for example, several sentences or a
whole paragraph. Additionally, methods for corefer-
ence resolution might be integrated, to detect more
instances and compute more precise frequency val-
ues for entities. Coreference resolution is the task of
resolving noun phrases to the entities that they re-
fer to and there already exist robust methods (Raghu-
nathan et al., 2010; Stoyanov et al., 2010). Existing
approaches are usually trained on non-fictional texts
and have to be adapted (where appropriate) to the
users’ needs.
In the future, we plan to take the semantics of the
text into account in order to better investigate the re-
lationships between entities. Again, already existing
approaches (Gildea and Jurafsky, 2002; Ruiz-Casado
et al., 2007) could be integrated into our approach
to provide the literary scholars with more informa-
tion for their analysis. In general, we aim at support-
ing a broader spectrum of natural language processing
methods in the future.
Another issue is the challenge of scalability when
working with arbitrarily long novels. Most of our vi-
sual abstractions scale very well. However, the finger-
print visualization and the plot view become less use-
ful with longer text. Since the available screen space
remains the same, they are increasingly compressed
until they overlap. To address this problem in the fu-
ture, we could integrate a focus+context technique,
such as fisheye distortion (Bederson, 2000), to present
detailed information in context, or an overview+detail
approach to present multiple views with different lev-
els of abstractions (Cockburn et al., 2009).
6 CONCLUSION
In this work, we presented an easily accessible web-
based approach for visualizing the relation of charac-
ters and places in a novel. Our approach includes dif-
ferent natural language processing toolkits to extract
named entities and possibilities to set parameters for
variable analyses. Furthermore, we provide several vi-
sual abstractions, which support literary scholars with
a flexible and comprehensive analysis of the novel
characters. In particular, our approach facilitate dis-
tant reading and provide a starting point for new ideas,
hypotheses and further analyses. All views enable lit-
erary scholars to jump to the corresponding text pas-
sage and thus allow for working with the text directly.
We presented an implementation of the approach and
provided two usage scenarios that illustrate its appli-
cability and usefulness.
ACKNOWLEDGEMENTS
We would like to thank our students Sanjeev Balakr-
ishnan, Felix Do, Sebastian Frank, Paul Kuznecov,
Vincent Link, Eduard Marbach, Jan Melcher, Chris-
tian Richter, Marc Weise, and Marvin Wyrich who
implemented the approach in a student project. This
work has partly been funded by the German Federal
Ministry of Education and Research (BMBF) as part
of the ‘ePoetics’ project.
REFERENCES
Abdul-Rahman, A., Lein, J., Coles, K., Maguire, E., Meyer,
M., Wynne, M., Johnson, C. R., Trefethen, A., and
Chen, M. (2013). Rule-based visual mappings – with a
case study on poetry visualization. Computer Graph-
ics Forum, 32(3pt4):381–390.
Bederson, B. (2000). Fisheye menus. In Proceedings of
the 13th Annual ACM Symposium on User interface
Software and Technology, pages 217–225. ACM.
Clement, T., Plaisant, C., and Vuillemot, R. (2009). The
story of one: Humanity scholarship with visualization
and text analysis. In Proceedings of the Digital Hu-
manities Conference, DH ’09.
Cockburn, A., Karlson, A., and Bederson, B. (2009). A re-
view of overview+detail, zooming, and focus+context
interfaces. ACM Computing Surveys, 41(1):1–31.
Don, A., Zheleva, E., Gregory, M., Tarkan, S., Auvil, L.,
Clement, T., Shneiderman, B., and Plaisant, C. (2007).
Discovering interesting usage patterns in text collec-
tions: Integrating text mining with visualization. In
Proceedings of the 16th ACM Conference on Con-
ference on Information and Knowledge Management,
CIKM ’07, pages 213–222. ACM.
Dou, W., Wang, X., Skau, D., Ribarsky, W., and Zhou, M.
(2012). Leadline: Interactive visual analysis of text
data through event identification and exploration. In
Proceedings of the IEEE Conference on Visual Ana-
lytics Science and Technology, VAST ’12, pages 93–
102.
Visual Analytics for Narrative Text - Visualizing Characters and their Relationships as Extracted from Novels
39

Eick, S., Steffen, J., and Sumner, E.E., J. (1992). Seesoft
– a tool for visualizing line oriented software statis-
tics. IEEE Transactions on Software Engineering,
18(11):957–968.
Gildea, D. and Jurafsky, D. (2002). Automatic labeling of
semantic roles. Computational linguistics, 28(3):245–
288.
Hearst, M. A. (1995). Tilebars: Visualization of term dis-
tribution information in full text information access.
In Proceedings of the SIGCHI Conference on Human
Factors in Computing Systems, CHI ’95, pages 59–66.
ACM/Addison-Wesley.
Heimerl, F., Lohmann, S., Lange, S., and Ertl, T. (2014).
Word cloud explorer: Text analytics based on word
clouds. In 47th Hawaii International Conference
on System Sciences, HICCS ’14, pages 1833–1842.
IEEE.
J
¨
anicke, S., Franzini, G., Cheema, M. F., and Scheuermann,
G. (2015). On Close and Distant Reading in Digi-
tal Humanities: A Survey and Future Challenges. In
Eurographics Conference on Visualization – STARs,
EuroVis ’15. Eurographics Association.
J
¨
anicke, S., Geßner, A., B
¨
uchler, M., and Scheuermann, G.
(2014). Visualizations for text re-use. In Proceedings
of the 5th International Conference on Information
Visualization Theory and Applications, IVAPP ’14,
pages 59–70. INSTICC.
J
¨
anicke, S., Heine, C., Stockmann, R., and Scheuermann,
G. (2012). Comparative visualization of geospatial-
temporal data. In Proceedings of the 3rd International
Conference on Information Visualization Theory and
Applications, IVAPP ’14, pages 613–625. INSTICC.
Keim, D. and Oelke, D. (2007). Literature fingerprinting:
A new method for visual literary analysis. In Pro-
ceedings of the IEEE Symposium on Visual Analytics
Science and Technology, VAST ’07, pages 115–122.
Koch, S., Bosch, H., Giereth, M., and Ertl, T. (2011). It-
erative integration of visual insights during scalable
patent search and analysis. IEEE Transactions on Vi-
sualization and Computer Graphics, 17(5):557–569.
Koch, S., John, M., Worner, M., Muller, A., and Ertl, T.
(2014). Varifocalreader – in-depth visual analysis of
large text documents. IEEE Transactions on Visual-
ization and Computer Graphics, 20(12):1723–1732.
Liu, S., Wu, Y., Wei, E., Liu, M., and Liu, Y. (2013).
Storyflow: Tracking the evolution of stories. IEEE
Transactions on Visualization and Computer Graph-
ics, 19(12):2436–2445.
McNaught, C. and Lam, P. (2010). Using wordle as a
supplementary research tool. The qualitative report,
15(3):630–643.
Moretti, F. (2005). Graphs, maps, trees: abstract models for
a literary history. Verso.
Munroe, R. (2009). Movie narrative charts.
http://xkcd.com/657/.
Oelke, D., Hao, M., Rohrdantz, C., Keim, D., Dayal, U.,
Haug, L., and Janetzko, H. (2009). Visual opinion
analysis of customer feedback data. In Proceedings
of the IEEE Symposium on Visual Analytics Science
and Technology, VAST ’09, pages 187–194.
Oelke, D., Kokkinakis, D., and Keim, D. A. (2013). Fin-
gerprint matrices: Uncovering the dynamics of social
networks in prose literature. Computer Graphics Fo-
rum, 32(3pt4):371–380.
Phelan, J. (1989). Reading people, reading plots: Charac-
ter, progression, and the interpretation of narrative.
University of Chicago Press.
Plaisant, C., Rose, J., Yu, B., Auvil, L., Kirschenbaum,
M. G., Smith, M. N., Clement, T., and Lord, G.
(2006). Exploring erotics in emily dickinson’s corre-
spondence with text mining and visual interfaces. In
Proceedings of the 6th ACM/IEEE-CS Joint Confer-
ence on Digital libraries, pages 141–150. ACM.
Raghunathan, K., Lee, H., Rangarajan, S., Chambers, N.,
Surdeanu, M., Jurafsky, D., and Manning, C. (2010).
A multi-pass sieve for coreference resolution. In Pro-
ceedings of the 2010 Conference on Empirical Meth-
ods in Natural Language Processing, EMNLP ’10,
pages 492–501. ACL.
Ruiz-Casado, M., Alfonseca, E., and Castells, P. (2007).
Automatising the learning of lexical patterns: An ap-
plication to the enrichment of wordnet by extract-
ing semantic relationships from wikipedia. Data &
Knowledge Engineering, 61(3):484–499.
Stasko, J., G
¨
org, C., and Liu, Z. (2008). Jigsaw: Support-
ing investigative analysis through interactive visual-
ization. Information Visualization, 7(2):118–132.
Stoyanov, V., Cardie, C., Gilbert, N., Riloff, E., Buttler, D.,
and Hysom, D. (2010). Coreference resolution with
reconcile. In Proceedings of the ACL 2010 Conference
Short Papers, pages 156–161. ACL.
Tanahashi, Y. and Ma, K.-L. (2012). Design considera-
tions for optimizing storyline visualizations. IEEE
Transactions on Visualization and Computer Graph-
ics, 18(12):2679–2688.
Van Ham, F., Wattenberg, M., and Viegas, F. (2009). Map-
ping text with phrase nets. IEEE Transactions on Visu-
alization and Computer Graphics, 15(6):1169–1176.
Vi
´
egas, F. B. and Wattenberg, M. (2008). Tag clouds and
the case for vernacular visualization. interactions,
15(4):49–52.
Vuillemot, R., Clement, T., Plaisant, C., and Kumar, A.
(2009). What’s being said near “martha”? exploring
name entities in literary text collections. In Proceed-
ings of the IEEE Symposium on Visual Analytics Sci-
ence and Technology, 2009, VAST ’09, pages 107–
114.
Wattenberg, M. and Viegas, F. (2008). The word tree, an in-
teractive visual concordance. IEEE Transactions on
Visualization and Computer Graphics, 14(6):1221–
1228.
IVAPP 2016 - International Conference on Information Visualization Theory and Applications
40
